

Abstract
Purpose.
To determine the effects of serial expansion on the cellular, molecular, and functional properties of human iPS cell (hiPSC)-derived RPE cultures.
Methods.
Fibroblasts obtained from four individuals were reprogrammed into hiPSCs and differentiated to RPE cells using previously described methods. Patches of deeply pigmented hiPSC-RPE were dissected, dissociated, and grown in culture until they re-formed pigmented monolayers. Subsequent passages were obtained by repeated dissociation, expansion, and maturation of RPE into pigmented monolayers. Gene and protein expression profiles and morphological and functional characteristics of hiPSC-RPE at different passages were compared with each other and to human fetal RPE (hfRPE).
Results.
RPE from all four hiPSC lines could be expanded more than 1000-fold when serially passaged as pigmented monolayer cultures. Importantly, expansion of hiPSC-RPE monolayers over the first three passages (P1–P3) resulted in decreased expression of pluripotency and neuroretinal markers and maintenance of characteristic morphological features and gene and protein expression profiles. Furthermore, P1 to P3 hiPSC-RPE monolayers reliably demonstrated functional tight junctions, G-protein–coupled receptor-mediated calcium transients, phagocytosis and degradation of photoreceptor outer segments, and polarized secretion of biomolecules. In contrast, P4 hiPSC-RPE cells failed to form monolayers and possessed altered morphological and functional characteristics and gene expression levels.
Conclusions.
Highly differentiated, pigmented hiPSC-RPE monolayers can undergo limited serial expansion while retaining key cytological and functional attributes. However, passaging hiPSC-RPE cultures beyond senescence leads to loss of such features. Our findings support limited, controlled passaging of patient-specific hiPSC-RPE to procure cells needed for in vitro disease modeling, drug screening, and cellular transplantation.
Keywords: induced pluripotent stem cell, retinal pigment epithelium, passaging
Human hiPSC-RPE maintain their key cellular and functional characteristics with limited passaging and expansion.
Introduction
Degenerative disorders that target the RPE, such as AMD, lead to blindness in large part due to loss of functional support for neighboring photoreceptors.1 Examples of critical supportive functions of RPE include photoreceptor outer segment (POS) phagocytosis and degradation, maintenance of the outer blood-retinal barrier, secretion of paracrine factors, and regulation of ion and fluid homeostasis, among others.2 Access to renewable sources of highly functional and expandable human RPE would be ideal for studying these cells and developing therapies to preserve or replace them. Although human fetal RPE (hfRPE) derived from donor tissue remains the culture standard, patient-specific, human-induced pluripotent stem cells (hiPSCs) have emerged as an important and ethically neutral source of RPE for disease modeling,3–5 drug testing,3 and transplantation.6,7
Production of RPE from heterogeneous cultures of differentiating hiPSCs occurs with varying efficiency, often necessitating the isolation and expansion of hiPSC-RPE populations prior to further use.8–11 However, even in highly enriched cultures there is concern that the cellular and epithelial properties of hiPSC-RPE are prone to differ between lines and/or passages.12 Key parameters evaluated in almost all hiPSC-RPE studies thus far include cell morphology, gene and protein expression, transepithelial resistance (TER), and POS phagocytosis.9,13,14 Fewer reports have examined functions such as POS degradation, polarized secretion of bioactive molecules, and G-protein coupled receptor (GPCR)-mediated calcium release, and none has focused on the stepwise effect of passaging and expansion on these physical and functional characteristics. In the present study, we show that hiPSC-RPE derived from four different individuals can be expanded more than 1000-fold in culture over three passages, with cells from each consecutive passage possessing the capacity to re-form confluent pigmented monolayer cultures prior to dissociation and reseeding. By culturing hiPSC-RPE in this fashion, we were able to assess the features and functions of a single, successive cell population at each passage. We found that limited passaging resulted in improved hiPSC-RPE purity and retention of critical cellular properties; however, harvesting and culturing cells past senescence led to significant loss of RPE characteristics in vitro.
Methods
Production of hiPSC Lines and Differentiation Into RPE
Skin biopsy samples were obtained from four individuals with informed written consent in accordance with the Declaration of Helsinki and approval from the Institutional Review Board at the University of Wisconsin-Madison. Two of the subjects had no known retinal diseases (wild type; WT), whereas the other two harbored heterozygous mutations in the BEST1 gene resulting in autosomal dominant Best vitelliform macular dystrophy (BVMD).5 hiPSC lines were derived from the skin biopsies using established methods,3,5 maintained in iPS cell medium (Dulbecco's modified Eagle's medium [DMEM]/F12 (1:1), 20% knockout serum replacement, 1% MEM nonessential amino acids, 100 ng/mL BFGF, 1 mM L-glutamine, and 0.1 mM β-mercaptoethanol [β-ME]), and differentiated to RPE using our previously described protocol.3,11,15 Patches of pigmented RPE cells were microdissected from differentiating hiPSC cultures using a micro-sharp blade (Beaver Visitec International, Waltham, MA), dissociated with Trypsin-EDTA (0.05%), and reseeded onto laminin-coated transwell inserts (Cat# 3470; Corning, Tewksbury, NY). hiPSC-RPE cells plated on transwells were cultured in retinal differentiation medium (RDM) (DMEM/F12 (3:1), 2% B27 supplement without retinoic acid, 1% penicillin/streptomycin/amphotericin B) + 10% fetal bovine serum [FBS] for the first 2 days and then switched to RDM + 2% FBS until the cells became confluent. In a subset of experiments, after reseeding on transwells, RPE cells were maintained in medium devoid of FBS (RDM + 20 ng/mL epidermal growth factor, 20 ng/mL FGF2, and 5 μg/mL heparin) until they became confluent. After reaching confluency, all hiPSC-RPE cultures were maintained in serum-free RDM to allow them to mature and form pigmented monolayers. hiPSC-RPE cells initially plated on transwells were passaged up to four times by dissociating mature monolayers with Trypsin-EDTA (0.05%) and replating them either onto transwells or nonpermeable plastic supports (96-, 24-, or 6-well plates).
Selection of hiPSC Lines for Cytologic and Biochemical Studies
Data from all four hiPSC lines (WT and BVMD) were included in experiments examining the effects of hiPSC-RPE passaging on culture expansion, cell morphology, gene and protein expression profiles, and tight junction formation, since a prior study5 demonstrated that these particular characteristics were unaffected by the presence of the BEST1 mutations in the BVMD lines. For other tested hiPSC-RPE properties that are or could be affected by BEST1 mutations,5 only WT hiPSC-RPE was used for comparisons of pooled data across passages and to hfRPE cultures.
Culture of Human Fetal RPE
RPE was dissected from human prenatal donor tissue and monolayer hfRPE cultures were established using a previously published protocol.16 Thereafter, hfRPE (passages 2–4) was cultured on transwells and plastic supports as described above for hiPSC-RPE.
TER Measurements
TER of hiPSC-RPE and hfRPE monolayers cultured on transwell filters was measured using an epithelial volt-ohm meter (EVOM2) following manufacturer's instructions (World Precision Instruments, Sarasota, FL). Briefly, electrodes were sterilized with 70% ethanol, rinsed in Hank's balanced salt solution, and placed in the transwell filter. The net TER was calculated from the TER recordings by subtracting the background measurement obtained from laminin-coated transwell filters without cells. TER measurements were obtained by multiplying TER values with the surface area of the transwell filters and reported as Ω*cm2.
Immunocytochemistry Analysis
hiPSC-RPE and hfRPE cells were washed once in ice-cold PBS and fixed in 2% to 4% paraformaldehyde on ice for 30 minutes. Thereafter, fixed cells were washed twice in PBS and placed in blocking solution (10% normal donkey or goat serum and 0.01%–0.5% Triton X-100 in PBS) for 1 hour at room temperature. Cells were then incubated overnight at 4°C with the following primary antibodies: goat anti-NANOG (1:100; R&D Systems, Minneapolis, MN), goat anti-OCT4 (1:1000; Santa Cruz Biotechnology, Santa Cruz, CA), mouse anti-SSEA4 (1:500; Millipore, Billerica, MA), mouse anti-TRA-1-81 (1:1000; Millipore), rabbit anti-RCVRN (1:2000; Millipore), rabbit anti-S100 (1:300; Abcam, Cambridge, MA), mouse anti-BEST1 (1:100; Millipore), rabbit anti-EZRIN (1:100; Cell Signaling, Danvers, MA), rabbit anti-ZO-1 (1:100; Life Technologies, Grand Island, NY), mouse anti-ACTA2 (1:100; Abcam), and rabbit anti-KRT18 (1:1000; Abcam). The following day, cells were washed three to five times in PBS-TX (0.01% Triton X-100) and incubated with appropriate Alexa-labeled secondary antibodies (1:500; Life Technologies). After secondary antibody incubation, cells were stained with DAPI, washed three times in PBS-TX, mounted using Prolong Gold (Life Technologies), and imaged on a confocal microscope (Nikon C1; Nikon Instruments, Inc., Melville, NY).
RT-PCR and Quantitative RT-PCR
Total RNA was extracted (RNeasy Plus Mini Kit; Qiagen, Valencia, CA) and cDNA was synthesized (iScript cDNA Synthesis Kit; Bio-Rad, Hercules, CA) according to manufacturer's instructions. During RNA preparation, DNase1 treatment was carried out to remove any genomic DNA contamination. PCR products were visualized with ethidium bromide on 2% agarose gels. Quantitative PCR (qPCR) experiments (40 cycles) were performed on the cDNA samples using gene-specific primers (listed in Supplementary Table S1), SsoAdvanced SYBR Green Supermix (Bio-Rad), and a Bio-Rad C1000 thermal cycler. qPCR results were analyzed using Bio-Rad CFX software and Microsoft Excel (Microsoft, Redmond, WA).
Measurements of ATP, VEGF, and PEDF Secretion
Pigmented hiPSC-RPE and hfRPE monolayers (TER ≥ 250 Ω*cm2) plated on transwells were fed with RDM in both the apical and basal chambers; 24 hours later, a fraction of the medium was collected separately from each chamber. The amount of ATP in the media samples was determined using a luciferase-based assay (Cat# FF2000; Promega, Madison, WI) per the manufacturer's instructions. VEGF and PEDF levels were measured with commercially available ELISA kits (VEGF: Cat# DVE00; R&D Systems; PEDF: Cat# CYT420, Millipore), also in accordance with the manufacturer's instructions.
Calcium Imaging
Pigmented hiPSC-RPE and hfRPE monolayers grown on coverslips were used for calcium imaging experiments. RPE cells were incubated with 10 μM Fura-2-AM (Calbiochem, San Diego, CA) and 0.02% Pluronic F127 (BASF, Mount Olive, NJ) for 1 hour at 37°C. Cells were subsequently washed for 30 minutes and placed in the recording chamber on an inverted microscope (Nikon Eclipse Ti; Nikon). To prevent dye leakage and reduce cellular stress levels, 1 mM probenecid and 500 μM glutathione was added to the cell-loading and recording solution. Fura-2-AM emission ratios at 510 nm were obtained with alternating exposures at 340 and 380 nm, and images were acquired every 2 seconds using a Photometrics Cascade 512B camera (Photometrics, Tucson, AZ). ATP-stimulated changes in intracellular Ca2+ were obtained by exposing RPE cells to 100 μM ATP for 2 minutes during recording. Calcium imaging data were analyzed using Metamorph software (Indec, Santa Clara, CA), and intracellular calcium concentrations ([Ca2+]i) of RPE cells were calculated using an in vitro calibration curve generated with Fura-2 standards (Life Technologies).
Preparation of Bovine Photoreceptor Outer Segment (POS)
Bovine retina was dissected from freshly isolated bovine eyes under dim red light. POS were isolated by placing the bovine retina over a 25% to 60% continuous sucrose gradient buffer (sucrose, 20 mM tris acetate, 5 mM taurine, and 10 mM glucose) and centrifuging at 100,000g for 50 minutes at 4°C. The POS-containing layer was collected, rinsed once in wash buffer (20 mM tris acetate and 5 mM taurine), resuspended in 5 mL DMEM, aliquoted, and stored at −80°C until further use. To label POS with FITC, POS were incubated with FITC isomer 1 (0.4 mg/mL, F-1907, Life Technologies) overnight at 4°C in buffer 1 (10% sucrose, 20 mM sodium phosphate, and 5 mM taurine). Subsequently, FITC-labeled POS were rinsed in wash buffer, centrifuged, resuspended in DMEM, aliquoted, and stored at −80°C until further use.
Phagocytosis Assays
Phagocytosis assays were performed on hiPSC-RPE and hfRPE cells grown as monolayers on either 96-well plates or transwells that had attained characteristic morphology and pigmentation. Two different assays were used to evaluate phagocytosis and degradation of POS. In the first assay, RPE cells were incubated with unlabeled POS (20 POS/RPE cell) for 2 hours. Thereafter, the RPE cells were washed thoroughly with 1× PBS four to five times by vigorous pipetting to remove any POS that had not been phagocytosed (designated as the 0 hour time point). RPE cells at 0-, 4-, 24-, and 48-hour time points after POS feeding were washed twice with 1× PBS and harvested for protein isolation. Protein isolated from RPE at these time points underwent Western blot analysis to determine the time course of rhodopsin degradation. RPE cultures that had not been fed POS served as controls in these experiments. In the second phagocytosis assay, RPE cells were fed FITC-labeled POS (20 POS/RPE cell) for 2 hours and then washed four times vigorously with 1× PBS. Subsequently, RPE cells were collected either immediately (0 hour time point) or 24 hours post-POS feeding, whereupon fluorescence-activated cell sorting (FACS) was used to quantify the number of FITC-labeled cells remaining in the RPE samples. Of note, for phagocytosis experiments in which a confluent RPE monolayer was not present (i.e., passage 4 hiPSC-RPE), the amount of POS loaded per well was calculated based on the surface area of the transwell filter in order to provide equivalent coverage.
Fluorescence-Activated Cell-Sorting Analysis
hiPSC-RPE and hfRPE cells fed with FITC-labeled POS were gently dissociated with trypsin. Trypsin was then removed and cells were resuspended in FACS buffer (1× PBS and 2% FBS) and sorted with a FACS Caliber machine (Becton Dickinson, Franklin Lakes, NJ). RPE cells that had not been fed with FITC-labeled POS were used as negative controls. Data obtained after cell sorting were analyzed with CellQuest Pro software (Becton Dickinson).
Western Blot Analysis
Cells were lysed in RIPA buffer (Cat# 89900; Pierce) containing a protease inhibitor cocktail (Sigma-Aldrich, St. Louis, MO), and total protein was quantified using a Bio-Rad DC protein assay (Cat# 500-0116). Protein lysates (10–30 μg) were denatured by adding 1× Laemelli + 5% β-ME buffer and then separated on a 4% to 20% Tris-Cl gradient gel. Proteins from the gel were electroblotted onto polyvinylidene difluoride (PVDF)-LICOR membranes and incubated with blocking buffer (Cat# 927-40000; Licor Biosciences, Lincoln, NE) for 45 minutes to 1 hour at room temperature. The membranes were then washed twice in PBS + 0.1% tween for 5 minutes and incubated with primary antibodies directed against the following proteins in blocking buffer overnight at 4°C: RPE65 (mouse monoclonal, 1:5000; Chemicon), BESTROPHIN (mouse monoclonal, 1:500; Chemicon), CRALBP (mouse monoclonal, 1:50,000; gift from John Saari, University of Washington, Seattle, WA), EZRIN (rabbit polyclonal, 1:1000; Cell Signaling Technologies, Danvers, MA), OCCLUDIN (rabbit polyclonal, 1:250; Life Technologies), CLAUDIN-10 (rabbit polyclonal, 1:250; Life Technologies), rhodopsin (mouse monoclonal, 1:500; Millipore), and/or ACTIN (goat polyclonal, 1:750; Santa Cruz Biotechnology). The next day, blots were washed four times in PBS + 0.1% tween and incubated with host-appropriate secondary antibodies (Licor Biosciences) in blocking buffer for 1 hour at room temperature. Blots were again washed four times in PBS + 0.1% tween and protein bands were visualized using an Odyssey Infrared Imager (Licor Biosciences). Of note, in each experiment, individual Western blots were stripped and probed twice with different primary antibodies.
Statistics
Data throughout the manuscript are expressed as mean ± SE and compared using the unpaired Student's t-test. Significance was reported for P values less than 0.05.
Results
Generation, Characterization, and Differentiation of hiPSCs Into RPE
Primary fibroblast cultures were established from skin biopsies of four different individuals and reprogrammed by lentiviral delivery of OCT4, SOX2, c-MYC, and KLF4.5 Two of these individuals carried no known retinal diseases (WT), whereas two had autosomal dominant BVMD caused by N296H or A146K mutations in the BEST1 gene, the effects of which were previously studied in hiPSC-RPE.5 The four undifferentiated hiPSC lines expressed the pluripotency markers OCT4, SSEA4, NANOG, and TRA-1-815 (see Supplementary Figs. S1A–H) and produced teratomas containing derivatives of all three germ layers5 (Supplementary Figs. S1I–T). To differentiate hiPSC to RPE, embryoid bodies were generated as previously described, plated on laminin-coated dishes, and cultured long term in retinal differentiation medium.3,11,15 Patches of RPE cells were observed as early as day 30 to 40 of differentiation; however, to obtain mature and heavily pigmented hiPSC-RPE, we typically waited until day 60 to 90 of differentiation to microdissect monolayers of RPE cells. Microdissected hiPSC-RPE (passage 0; P0) were either dissociated and serially expanded or used immediately in experiments.
hiPSC-RPE Can Be Expanded More Than 1000-Fold by Serial Passaging of Monolayer Cultures
To serially expand hiPSC-RPE cells, microdissected RPE cells (P0) from all four hiPSC lines (WT and BVMD) were seeded onto 6.5-mm transwell inserts or 96-well plates at a density of 20,000 cells per insert or well (Fig. 1A). After seeding, the RPE cells were allowed to proliferate, form monolayers, and re-adopt their typical morphology and pigmentation (passage 1; P1). Thereafter, P1 hiPSC-RPE cells from one transwell insert or one well of a 96-well plate were dissociated, plated onto two wells of a 24-well plate, and allowed to expand and mature to form passage 2 (P2) monolayer cultures. Finally, P2 hiPSC-RPE cells from 1 well of a 24-well plate were dissociated and reseeded onto all 6 wells of a 6-well plate and grown again to maturity (passage 3; or P3). In this manner, hiPSC-RPE cells could be reliably expanded approximately 1000-fold over three passages (Fig. 1B). hiPSC-RPE passaged beyond P3 using this method failed to expand further or adopt mature monolayer structure. Extrapolating these results suggests that complete microdissection of P0 RPE from a typical six-well plate of mixed-differentiated hiPSCs (approximately 1 million RPE cells) would yield approximately 1 billion hiPSC-RPE cells at P3.
Figure 1.

Passaging and expansion of hiPSC-RPE. (A) Schematic showing the protocol used to passage and expand hiPSC-RPE in culture. (B) Quantification of fold increase in the total number of live hiPSC-RPE cells at passages 1, 2, and 3 (P1, P2, P3) relative to passage 0 (P0). (C, D) Normalized fold change in expression of pluripotency/reprogramming (C) and neuroretinal (D) genes in undifferentiated hiPSCs and passaged hiPSC-RPE cultures. *P < 0.05; ***P < 0.0005.
One possible negative effect of RPE passaging is proliferation of undifferentiated hiPSCs that may be present in P0 microdissected cultures. However, expression of pluripotency and reprogramming genes (KLF4, NANOG, OCT4, and SOX2) decreased with passaging of hiPSC-RPE cells (Fig. 1C). To further evaluate the potential for contamination from non-RPE cell types in our passaged cultures, we also examined the expression of genes (VSX2, GFAP, RECOVERIN, BRN3B) (Fig. 1D) and proteins (RCVRN, S100) (Supplementary Fig. S2) found in neuroretinal cells, which frequently develop adjacent to RPE in human pluripotent stem cell cultures.11 Similar to our findings with pluripotent genes, there was a reduction in neuroretinal marker expression with passaging and expansion of hiPSC-RPE. These data show that limited passaging leads to selective expansion of hiPSC-RPE with a concurrent reduction in contamination from undifferentiated hiPSCs or non-RPE cells that may initially be present in P0 cultures.
Passaged hiPSC-RPE Monolayers Display Characteristic Morphology and Pigmentation
hiPSC-RPE cells from all lines and expandable passages (P0–P3) were grown on transwells or nonpermeable plastic supports and evaluated for morphology and pigmentation. Pigmented monolayers of passaged and expanded hiPSC-RPE were indistinguishable from hfRPE monolayer cultures (Figs. 2A–G). At higher magnification, hfRPE, P0 hiPSC-RPE, and serially expanded hiPSC-RPE displayed a characteristic cobblestone appearance with hexagonal morphology (Figs. 2H–J).
Figure 2.
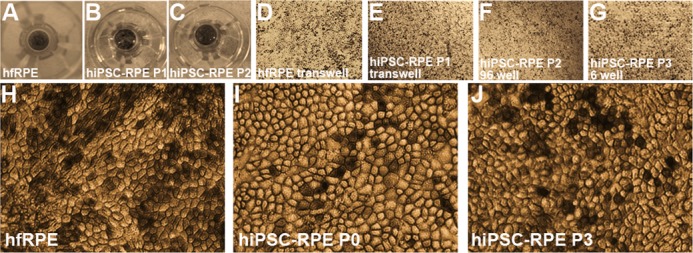
Cellular morphology of passaged and expanded hiPSC-RPE. (A–C) Photographs of hfRPE and passaged hiPSC-RPE (P1 and P2) on transwell inserts. (D–G) Representative light microscopic images of hfRPE and passaged (P1–P3) hiPSC-RPE at days 60 to 90 on permeable and nonpermeable supports. (H–J) High magnification images of hfRPE and P0 and P3 hiPSC-RPE monolayers.
Gene and Protein Expression Profiles Are Similar Between RPE Monolayers Derived From Multiple hiPSC Lines and Are Unaffected by Limited Serial Passaging and Expansion
To determine if passaging and expansion of hiPSC-RPE affects the expression of characteristic RPE markers, we evaluated the expression of selected RPE genes and proteins in the four hiPSC lines at P0 to P3. All RPE genes tested (BEST1, RPE65, MITF, OCCLUDIN, and PEDF) were expressed in hfRPE as well as P0 hiPSC-RPE and passaged hiPSC-RPE (Fig. 3A). Quantitative PCR analysis revealed insignificant variability in the gene expression levels of selected RPE markers (BEST1, RPE65, MERTK, MITF, OCCLUDIN, and PEDF) between lines and passages (Figs. 3B, 3C). Furthermore, Western blot experiments confirmed similar levels of expression of selected RPE proteins (RPE65, OCCLUDIN, BEST1, EZRIN, and CLAUDIN-10) in hfRPE and all four lines of hiPSC-RPE at P0 to P3 (Fig. 3D). Altogether, these data demonstrate that serially expanded RPE derived from different hiPSC lines and passages (up to P3) exhibit comparable expression of signature RPE genes and proteins.
Figure 3.

Expression of RPE genes and proteins in passaged hiPSC-RPE. (A) RT-PCR analysis of characteristic RPE genes in hfRPE and passaged hiPSC-RPE (P0–P3) from four different lines. (B) Relative expression of RPE genes in hiPSC-RPE monolayers obtained from four different lines (data from all passages were pooled for each line). (C) Relative expression of RPE genes in hiPSC-RPE monolayers obtained from three different passages (P1–P3) (data from all four hiPSC lines were pooled for each passage). (D) Western blot analysis showing protein expression of RPE markers in hfRPE and passaged hiPSC-RPE (P0–P3).
Passaged hiPSC-RPE Monolayers Form Functional Tight Junctions and Display Proper Polarization
Pigmented RPE monolayers grown on transwell inserts were used to evaluate epithelial integrity and cell polarization. Immunocytochemistry analysis of hfRPE and passaged hiPSC-RPE (up to P3) from all four lines showed appropriate expression of the tight junction protein, ZO-1 (representative images in Figs. 4A–C). Consistent with this finding, TER measurements obtained from P1 to P3 hiPSC-RPE cultures (P1: 355.9 ± 48.9 Ω*cm2, P2: 451.7 ± 16.0 Ω*cm2, P3: 394.6 ± 16.0 Ω*cm2) were similar to or better than those of human hfRPE (359.5 ± 15.0 Ω*cm2) (Fig. 4D), and significantly above the TER of 150 Ω*cm2 found in vivo.17 Polarization of passaged hiPSC-RPE cells at P1 and P3 was also similar to hfRPE, with BEST1 found predominantly near the basolateral membrane and EZRIN at the apical membrane in all cultures (Figs. 4E–G).
Figure 4.

Epithelial integrity and polarity in passaged hiPSC-RPE. (A–C) Confocal images showing the expression and localization of the tight junction protein ZO-1 in hfRPE and passaged hiPSC-RPE (P1, P3). (D) Quantification of TER in hfRPE and passaged (P1–P3) hiPSC-RPE monolayers (dotted green line demarcates proposed functional TER threshold in vivo). (E–G) Localization of EZRIN (red) and BEST1 (green) by confocal microscopy in hfRPE and passaged hiPSC-RPE (P1, P3) (blue: nuclei). Scale bar: 10 μm; *P < 0.05; ***P < 0.005.
Polarized Release of PEDF, ATP, and VEGF-A in Passaged hiPSC-RPE Monolayer Cultures
To determine if hiPSC-RPE cells are capable of polarized secretion of known biological factors, levels of pigment epithelium–derived factor (PEDF), adenosine triphosphate (ATP), and VEGF-A were measured in the apical and basal extracellular media of pigmented RPE monolayers grown on transwell inserts. Because it was unknown whether the BEST1 mutations in the BVMD hiPSC lines could affect factor secretion, only data from WT hiPSC lines were pooled for these experiments. Consistent with previous findings in polarized human RPE cells, PEDF and ATP were mainly secreted into the apical media compartment of passaged hiPSC-RPE and hfRPE monolayers grown for equal times in culture (Figs. 5A, 5B).18–21 In contrast, VEGF-A was predominantly secreted into the basal media compartment (Fig. 5C). These results, together with those from the TER and immunocytochemistry experiments, show that limited serial passaging and expansion does not alter the capacity of hiPSC-RPE to form functional, polarized monolayers.
Figure 5.

Polarized factor secretion and G protein–coupled receptor-stimulated calcium responses in passaged hiPSC-RPE. Total amount of (A) PEDF, (B) ATP, and (C) VEGF-A in the apical and basal extracellular media of monolayers of hfRPE and passaged hiPSC-RPE (P1, P2) grown on transwell inserts. (D) Representative traces showing changes in [Ca2+]i in hfRPE and passaged hiPSC-RPE (P1, P2) cultures after stimulation with 100 μM ATP. (E) Baseline [Ca2+]i levels in hfRPE and passaged hiPSC-RPE (P1, P2). *P < 0.05; **P < 0.005; ***P < 0.0005.
Passaged and Expanded hiPSC-RPE Monolayer Cultures Display Characteristic Calcium Responses to ATP Stimulation
Precise regulation of calcium signaling is essential for numerous RPE cell functions, including proliferation,22 fluid and ion homeostasis,23 biomolecule secretion,24 and phagocytosis,25,26 among many others.23 Human RPE cells typically display a resting [Ca2+]i of approximately 100 nM.23,27 However, exposure to extracellular ATP produces a large transient [Ca2+]i increase in RPE cells due to release of calcium from endoplasmic reticulum stores.28 Fura-2–based ratiometric calcium imaging showed characteristic [Ca2+]i transients after ATP stimulation in WT hiPSC-RPE at all tested passages, indistinguishable from hfRPE (Fig. 5D). In addition, similar baseline [Ca2+]i levels were observed in passaged WT hiPSC-RPE and hfRPE (hiPSC-RPE P1:106.02 ± 22.9 nM; hiPSC-RPE P2: 98.46 ± 19.6 nM; hfRPE: 98.34 ± 17.4 nM) (Fig. 5E).
Passaged and Expanded hiPSC-RPE Monolayer Cultures Retain Their Ability to Phagocytose and Degrade Photoreceptor Outer Segments (POSs)
Phagocytosis and degradation of POS were evaluated in hfRPE and passaged WT hiPSC-RPE monolayers (all possessing TER >250 Ω*cm2) after feeding the cells for 2 hours with either FITC-labeled or unlabeled POS (20 POS/RPE cell) (Figs. 6A, 6B). BVMD hiPSC lines were not included in these assays given the known effect of BEST1 mutations on POS processing in hiPSC-RPE.5 The uptake of FITC-POS immediately after feeding was significantly higher in passaged hiPSC-RPE compared with hfRPE (Fig. 6A'). Furthermore, passaged hiPSC-RPE degraded ingested POS faster than hfRPE, as measured by FITC-fluorescence levels 24 hours after feeding (Fig. 6A'). Consistent with these results, Western blot analyses revealed greater uptake and faster degradation of rhodopsin in passaged hiPSC-RPE relative to hfRPE (Fig. 6B').5
Figure 6.

Phagocytosis and degradation of POS by hfRPE and passaged hiPSC-RPE. (A) Schematic depicting the protocol used to compare the uptake and degradation of POS in hfRPE and passaged hiPSC-RPE after 2 hours of feeding with FITC-POS. (B) Schematic showing the protocol used to monitor the degradation of rhodopsin in hfRPE and passaged hiPSC-RPE after 2 hours of feeding with unlabeled POS. (A') Quantification of FITC-fluorescence levels in hfRPE and passaged hiPSC-RPE cultures (P1, P2) at 0 and 24 hours after feeding 20 FITC-labeled POS/RPE cell. (B') Western blot analysis showing the amount of rhodopsin present in hfRPE and passaged hiPSC-RPE (P2) at 0, 4, 24, and 48 hours after unlabeled POS feeding (20 POS/RPE cell). **P < 0.005; ***P < 0.0005.
Passaging hiPSC-RPE Monolayer Cultures Beyond Senescence Results in a Significant Loss in RPE-like Characteristics
Previous studies have shown that continuous passaging of primary RPE cells leads to a transition from an epithelial to a mesenchymal phenotype.29,30 Consistent with these observations, dissociation and replating of P3 hiPSC-RPE cells from mature monolayer cultures caused a significant shift in cell morphology, becoming more fibroblast-like in appearance (Fig. 7A). Furthermore, when seeded at the same density as P1 to P3 cultures, P4 hiPSC-RPE cells failed to proliferate and re-form monolayers (Fig. 7A). As expected, the nonconfluent P4 cultures displayed a TER of 28.4 ± 2.17 Ω*cm2, significantly lower than the 150 Ω*cm2 TER found in vivo.17 In experiments performed with P1 and P4 RPE derived from the same hiPSC line, plated on the same day, and grown in parallel, we observed a significant decrease in the expression of key RPE-marker genes at P4 (Fig. 7B). In contrast, the gene expression of the mesenchymal markers FN-1 and ACTA2, as well as the epithelial marker KRT18, were significantly increased in P4 hiPSC-RPE (Fig. 7C). cDNA obtained from human fibroblast cultures was used as a positive control for the mesenchymal markers used in these experiments (Fig. 7C). Of note, RPE, but not fibroblasts, typically expresses KRT18.31–33 Immunohistochemical analysis showed expression of both KRT18 and ACTA2 in P4 hiPSC-RPE, whereas KRT18 was only rarely found to be expressed in P4 hiPSC-RPE (Fig. 7D). From a functional standpoint, P4 WT hiPSC-RPE cells were capable of phagocytosing POS; however, they were unable to degrade rhodopsin within 24 hours after POS feeding (Fig. 7E). Together, these results demonstrate that hiPSC-RPE cells passaged beyond senescence (equivalent to P4 in our system) lose morphological and functional characteristics of mature RPE.
Figure 7.

Comparison of morphological, gene expression, and functional characteristics of hiPSC-RPE at passage 1 and passage 4. (A) Representative low- (×4) and high- (×10) magnification light microscopic images of day 40 P1 and P4 hiPSC-RPE grown on transwell inserts. (B) Relative expression of selected RPE genes in P1 and P4 hiPSC-RPE at day 40. (C) Relative gene expression of mesenchymal (FN1, ACTA2) and epithelial (KRT18) markers in human fibroblasts and P1 and P4 hiPSC-RPE cells. (D) Confocal images showing expression and localization of ACTA2 and KRT18 in P1 and P4 hiPSC-RPE cells. (E) Western blot analysis showing the amount of rhodopsin monomer (lower band) and dimer (upper band) present in P1 and P4 hiPSC-RPE at 0 and 24 hours after unlabeled POS feeding. Scale bar: ×4 images = 250 μm; ×10 images = 50 μm. *P < 0.05; ***P < 0.0005.
Discussion
hiPSC-derived RPE holds tremendous potential as a tool for disease modeling, drug screening, and cell-based transplantation therapy in selected human retinal degenerative diseases. However, full realization of this potential requires production of large, pure populations of hiPSC-RPE that display reproducible characteristics and functions. In this study, we used four hiPSC lines, two of which were derived from individuals having no known retinal diseases, whereas two had BVMD caused by mutations in the BEST1 gene. However, inclusion of the BVMD lines was limited to experiments previously shown to be unaffected by the BEST1 mutations.5 With these lines, we demonstrated that hiPSC-RPE could be expanded more than 1000-fold to theoretically yield approximately 1 billion RPE cells from a single six-well plate of hiPSCs. Importantly, we found that the cellular morphology, pigmentation, RPE gene and protein expression levels, polarity, and VEGF-A, ATP, and PEDF secretory capacity were indistinguishable between the subject-specific hiPSC-RPE cultures and hfRPE.9,10,13,14 In addition, WT hiPSC-RPE and hfRPE had comparable baseline intracellular calcium levels and responded similarly to exogenous ATP administration by transiently increasing intracellular calcium levels. hiPSC-RPE monolayers were also capable of forming functional tight junctions with TER on par with or better than hfRPE monolayers.20,34 One functional parameter that consistently differed between hiPSC-RPE and hfRPE was their ability to phagocytose and degrade POS. In these experiments, hiPSC-RPE phagocytosed higher amounts of POS compared with hfRPE and degraded ingested POS faster. Although it is unclear why these differences exist, the former finding has been observed previously.35 One possible explanation is that hiPSC-RPE reaches a more mature state in culture than hfRPE, and thus can carry out certain functions more efficiently.
Achieving a high level of hiPSC-RPE expansion requires repeated dissociation and passaging, a process that runs the risk of selecting for non-RPE cell types, including partially or fully undifferentiated stem cells that could be present in the initial microdissected (P0) material. Contamination from undifferentiated hiPSCs is of particular concern, as these cells can, by definition, proliferate and form teratomas in host tissue. We found that limited passaging supported the selective expansion of hiPSC-RPE cells along with a decrease in the expression of markers of neuroretinal progenitors, differentiated neuroretinal cell types, and undifferentiated hiPSCs. The presence of neuroretinal cells was chosen as an indicator of contamination in our study because they are often located in close proximity to RPE in adherent cultures of differentiating hESCs and hiPSCs.11 We also found that serial expansion of hiPSC-RPE up to P3 did not deleteriously affect their cytological features or biochemical functions, but rather resulted in stable or improved RPE culture properties.
A previous study revealed that passaging of hiPSC-RPE can result in telomere shortening and rapid senescence.13 Furthermore, in primary RPE, epithelial to mesenchymal transitions have been observed in continuously passaged cultures,29,30 with spindle-shaped cells appearing after limited passaging.36 Consistent with these reports, we saw that hiPSC-RPE at P4 failed to proliferate and form monolayers. Instead, dissociated cells collected from P3 cultures adopted a fibroblast-like appearance after replating, and displayed decreased expression of RPE-specific markers and enhanced expression of mesenchymal markers. These findings show that, although limited passaging can increase the quantity and purity of hiPSC-RPE cells, attempting to passage cultures beyond senescence can greatly alter cellular characteristics. Knowledge of this passage ceiling is important when preparing cultures for transplantation or in vitro study. For example, when using the method presented in this report, the use of dissociated hiPSC-RPE cells from P3 cultures should be avoided. However, there is likely no specific RPE passage number that is universally ideal for all culture systems, as protocols and criteria used to grow and passage RPE vary widely. Instead, the optimal passage and expansion range for experimental and therapeutic applications should be determined for each culture method.
It is important to note that our protocol for expanding hiPSC-RPE has potential strengths as well as weaknesses. We required all hiPSC-RPE cultures to mature and form pigmented monolayers at each passage before dissociation and replating, as opposed to maintaining them in a continuously proliferative state. This approach requires longer culture times and may lead to early senescence, thus restricting the maximum yield of hiPSC-RPE cells. However, it allowed us to establish defined checkpoints during expansion for culture evaluation and comparison. Also, from a safety standpoint, passaging hiPSC-RPE using this method permitted assessment of culture quality and purity at every step along the expansion process.
Interestingly, results obtained from RPE cultures derived from multiple different hiPSC lines were highly similar at every passage. This observation is particularly noteworthy given that integrating viruses were used to reprogram the parent fibroblasts, an approach that can engender greater variability in cellular properties between hiPSC lines.8,37,38 It may be that such variability is minimized by initially isolating hiPSC-RPE patches at a mature stage of development and subjecting them to the rigorous passaging protocol described herein.
Taken together, our findings underscore the potential for patient-specific hiPSCs to provide a consistent supply of RPE with reproducible characteristics. Furthermore, we establish limited serial expansion as a means to improve the purity of hiPSC-RPE cultures for use in the study and treatment of retinal diseases.
Supplementary Material
Acknowledgments
We thank the patients and their families for donating fibroblasts cells.
Supported by the Macula Vision Research Foundation, the Foundation Fighting Blindness Wynn-Gund Translational Research Award, National Institutes of Health Grant P30 HD03352, the Lincy Foundation, the Muskingum County Community Foundation, the Retina Research Foundation (Kathryn and Latimer Murfee and Emmett A. Humble Chairs), and the McPherson Eye Research Institute (Sandra Lemke Trout Chair in Eye Research).
Disclosure: R. Singh, None; M.J. Phillips, None; D. Kuai, None; J. Meyer, None; J.M. Martin, None; M.A. Smith, None; E.T. Perez, None; W. Shen, None; K.A. Wallace, None; E.E. Capowski, None; L.S. Wright, None; D.M. Gamm, None
References
- 1. Lim LS, Mitchell P, Seddon JM, Holz FG, Wong TY. Age-related macular degeneration. Lancet. 2012; 379: 1728–1738 [DOI] [PubMed] [Google Scholar]
- 2. Strauss O. The retinal pigment epithelium in visual function. Physiol Rev. 2005; 85: 845–881 [DOI] [PubMed] [Google Scholar]
- 3. Meyer JS, Howden SE, Wallace KA, et al. Optic vesicle-like structures derived from human pluripotent stem cells facilitate a customized approach to retinal disease treatment. Stem Cells. 2011; 29: 1206–1218 [DOI] [PMC free article] [PubMed] [Google Scholar]
- 4. Howden SE, Gore A, Li Z, et al. Genetic correction and analysis of induced pluripotent stem cells from a patient with gyrate atrophy. Proc Natl Acad Sci U S A. 2011; 108: 6537–6542 [DOI] [PMC free article] [PubMed] [Google Scholar]
- 5. Singh R, Shen W, Kuai D, et al. iPS cell modeling of Best disease: insights into the pathophysiology of an inherited macular degeneration. Hum Mol Genet. 2012; 22: 593–607 [DOI] [PMC free article] [PubMed] [Google Scholar]
- 6. Du H, Lim SL, Grob S, Zhang K. Induced pluripotent stem cell therapies for geographic atrophy of age-related macular degeneration. Semin Ophthalmol. 2011; 26: 216–224 [DOI] [PMC free article] [PubMed] [Google Scholar]
- 7. Ukrohne TU, Westenskow PD, Kurihara T, et al. Generation of retinal pigment epithelial cells from small molecules and OCT4 reprogrammed human induced pluripotent stem cells. Stem Cells Transl Med. 2012; 1: 96–109 [DOI] [PMC free article] [PubMed] [Google Scholar]
- 8. Hirami Y, Osakada F, Takahashi K, et al. Generation of retinal cells from mouse and human induced pluripotent stem cells. Neurosci Lett. 2009; 458: 126–131 [DOI] [PubMed] [Google Scholar]
- 9. Buchholz DE, Hikita ST, Rowland TJ, et al. Derivation of functional retinal pigmented epithelium from induced pluripotent stem cells. Stem Cells. 2009; 27: 2427–2434 [DOI] [PubMed] [Google Scholar]
- 10. Rowland TJ, Buchholz DE, Clegg DO. Pluripotent human stem cells for the treatment of retinal disease. J Cell Physiol. 2012; 227: 457–466 [DOI] [PubMed] [Google Scholar]
- 11. Meyer JS, Shearer RL, Capowski EE, et al. Modeling early retinal development with human embryonic and induced pluripotent stem cells. Proc Natl Acad Sci U S A. 2009; 106: 16698–16703 [DOI] [PMC free article] [PubMed] [Google Scholar]
- 12. Bharti K, Miller SS, Arnheiter H. The new paradigm: retinal pigment epithelium cells generated from embryonic or induced pluripotent stem cells. Pigment Cell Melanoma Res. 2011; 24: 21–34 [DOI] [PMC free article] [PubMed] [Google Scholar]
- 13. Kokkinaki M, Sahibzada N, Golestaneh N. Human induced pluripotent stem-derived retinal pigment epithelium (RPE) cells exhibit ion transport, membrane potential, polarized vascular endothelial growth factor secretion, and gene expression pattern similar to native RPE. Stem Cells. 2011; 29: 825–835 [DOI] [PMC free article] [PubMed] [Google Scholar]
- 14. Carr AJ, Vugler AA, Hikita ST, et al. Protective effects of human iPS-derived retinal pigment epithelium cell transplantation in the retinal dystrophic rat. PLoS One. 2009; 4: e8152 [DOI] [PMC free article] [PubMed] [Google Scholar]
- 15. Phillips MJ, Wallace KA, Dickerson SJ, et al. Blood-derived human iPS cells generate optic vesicle-like structures with the capacity to form retinal laminae and develop synapses. Invest Ophthalmol Vis Sci. 2012; 53: 2007–2019 [DOI] [PMC free article] [PubMed] [Google Scholar]
- 16. Gamm DM, Melvan JN, Shearer RL, et al. A novel serum-free method for culturing human prenatal retinal pigment epithelial cells. Invest Ophthalmol Vis Sci. 2008; 49: 788–799 [DOI] [PubMed] [Google Scholar]
- 17. Sonoda S, Spee C, Barron E, Ryan SJ, Kannan R, Hinton DR. A protocol for the culture and differentiation of highly polarized human retinal pigment epithelial cells. Nat Protoc. 2009; 4: 662–673 [DOI] [PMC free article] [PubMed] [Google Scholar]
- 18. Mitchell CH. Release of ATP by a human retinal pigment epithelial cell line: potential for autocrine stimulation through subretinal space. J Physiol. 2001; 534: 193–202 [DOI] [PMC free article] [PubMed] [Google Scholar]
- 19. Blaauwgeers HG, Holtkamp GM, Rutten H, et al. Polarized vascular endothelial growth factor secretion by human retinal pigment epithelium and localization of vascular endothelial growth factor receptors on the inner choriocapillaris. Evidence for a trophic paracrine relation. Am J Pathol. 1999; 155: 421–428 [DOI] [PMC free article] [PubMed] [Google Scholar]
- 20. Maminishkis A, Chen S, Jalickee S, et al. Confluent monolayers of cultured human fetal retinal pigment epithelium exhibit morphology and physiology of native tissue. Invest Ophthalmol Vis Sci. 2006; 47: 3612–3624 [DOI] [PMC free article] [PubMed] [Google Scholar]
- 21. Vaajasaari H, Ilmarinen T, Juuti-Uusitalo K, et al. Toward the defined and xeno-free differentiation of functional human pluripotent stem cell-derived retinal pigment epithelial cells. Mol Vis. 2011; 17: 558–575 [PMC free article] [PubMed] [Google Scholar]
- 22. Smith-Thomas L, Haycock JW, Metcalfe R, et al. Involvement of calcium in retinal pigment epithelial cell proliferation and pigmentation. Curr Eye Res. 1998; 17: 813–822 [PubMed] [Google Scholar]
- 23. Wimmers S, Karl MO, Strauss O. Ion channels in the RPE. Prog Retin Eye Res. 2007; 26: 263–301 [DOI] [PubMed] [Google Scholar]
- 24. Rosenthal R, Heimann H, Agostini H, Martin G, Hansen LL, Strauss O. Ca2+ channels in retinal pigment epithelial cells regulate vascular endothelial growth factor secretion rates in health and disease. Mol Vis. 2007; 13: 443–456 [PMC free article] [PubMed] [Google Scholar]
- 25. Karl MO, Kroeger W, Wimmers S, et al. Endogenous Gas6 and Ca2+-channel activation modulate phagocytosis by retinal pigment epithelium. Cell Signal. 2008; 20: 1159–1168 [DOI] [PubMed] [Google Scholar]
- 26. Hall MO, Abrams TA, Mittag TW. ROS ingestion by RPE cells is turned off by increased protein kinase C activity and by increased calcium. Exp Eye Res. 1991; 52: 591–598 [DOI] [PubMed] [Google Scholar]
- 27. Feldman EL, Randolph AE. Peptides stimulate phosphoinositide hydrolysis in human retinal pigment epithelium. Invest Ophthalmol Vis Sci. 1993; 34: 431–437 [PubMed] [Google Scholar]
- 28. Peterson WM, Meggyesy C, Yu K, Miller SS. Extracellular ATP activates calcium signaling, ion, and fluid transport in retinal pigment epithelium. J Neurosci. 1997; 17: 2324–2337 [DOI] [PMC free article] [PubMed] [Google Scholar]
- 29. Grisanti S, Guidry C. Transdifferentiation of retinal pigment epithelial cells from epithelial to mesenchymal phenotype. Invest Ophthalmol Vis Sci. 1995; 36: 391–405 [PubMed] [Google Scholar]
- 30. Lee SC, Kwon OW, Seong GJ, Kim SH, Ahn JE, Kay ED. Epitheliomesenchymal transdifferentiation of cultured RPE cells. Ophthalmic Res. 2001; 33: 80–86 [DOI] [PubMed] [Google Scholar]
- 31. Shi JW, Liu W, Zhang TT, et al. The enforced expression of c-Myc in pig fibroblasts triggers mesenchymal-epithelial transition (MET) via F-actin reorganization and RhoA/Rock pathway inactivation. Cell Cycle. 2013; 12: 1119–1127 [DOI] [PMC free article] [PubMed] [Google Scholar]
- 32. Fuchs U, Kivela T, Tarkkanen A. Cytoskeleton in normal and reactive human retinal pigment epithelial cells. Invest Ophthalmol Vis Sci. 1991; 32: 3178–3186 [PubMed] [Google Scholar]
- 33. Grossniklaus HE, Ling JX, Wallace TM, et al. Macrophage and retinal pigment epithelium expression of angiogenic cytokines in choroidal neovascularization. Mol Vis. 2002; 8: 119–126 [PubMed] [Google Scholar]
- 34. Sonoda S, Sreekumar PG, Kase S, et al. Attainment of polarity promotes growth factor secretion by retinal pigment epithelial cells: relevance to age-related macular degeneration. Aging (Albany NY). 2009; 2: 28–42 [DOI] [PMC free article] [PubMed] [Google Scholar]
- 35. Westenskow PD, Moreno SK, Krohne TU, et al. Using flow cytometry to compare the dynamics of photoreceptor outer segment phagocytosis in iPS-derived RPE cells. Invest Ophthalmol Vis Sci. 2012; 53: 6282–6290 [DOI] [PMC free article] [PubMed] [Google Scholar]
- 36. Tezel TH, Del Priore LV. Serum-free media for culturing and serial-passaging of adult human retinal pigment epithelium. Exp Eye Res. 1998; 66: 807–815 [DOI] [PubMed] [Google Scholar]
- 37. Yamanaka S. A fresh look at iPS cells. Cell. 2009; 137: 13–17 [DOI] [PubMed] [Google Scholar]
- 38. Toivonen S, Ojala M, Hyysalo A, et al. Comparative analysis of targeted differentiation of human induced pluripotent stem cells (hiPSCs) and human embryonic stem cells reveals variability associated with incomplete transgene silencing in retrovirally derived hiPSC lines. Stem Cells Transl Med. 2013; 2: 83–93 [DOI] [PMC free article] [PubMed] [Google Scholar]
Associated Data
This section collects any data citations, data availability statements, or supplementary materials included in this article.