

Abstract
Purpose.
Levels of TGF-β2 are higher in POAG aqueous humor, causing deposition of extracellular matrix (ECM) proteins, including fibronectin (FN), in the glaucomatous human trabecular meshwork (HTM) that may be responsible for elevated IOP. The purpose of this study was to identify the expression of cellular FN (cFN) isoforms (EDA and EDB) in HTM cells and tissues, and to determine whether TGF-β2 can induce cFN expression and fibril formation in cultured HTM cells.
Methods.
Expression of cFN mRNA isoforms and induction by recombinant TGF-β2 (5 ng/mL) were determined by quantitative RT-PCR. The TGF-β2 induction of EDA isoform protein expression and FN fibril formation were analyzed using Western immunoblots and immunocytochemistry (ICC), respectively. Immunohistochemistry (IHC) analysis was used to examine total FN and EDA isoform expression in normal (NTM) and glaucomatous (GTM) trabecular meshwork (TM) tissues.
Results.
Both cFN mRNA isoforms were expressed in cultured HTM cells and were induced by TGF-β2 after 2, 4, and 7 days (P < 0.05). Similarly, EDA isoform protein and fibril formation were increased after 4 and 7 days of TGF-β2 treatment. Finally, GTM tissues had significantly greater EDA isoform protein levels (1.7-fold, P < 0.05) compared to NTM tissues.
Conclusions.
This study demonstrated that cFN isoforms are expressed and induced in HTM cells by TGF-β2. Also, increased EDA isoform protein levels were seen in GTM tissues. Our findings suggest that induction of cFN isoform expression in the TM ECM may be a novel pathologic mechanism involved in the TM changes associated with glaucoma.
Keywords: glaucoma, trabecular meshwork, TGF-β2, fibronectin
We demonstrate that cellular fibronectin is expressed in human normal and glaucomatous trabecular meshwork cells and tissues, and that EDA isoform levels are elevated in glaucomatous tissue. We also show that TBF-β2 induces cellular fibronectin expression in human trabecular meshwork cells.
Introduction
Glaucoma is a multifactorial optic neuropathy, and one of the leading causes of irreversible visual impairment and blindness, affecting over 70 million people worldwide.1–3 POAG is the most common type of glaucoma in the western world, and major risk factors include age, race, and chronically elevated IOP.4–6 Normal IOP is maintained primarily by the regulation of aqueous humor (AH) outflow through the trabecular meshwork (TM), which is controlled by TM cell and extracellular matrix (ECM) interactions.7–9 Therefore, it is important to identify changes in glaucomatous TM cells that may lead to an increased AH outflow resistance and elevated IOP.
Studies on normal (NTM) and glaucomatous (GTM) TM cells and tissues have identified many tissue modifications involved in the generation of abnormal AH outflow and elevated IOP. Some of the GTM cell–related modifications include changes in cytoskeletal organization, increased tissue stiffness, increased expression and deposition of ECM proteins, as well as elevated levels of specific cytokines and growth factors.2,10–15 However, increased TM ECM protein expression and deposition induced by growth factors have been suggested to be critical in affecting the TM tissue microenvironment and TM cell functions. TGF-β2 is an important growth factor involved in glaucoma pathology, as increased levels have been reported in POAG AH and TM tissues.15–17 Ex vivo and in vivo studies have shown that TGF-β2 elevates AH outflow resistance and IOP.18–20 In addition, TGF-β2 increases the expression and deposition of ECM proteins, such as collagen and fibronectin (FN) in TM cells and tissues.15,21
The protein FN is a multifunctional ECM glycoprotein that also is elevated in GTM tissues and AH.7,21,22 In many biological processes, FN provides structural support and signaling cues by directing ECM–ECM and ECM–cell interactions, as well as regulating protein activity of growth factors and proteins involved in ECM remodeling. It is a multi-domain protein dimer composed of combinations of three types of domains (type I, II, and III) that provide binding sites to itself, other ECM proteins, enzymes, growth factors, and cellular receptors. More than 20 alternatively spliced isoforms can be generated by splicing one or more of the following exon domains: extra domain A (EDA), extra domain B (EDB), and type III connecting segment domain (IIICS or V region).23–25
The FN isoforms can be found as two major forms: plasma FN (pFN) and cellular FN (cFN). pFN is a secreted globular and soluble form that can interact with cellular receptors, such as integrins and other FN molecules, to form fibril networks that alter ECM-cell interactions. cFN is a stretched and insoluble isoform that is secreted and assembled into dense complex fibril networks, affecting overall ECM-cell interactions as well as ECM homeostasis. The stretching of the FN molecule allows increased cellular connections and fibril network formation. The pFN and cFN isoforms can contain the IIICS domain; however, EDA and EDB domains are found exclusively in cFN isoforms.25–28
The expression of pFN and cFN isoforms in some tissues can be induced by TGF-β2.25,29,30 For example, induction of cFN isoforms by TGF-β2 was required for lung24,30,31 and kidney fibrosis,32,33 and myofibroblast differentiation.24,34,35 In addition, in porcine TM cells, TGF-β2 induces total FN, and EDA and EDB cFN isoforms.36 Similarly, we have shown that TGF-β2 induces total FN expression in human NTM and GTM cells21; however, expression and TGF-β2 induction of specific cFN isoforms in human TM (HTM) cells has not been reported previously. The induction of cFN isoforms by TGF-β2 may have a fundamental role in glaucoma pathogenesis. Therefore, the purpose of our study was to identify cFN isoform expression in human NTM and GTM cells and tissues, and determine whether TGF-β2 induces cFN isoform expression and fibril formation in cultured HTM cells.
Methods
HTM Cell Culture
Primary HTM cells were isolated from human donor eyes and characterized as described previously.21,37 All donor tissues were obtained and managed according to the guidelines of the Declaration of Helsinki for research involving human tissue. Primary HTM cell cultures from seven donors, four GTM and three NTM, were studied. The HTM cell cultures were maintained in Dulbecco's modified Eagle's medium (DMEM; Invitrogen-Gibco Life Technologies, Grand Island, NY) containing 10% fetal bovine serum (FBS; Atlas Biologicals Products, Fort Collins, CO), and supplemented with penicillin (100 units/mL), streptomycin (0.1 mg/mL), and L-glutamine (0.292 mg/mL; Invitrogen-Gibco Life Technologies). The HTM cells were cultivated to 100% confluence on 24-well plates for RNA and protein analysis, and on glass coverslips (12 mm) for immunocytochemistry (ICC) analysis.
The TGF-β2 experiments were performed by treating cultured HTM cells with or without recombinant human bioactive TGF-β2 (5 ng/mL; R&D Systems, Inc., Minneapolis, MN) in DMEM containing 0.5% FBS. Samples were collected after 0.5, 2, 4, and 7 days of treatment. Medium with or without TGF-β2 was changed every 2 days, except for cells grown ≤2 days.
Quantitative Real-Time PCR (qRT-PCR) Analysis
Total RNA was extracted from cultured HTM cells treated with or without TGF-β2 (5 ng/mL) for 0.5, 2, 4, and 7 days (TRI Reagent RT extraction, n = 7; MRC, Inc., Cincinnati, OH), and 1 μg RNA was subjected to first-strand cDNA synthesis (High-Capacity cDNA-RT kit; AB Biosystems, Carlsbad, CA). Duplicates of EVA Green/ROX reactions per sample were analyzed by real-time PCR using a Mx3000P Real-Time System (Stratagene, Inc., La Jolla, CA). Briefly, cDNA (25 ng) from each sample was mixed with JumpStart Taq (0.04 U/mL; Sigma-Aldrich, St. Louis, MO), dNTP mix (200 nM), MgCl2 (1.25 mM), dimethyl sulfoxide (DMSO, 1/20), betaine, Eva Green dye (1/20; Biotium, Inc., Hayward, CA), ROX passive reference dye (30 nM; USB Corporation, Cleveland, OH), and 400 nM of each forward and reverse primer set. Primers used to evaluate the expression of the EDA isoform, EDB isoform, all FN isoforms, and the housekeeping gene β-actin are described in the Table.
Table.
Primers Used for qRT-PCR Studies
|
Target Genes |
Primer Sets, 5′–3′ |
Product Size, bp |
| EDA isoform | Forward AGGACTGGCATTCACTGATGTG | 87 |
| Reverse GTCACCCTGTACCTGGAAACTTG | ||
| EDB isoform | Forward GGTGGACCCCGCTAAACTC | 67 |
| Reverse ACCTTCTCCTGCCGCAACTA | ||
| FN isoforms | Forward AGCGGACCTACCTAGGCAAT | 221 |
| Reverse GGTTTGCGATGGTACAGCTT | ||
| β-actin | Forward GTCCACCTTCCAGCAGATGT | 165 |
| Reverse AAAGCCATGCCAATCTCATC |
The PCR program consisted of an initial cycle of 95°C for 60 seconds; 40 cycles of 95°C for 60 seconds, 60°C for 45 seconds, and 72°C for 45 seconds; with a final dissociation curve step. As expected, each primer set generated a single-peak dissociation curve. Therefore, real-time PCR cycle threshold (Ct) values were calculated using MxPro ver. 4.0 software (Stratagene, Inc.). To determine expression changes for EDA, EDB, and total FN isoforms after TGF-β2 treatment, Ct values from treated and untreated groups were analyzed using the ΔΔCt method with β-actin as the normalizing internal control.
Western Blots Analysis
Whole cell lysates (WCL, cellular proteins) and conditioned medium (CM, secreted proteins) were collected from cultured HTM cell strains (n = 6) treated with or without TGF-β2 (5 ng/mL) for 4 and 7 days. After treatment, cell lysate samples were extracted using lysis buffer (M-PER + EDTA; Thermo Fisher Scientific, Inc., Rockford, IL) and protease inhibitor cocktail (Pierce Biotechnology, Inc., Rockford, IL). One mL of CM samples also was collected. Bio-Rad Dc protein Lowry assay kit (Bio-Rad Laboratories, Hercules, CA) was used to estimate cell lysate protein concentrations. Laemmli Buffer (1:6; Boston Bioproducts, Worcester, MA) was added to 30 μg cell lysate and 30 μL CM, and samples were boiled for 5 minutes followed by separation using 10% SDS-PAGE. To verify equal loading for CM samples, gels were stained with Gel Code Blue Stain Reagent (Thermo Fisher Scientific, Inc.; data not shown). Proteins from electrophoresed gels were transferred to PVDF membranes (Millipore, Bedford, MA) and membranes were blocked to prevent nonspecific binding with 5% milk in Tris-buffered saline tween-20 buffer (TBST). Membranes were immunolabeled overnight at 4°C with primary antibodies diluted in SuperBlock (Thermo Fisher Scientific, Inc.): rabbit-anti-FN (1:1000, ab1945; Chemicon, Temecula, CA), mouse-anti-EDA domain (1:500, clone IST-9, ab6328; Abcam, Cambridge, MA), and mouse-anti-β actin (1:5000, clone C4; Millipore). The rabbit-anti-FN antibody recognizes epitopes on the N-terminus of FN, which are expressed by all FN isoforms. Unfortunately, no commercially available antibody was available for the EDB isoform. Blots were incubated for 1 hour with corresponding secondary antibodies diluted in TBST: goat-anti-rabbit or goat-anti-mouse-horseradish peroxidase conjugated antibodies (1:10,000; Pierce Biotechnology, Inc.). Immunolabeled signals were developed using Super Signal West Dura ECL Chemiluminescence Detection kits (Pierce Biotechnology, Inc.), and blot images were acquired using a FluorChem 8900 Image System (Alpha Innotech, San Leandro, CA). Duplicate immunoblots were run for each sample, and each immunoblot was evaluated for either the EDA or the total FN isoforms.
Densitometry analysis of Western immunoblots was used to determine changes in protein content after treatment for each HTM cell strain tested (3 NTM and 3 GTM cell strains). In brief, band intensities of the EDA isoform, and total FN from WCL and CM samples, as well as corresponding β-actin bands (loading control for lysate samples) were measured using ImageJ software (National Institutes of Health, Bethesda, MD). For WCL samples, EDA isoform and total FN densitometry values were normalized against their corresponding internal loading control band value (β-actin). To determine changes in protein content after TGF-β2 treatment for each normalized WCL and CM samples, the relative fold change of treated over corresponding untreated control densitometry values were calculated. Data are presented as the average of the combined HTM cell relative fold change of EDA isoform and total FN isoforms after TGF-β2 treatment compared to the untreated controls.
Immunofluorescence Analysis
Immunocytochemistry.
Cultured HTM cells treated with or without TGF-β2 (5 ng/mL) for 4 and 7 days (n = 6) were fixed for 20 minutes in 4% paraformaldehyde (PFA), and nonspecific binding was blocked for 30 minutes with 5% normal goat serum (NGS)/1% BSA/0.05% Triton X-100/PBS. Two coverslips per HTM cell strain were double immunolabeled overnight at 4°C with primary antibodies. Primary antibodies were diluted in 3% NGS/1% BSA/0.05% Triton X-100/PBS: Rb-anti-FN (1:1000, F3648; Sigma-Aldrich) and Ms-anti-EDA (domain, 1:200, clone IST-9; Abcam). The rabbit–anti-FN antibody recognizes epitopes on the N-terminus of FN, which are expressed by all FN isoforms. No primary antibody was used as a negative control. Coverslips were incubated for an hour with corresponding secondary antibodies diluted in 3% NGS/1% BSA/0.05% Triton X-100/PBS: donkey–anti-mouse-Alexa Fluor 488 and donkey–anti-rabbit Alexa Fluor 594 (1:1000; Invitrogen-Molecular Probes, Eugene, OR). Coverslips were attached to slides with mounting medium containing 4′,6′-diamino-2-phenylindole (DAPI, Prolong with DAPI; Invitrogen-Molecular Probes) to stain nuclei. Imaging acquisition (×300–×600) was performed using a Nikon Eclipse Ti inverted fluorescence microscope (Nikon, Inc., Melville, NY) equipped with the Cri Nuance FX Camera System (Perkin-Elmer, Inc., Waltham, MA).
Immunohistochemistry (IHC).
Age-matched normal and glaucomatous human donor eyes were obtained formalin fixed within 6 hours of death from regional eye banks, and were paraffin embedded and sectioned (two 5-μm sagittal sections per slide; NTM, n = 6; GTM, n = 5). Sections were deparaffinized, rehydrated, and processed for citrate/heat antigen retrieval, 15 minutes in 100°C citrate buffer (pH 6.0) followed by 15 minutes in room temperature citrate buffer (pH 6.0). Nonspecific staining was blocked by incubation for 15 minutes with 0.05 M glycine/PBS followed by 30 minutes with 5% NGS/PBS. Sections were double immunolabeled overnight at 4°C with rabbit-anti–cFN-EDA antibody (1:200, NBP1-91258; Novus Biologicals, Littleton, CO) and mouse-anti-FN antibody (1:50, clone IST-4; Sigma-Aldrich), washed, and incubated for an hour with secondary antibodies. The mouse–anti-FN antibody recognizes epitopes on the N-terminus of FN, which are expressed by all FN isoforms. Secondary antibodies used were donkey–anti-rabbit Alexa Fluor 488 (1:500) and donkey–anti-mouse Alexa Fluor 594 (1:250, 3% NGS/PBS; Invitrogen-Molecular Probes). Slides were mounted and images acquired (×200–×600) as described above. Sections with no primary antibody were used as a negative control.
To quantify EDA isoform immunostaining in NTM and GTM tissues, a masked evaluation of each total TM area per image was used. Relative fluorescence intensity (integrated intensity values) for each HTM section image was obtained using ImageJ software (National Institutes of Health). Five equal size zones covering the entire TM region and 3 zones within background areas were analyzed. To obtain relative fluorescence value per TM tissue section, the average of TM zone values was background subtracted and at least two sections per tissue were analyzed. Lastly, the corresponding mean EDA isoform relative fluorescence values were compared, to calculate EDA isoform content changes between NTM and GTM tissues.
Statistical Analysis
The average values for NTM and GTM cultures/tissues are presented as mean ± SEM, with P values < 0.05 considered significant. To show significant mRNA expression changes of EDA and EDB isoforms, and total FN isoforms after various TGF-β2 treatment times compared to untreated controls, one-way ANOVA was used (GraphPad Prism 6.02; GraphPad Software, Inc., La Jolla, CA). To determine significant changes in HTM cell WCL, and CM of total FN and EDA isoform protein levels between TGF-β2 treated and untreated, one-way ANOVA also was used (GraphPad Software, Inc.). For comparison of GTM versus NTM tissue sections, the unpaired Student's t-test was performed (GraphPad Software, Inc.).
Results
cFN Isoforms Are Expressed in Cultured HTM Cells
Fibronectin is expressed in HTM tissue and AH of many species; however, previous studies did not address the expression of various cFN isoforms in TM tissues.21,22 Therefore, we examined mRNA expression of cFN isoforms in cultured NTM and GTM cells. Specific PCR primers were used to identify all mRNA FN isoforms (total FN), as well as specific EDA and EDB domains (see Table). We found that both EDA and EDB mRNA isoforms were expressed in all HTM cell strains evaluated (n = 7). Figure 1A shows a representative image of an agarose electrophoresis gel of the qRT-PCR amplified EDA and EDB regions. Interestingly, after comparing EDA and EDB isoform values from untreated HTM cells samples, no significant differences in EDA or EDB isoform mRNA basal expression levels were found between NTM and GTM cells (data not shown).
Figure 1.
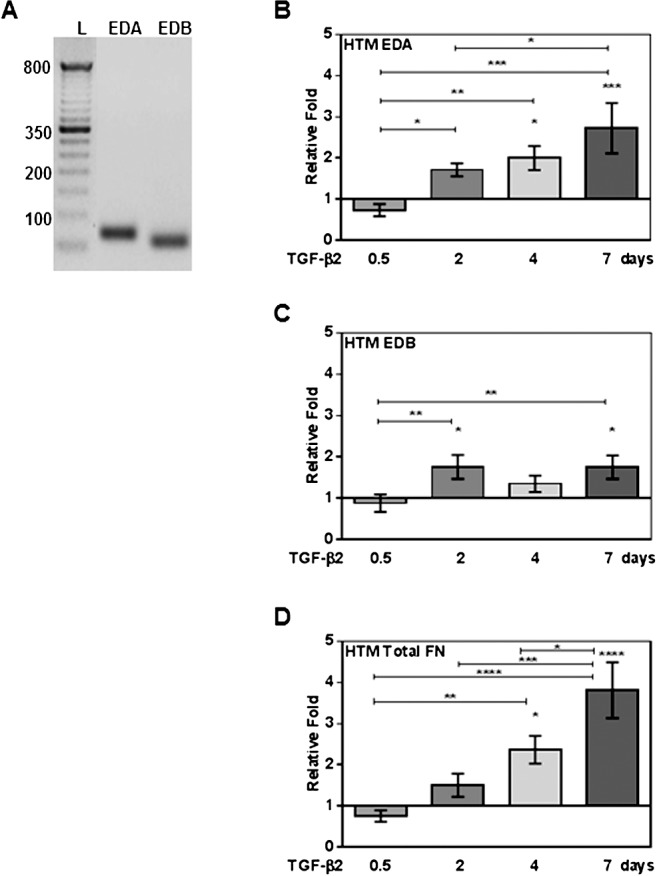
Quantitative RT-PCR analysis of expression, and TGF-β2 induction of cFN and total FN mRNA isoforms in cultured primary human TM cells. Three NTM and four GTM cell strains (HTM cells, n = 7) were treated with or without TGF-β2 (5 ng/mL) for 0.5, 2, 4, and 7 days, and mRNA changes analyzed by qRT-PCR. (A) A representative agarose electrophoresis gel image of EDA and EDB domain qRT-PCR products showing that HTM cells express EDA and EDB cFN isoforms (L, 100 base pair [bp] ladder). Significant induction of EDA (B), EDB (C) isoforms, and total FN (D) mRNA was observed in TGF-β2–treated HTM cells on days 2, 4, and 7. Each FN isoform expression was normalized to β-actin, and mRNA relative fold changes due to treatment were compared to untreated controls (mean ± SEM). Statistical significance between treatment time points were determined using 1-way ANOVA (n = 7; *P < 0.05, **P < 0.01, ***P < 0.001, and ****P < 0.0001).
TGF-β2 Induces mRNA Expression of Both cFN Isoforms in Cultured HTM Cells
The TGF-β2 induction of cFN isoforms has been shown previously in several tissues, in pathologic conditions, and in porcine TM cells25,29,30,36; however, cFN induction in HTM cells has not been reported previously to our knowledge. Therefore, we analyzed TGF-β2 (5 ng/mL) effects on cFN isoform mRNA expression in TM cell strains (n = 7). Exogenous TGF-β2 treatment significantly increased cFN isoforms and total FN mRNA expression compared to untreated controls (P < 0.05, Figs. 1B–D). When we compared TGF-β2–induced EDA, EDB, and total FN isoform expression between cultured NTM and GTM cells, we found no significant differences in responses between the NTM and GTM cells.
Extra domain A isoform mRNA expression was increased 2 days after treatment (P < 0.05 compared to 0.5 day), and remained significantly elevated at 4 days (P < 0.05 compared to untreated and P < 0.01 compared to 0.5 day) and 7 days (P < 0.001 compared to untreated, P < 0.001 compared to 0.5 day, and P < 0.05 compared to 2 days, Fig. 1B). We also found a significant induction of EDB mRNA isoform expression at 2 days (P < 0.05 compared to untreated and P < 0.01 compared to 0.5 day) and 7 days (P < 0.05 compared to untreated and P < 0.01 compared to 0.5 day, Fig. 1C).
A time-dependent induction of total FN mRNA levels was seen after TGF-β2 treatment. As reported previously,21 we observed an increase of total FN mRNA levels as soon as 2 days after TGF-β2 treatment. Our study now established that induction of total FN persists at 4 days (P < 0.05 compared to untreated and P < 0.01 compared to 0.5 day) and 7 days (P < 0.0001 compared to untreated, P < 0.0001 compared to 0.5 day, P < 0.001 compared to 2 days, and P < 0.05 compared to 4 days, Fig. 1D). No DNA contaminant was observed in untreated or treated samples (data not shown). Therefore, TGF-β2 induces EDA and EDB mRNA isoform expression, as well as total FN in HTM cells.
TGF-β2 Increases Total FN and EDA Isoform Protein Levels in Cultured HTM Cells
To examine the effect of TGF-β2 on cFN protein expression in HTM cells, we analyzed changes in EDA isoform and total FN protein levels. Cellular proteins in WCL and secreted proteins in CM from HTM cells (n = 6) were collected after treatment, and analyzed by Western immunoblot (Figs. 2A, 2B). Densitometry analyses of EDA isoform and total FN Western immunoblots demonstrated that TGF-β2 significantly increased EDA isoform, and total FN WCL (Fig. 2C) and CM (Fig. 2D) protein levels after 4 and 7 days of treatment compared to untreated controls (P < 0.05). When we compared TGF-β2–induced EDA and total FN isoform expression between cultured NTM and GTM cells, we found no significant differences in responses between the NTM and GTM cells.
Figure 2.
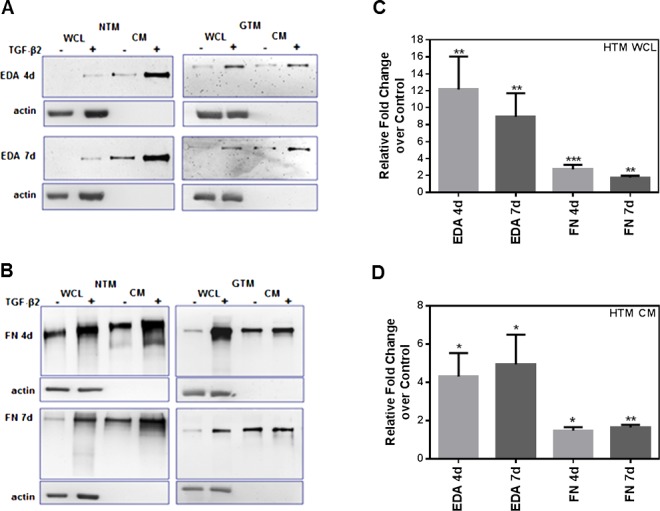
Induction of EDA isoform and total FN protein expression in human TM cells after TGF-β2 treatment. Three NTM and three GTM cell strains (HTM cells, n = 6) were treated for 4 and 7 days with or without TGF-β2 (5 ng/mL). Densitometry analysis of Western immunoblots was used to determine changes in EDA isoform and total FN protein content after treatment. Representative Western immunoblot images of EDA isoform (A) and total FN (B) in NTM and GTM cell strains showed induction of both FN isoforms in WCL and in CM samples after 4 and 7 days of TGF-β2 treatment. Densitometry analysis using ImageJ software of each FN immunoblot image showed a significant increase of EDA isoform, and total FN protein WCL (C) and CM (D) levels after TGF-β2 treatment when compared to untreated HTM cells. The WCL values were normalized to β-actin loading controls. Relative fold changes compared to untreated controls for WCL and CM values are represented as the mean ± SEM. Statistical significance was calculated using 1-way ANOVA (n = 6; *P < 0.05, **P < 0.01, ***P < 0.001).
The EDA isoform protein expression in WCL was induced significantly after 4 days (P < 0.01 compared to untreated) and 7 days (P < 0.01 compared to untreated) of TGF-β2 treatment (Fig. 2C). Similarly, total FN protein expression in WCL increased after 4 days (P < 0.001 compared to untreated) and 7 days (P < 0.01 compared to untreated, Fig. 2C).
In the case of protein content changes in CM (Fig. 2D), TGF-β2 significantly increased total FN and EDA isoform protein levels after 4 and 7 days of treatment. Extra domain A isoform protein content in CM was induced after 4 days (P < 0.05 compared to untreated) and 7 days (P < 0.05 compared to untreated). In the same way, total FN protein content in CM increased after 4 days (P < 0.05 compared to untreated) and 7 days (P < 0.01 compared to untreated). Thus, TGF-β2 induced cellular and secreted EDA, and total FN protein isoforms in HTM cells.
TGF-β2 Increases Total FN and EDA Isoform Fibril Network Formation in Cultured HTM Cells
The FN proteins are secreted and assembled into fibril networks, and these networks are important for cellular interactions that affect many biological processes.27,28 Therefore, we examined TGF-β2 induction of EDA isoform and total FN fibril formation in cultured HTM cell strains (n = 6, Fig. 3). Increased EDA isoform expression and fibril formation were detected at 4 and 7 days after TGF-β2 treatment (Fig. 3A). Similarly, induction of total FN expression and fibril formation were observed at 4 and 7 days.
Figure 3.
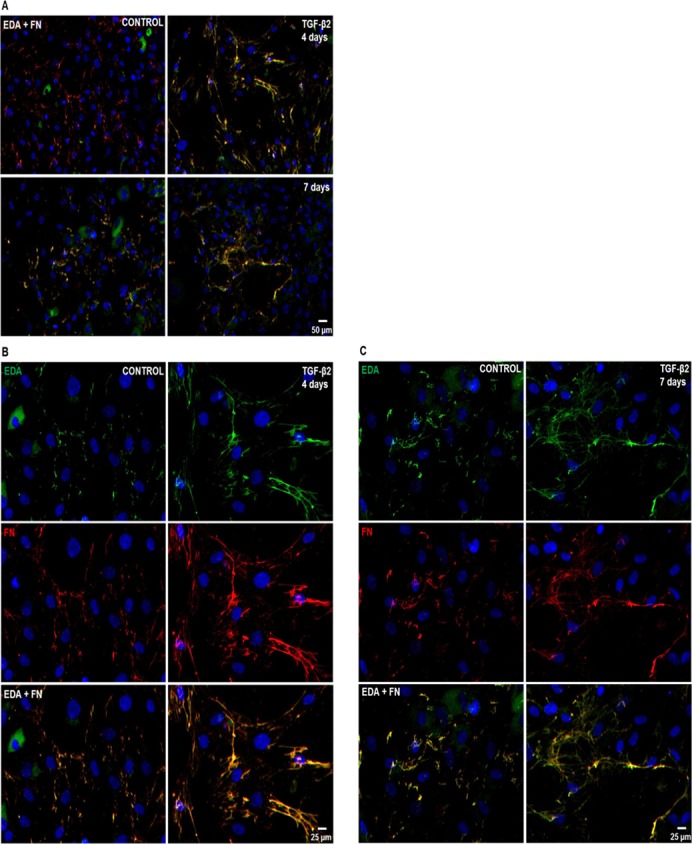
Effect of TGF-β2 on EDA isoform and total FN fibril network formation in cultured human TM cells. Three NTM and three GTM cell strains were grown on glass coverslips and treated for 4 and 7 days with or without TGF-β2 (5 ng/mL). EDA isoform and total FN fibril formation was detected by double ICC analysis. (A) Representative images of EDA isoform (green) and total FN (red) immunostaining showed induction of fibril formation after 4 and 7 days of TGF-β2 treatment when compared to untreated control HTM cells. Higher magnification images of EDA isoform and total FN immunostaining revealed thicker fibrils as well as colocalization of both FN isoforms (EDA + FN) after 4 (B) and 7 (C) days of TGF-β2 treatment when compared to untreated controls. DAPI staining was used to counterstain nuclei. Scale bars = 50 μm (A), = 25 μm (B, C).
Furthermore, TGF-β2 treatment caused a classic FN fibril formation, displaying branched networks extending around cells, as well as mature thick matrixes positive immunolabeled for EDA isoform and total FN at 4 days (Fig. 3B) and 7 days (Fig. 3C). Nonspecific staining was not seen in negative controls (data not shown). Therefore, TGF-β2 induced the formation of EDA isoform positive FN fibrils networks in HTM cells. No differences in EDA isoform or total FN immunostaining were observed between NTM and GTM cells.
EDA Isoform Protein Is Elevated in Glaucomatous HTM Tissues
The EDA isoform protein levels and tissue distribution were examined and compared in HTM tissue sections of age-matched normal (n = 6) and glaucoma (n = 5) donor eyes by IHC analysis. The EDA isoform protein immunostaining was present in all areas of the TM. The distribution was associated mainly with HTM cells and also was localized in cells of the Schlemm's canal (SC) endothelium (Fig. 4A, arrowheads). The EDA isoform immunolabeling pattern suggested that EDA isoform fibrils assembled around HTM cells (Fig. 4A, arrows), and were codistributed with total FN (Fig. 4A, EDA + FN). As expected, total FN was identified not only with HTM cells, but throughout the TM extracellular spaces and beams.
Figure 4.
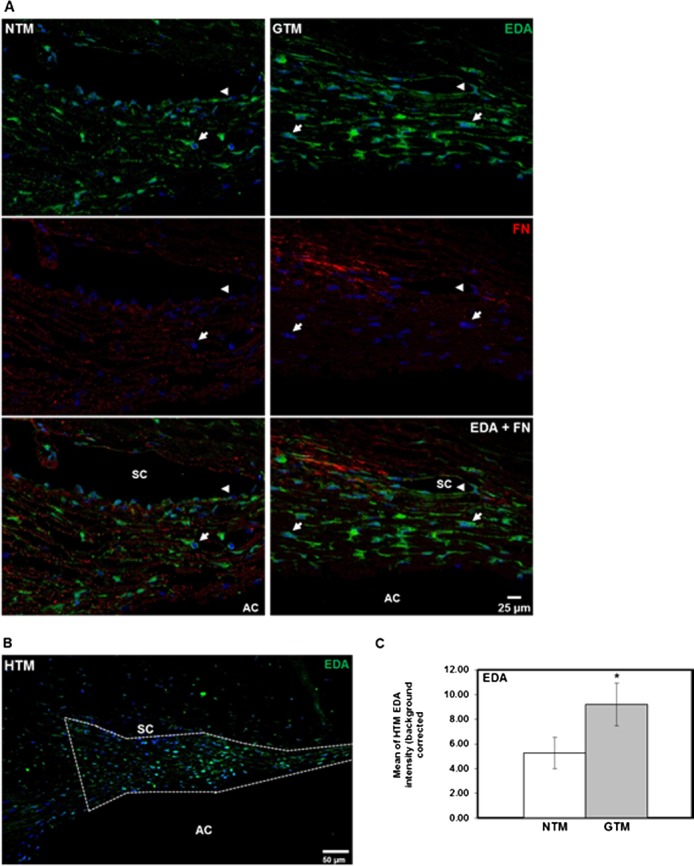
Comparison of EDA isoform protein expression and tissue distribution in human NTM and GTM tissues. Six NTM and five GTM donor eyes were sagittal sectioned, and analyzed by IHC for EDA isoform, and total FN protein expression and tissue distribution. (A) Representative images comparing expression and codistribution of EDA isoform and total FN protein on NTM and GTM tissue sections showed increased amounts of the EDA isoform that colocalized with total FN in some areas. Its distribution was mostly cellular associated (arrows). In addition, we observed EDA isoform labeling in cells of the Schlemm's canal endothelium (arrowheads). (B) Representative image showing outlined TM area that was analyzed for EDA isoform content for comparison between NTM and GTM tissues. (C) Densitometry analysis of the HTM area on each tissue section demonstrated a significant increase in relative intensity of EDA isoform content in GTM tissues when compared to NTM tissues. Relative intensity data of EDA isoform content are represented as the mean ± SEM. Statistical significance was calculated using the unpaired Student's t-test (NTM, n = 6; GTM, n = 5; *P < 0.05). AC, anterior chamber. Scale bars: = 25 μm (A), = 50 μm (B).
Since EDA isoform expression appeared to be greater in GTM tissues, the mean relative intensity of EDA isoform immunostaining identified in the entire NTM and GTM area (Fig. 4B) per section was calculated. Relative intensity comparison of EDA isoform expression between NTM and GTM tissue sections showed a significant 1.7-fold increase in EDA isoform expression in GTM tissues (P < 0.05, Fig. 4C). Nonspecific staining was not seen in negative controls (data not shown).
Discussion
Elevated IOP is a major risk factor in the development and progression of POAG. Glaucomatous ocular hypertension is a result of a rise in AH outflow resistance, resulting from increased synthesis and deposition of ECM proteins in the TM.2,3,13,14 TGF-β2 is elevated in glaucoma patient AH and TM tissues, and is believed to drive increased ECM deposition in POAG eyes.15,18,19 We demonstrated for the first time to our knowledge the expression of cFN isoforms in human NTM and GTM cells and tissues, and that the EDA isoform is elevated in GTM tissue. We also showed that TGF-β2 induces cFN, EDA, and EDB isoform expression, and EDA isoform–positive FN fibril formation in HTM cells.
Previous studies have shown the expression of FN and FN alternatively spliced isoforms containing regions of the IIICS domain in HTM cells and tissues.7,21,22,38 To expand on these studies, we demonstrated that cFN isoforms containing EDA or EDB domains also are expressed in NTM and GTM cells. In addition, our studies also showed that no significant differences were found in basal cFN levels or in TGF-β2 induction of cFN isoforms between NTM and GTM cells (data not shown). However, levels of the EDA isoform were higher in GTM compared to NTM tissues (Fig. 4). This discrepancy may be due to the acute nature of our in vitro TM cell culture experiments (i.e., exposure to TGF-β2 for 1–7 days) compared to the chronic exposure (i.e., decades) to TGF-β2 in glaucomatous TM tissues. TGF-β2 alters the synthesis, degradation, and cross-linking of ECM proteins, including FN, in the TM, and the overall effects on the ECM may vary significantly over time. In addition, other factors in the aqueous humor known to affect ECM metabolism, such as ascorbate and other growth factors, are present in vivo, but are not reflected in our TM cell culture conditions. These data suggested that regulation of FN isoform expression in HTM cells may be responsible at least partially for the cellular, structural, and functional changes that occur with TGF-β2 exposure in the glaucomatous TM.
Induction of EDA and EDB cFN isoforms by TGF-β2 was reported previously in porcine TM cells, but mRNA levels were undetected in untreated porcine TM cells.36 Our studies demonstrated that cFN isoforms not only are expressed normally in HTM cells, but also were induced significantly by TGF-β2. The TGF-β2 induction of cFN isoforms might reflect a general response in the production of all type of FN isoforms. However, we observed temporal differences in the TGF-β2 induction pattern of both cFN mRNA isoforms. Both EDA isoform and total FN expression were induced gradually by TGF-β2 over 7 days, while EDB isoform induction reached a plateau after only 2 days. We also confirmed that TGF-β2 treatment for 4 and 7 days induced EDA isoform protein expression, as well as stimulated extracellular EDA isoform fibril formation. Similarly, differences in cFN isoform expression were observed in porcine TM cells. Vittal et al. subjected porcine TM cells to sustained mechanical stretching and only the EDB isoform was affected, suggesting that the cFN isoform response might depend on the type of stimuli.39 In our study, we focused on the EDA protein isoform because of its reported involvement in fibrosis, ECM deposition, fibril formation, and cellular interactions.24,25,27,29,30 However, EDA isoform fibrils also may include cFN isoforms containing both EDA–EDB domains. Therefore, future studies are needed to address the potential roles of EDB isoforms in the TM.
We also examined EDA isoform expression in human NTM and GTM tissues via IHC staining. The EDA isoform distribution was cell-associated throughout the TM, and protein levels were increased significantly (1.7-fold) in GTM tissues. Previous studies showed increased levels of TGF-β2 in GTM tissues and in glaucomatous AH.15–17 The increased expression of cFN EDA isoforms in GTM tissues might be caused by endogenous levels of TGF-β2, similar to the induction by exogenous TGF-β2 observed in our in vitro HTM cell studies.
The TGF-β2 induction of cFN isoform expression in HTM cells and increased cFN levels in GTM tissues may change ECM-TM cell interactions and/or TM ECM remodeling, thereby influencing AH outflow and IOP. The mechanism(s) by which cFN isoforms may affect TM functions, AH outflow, and IOP levels still must be elucidated. Previous studies have suggested that FN not only provides cellular support, but also participates in many biological mechanisms, including the regulation of AH outflow.7,12,22,38 The FN isoforms may affect the TM microenvironment by altering cell–ECM and ECM–ECM interactions, TM stiffness, ECM protein deposition, growth factor signaling, and cytoskeletal organization.
The TGF-β2 induces not only cFN isoform expression, but also increases the formation of thick FN fibril matrixes, including the EDA isoform (Fig. 3). The inclusion of EDA and/or EDB domains in FN will transform the globular FN form into an unfolded and stretched insoluble protein, increasing FN fibril formation and cellular interactions.23,25,26 The FN fibril network formation may lead to cellular rigidity, including F-actin stress fiber formation and alignment along FN fibrils, with changes in integrin-actin complex formation.27,38,40 Thus, increased deposition of cFN in TM may influence TM function by affecting the TM cell contractility, as well as ECM-TM cell interactions.
In addition to the possible role of cFN isoforms on TM cell contractility, cFN also may affect the activity of factors involved in cell function and/or the ECM remodeling that occurs in GTM tissues. Studies in porcine TM36 and other tissues22,23,25,30,41–43 suggest that expression of EDA isoforms can change ECM homeostasis by affecting the activity of matrix metalloproteases (MMPs), MMP inhibitors, and cross-linking enzymes, such as lysyl oxidases and tissue transglutaminases.
Several studies using HTM cells,22,38,44 and ex vivo human and primate perfusion organ culture models22,45,46 have proposed that FN isoforms with specific domains, such as HepII, can help reduce TM AH outflow resistance and alter the TM cell actin cytoskeleton. However, the inclusion of the EDA and/or EDB domains may affect other FN domain functions. Therefore, further studies are needed to understand fully the relative contributions of each FN isoform in regulating TM cell function, ECM–cell interactions, AH outflow facility, and IOP.
In summary, we demonstrated that cFN, EDA, and EDB isoforms, are expressed in HTM cells, and that TGF-β2 induced cFN isoform expression, as well as FN and EDA isoform-positive fibril formation. Lastly, our studies showed that EDA isoform expression was significantly higher in GTM tissues. The TGF-β2 regulation of cFN isoform expression highlights the complexity of ECM remodeling that may alter normal HTM function. We suggested that induction of total FN, as well as profibrotic EDA and EDB isoforms may have an important role in TM ECM homeostasis, and in the capacity of the HTM to interact with and react to its microenvironment. Understanding the expression, regulation, and mechanism of action of cFN isoforms in the TM may lead to the discovery of agents that will normalize TM function, decrease IOP, and reduce further glaucomatous damage.
Acknowledgments
The authors thank Anne-Marie Brun-Zinkernagel of the Department of Cell Biology and Anatomy, University of North Texas Health Science Center, for technical assistance.
Supported by National Institutes of Health Grant RO1 EY-017374.
Disclosure: W.E. Medina-Ortiz, None; R. Belmares, None; S. Neubauer, None; R.J. Wordinger, None; A.F. Clark, None
References
- 1. Quigley HA, Broman AT. The number of people with glaucoma worldwide in 2010 and 2020. Br J Ophthalmol. 2006; 90: 262–267 [DOI] [PMC free article] [PubMed] [Google Scholar]
- 2. Tamm ER, Fuchshofer R. What increases outflow resistance in primary open-angle glaucoma? Surv Ophthalmol. 2007; 52: S101–S104 [DOI] [PubMed] [Google Scholar]
- 3. Kwon YH, Fingert JH, Kuehn MH, Alward WLM. Primary open-angle glaucoma. N Engl J Med. 2009; 360: 1113–1124 [DOI] [PMC free article] [PubMed] [Google Scholar]
- 4. Weinreb RN., Brandt JD, Garway-Heath D, et al. Intraocular Pressure: Reports and Consensus Statements of the 4th Global AIGS Consensus Meeting on Intraocular Pressure. Amsterdam, The Netherlands: Kugler; 2007. [Google Scholar]
- 5. Leske MC, Wu SY, Hennis A, Honkanen R, Nemesure B. BES. Study Group. Risk factors for incident open-angle glaucoma: the Barbados Eye Studies. Ophthalmol. 2008; 115: 85–93 [DOI] [PubMed] [Google Scholar]
- 6. Trivedi RH, Nutaitis M, Vroman D, Crosson CE. Influence of race and age on aqueous humor levels of transforming growth factor-beta 2 in glaucomatous and nonglaucomatous eyes. J Ocular Pharm Therap. 2011; 27: 477–480 [DOI] [PMC free article] [PubMed] [Google Scholar]
- 7. Acott TS, Kelley MJ. Extracellular matrix in the trabecular meshwork. Exp Eye Res. 2008; 86: 543–561 [DOI] [PMC free article] [PubMed] [Google Scholar]
- 8. Goel M, Picciani RG, Lee RK, Bhattacharya SK. Aqueous humor dynamics: review. Open Ophthalmol J. 2010; 4: 52–59 [DOI] [PMC free article] [PubMed] [Google Scholar]
- 9. Tamm ER. The trabecular meshwork outflow pathways: structural and functional aspects. Exp Eye Res. 2009; 88: 648–655 [DOI] [PubMed] [Google Scholar]
- 10. Read AT, Chan DW, Ethier CR. Actin structure in the outflow tract of normal and glaucomatous eyes. Exp Eye Res. 2006; 82: 974–985 [DOI] [PubMed] [Google Scholar]
- 11. Zhang M, Maddala R, Rao PV. Novel molecular insights into RhoA GTPase-induced resistance to aqueous humor outflow through the trabecular meshwork. Am J Physiol Cell Physiol. 2008; 295: C1057–C1070 [DOI] [PMC free article] [PubMed] [Google Scholar]
- 12. Keller KE, Aga M, Bradley JM, Kelley MJ, Acott TS. Extracellular matrix turnover and outflow resistance. Exp Eye Res. 2009; 88: 676–682 [DOI] [PMC free article] [PubMed] [Google Scholar]
- 13. Tektas OY, Lütjen-Drecoll E. Structural changes of the trabecular meshwork in different kinds of glaucoma. Exp Eye Res. 2009; 88: 769–775 [DOI] [PubMed] [Google Scholar]
- 14. Last JA, Pan T, Ding Y, et al. Elastic modulus determination of normal and glaucomatous human trabecular meshwork. Invest Ophthalmol Vis Sci. 2011; 52: 2147–2152 [DOI] [PMC free article] [PubMed] [Google Scholar]
- 15. Prendes MA, Harris A, Wirostko BM, Gerber AL, Siesky B. The role of transforming growth factor β in glaucoma and the therapeutic implications. Br J Ophthalmol. 2013; 680–686 [DOI] [PubMed] [Google Scholar]
- 16. Tripathi RC, Li J, Chan WA, Tripathi BJ. Aqueous humor in glaucomatous eyes contains an increased level of TGF-β2. Exp Eye Res. 1994; 59: 723–727 [DOI] [PubMed] [Google Scholar]
- 17. Ozcan AA, Ozdemir N, Canataroglu A. The aqueous levels of TGF-β2 in patients with glaucoma. Int Ophthalmol. 2004; 25: 19–22 [DOI] [PubMed] [Google Scholar]
- 18. Gottanka J, Chan D, Eichhorn M, Lütjen-Drecoll E, Ethier CR. Effects of TGF-β2 in perfused human eyes. Invest Ophthalmol Vis Sci. 2004; 45: 153–158 [DOI] [PubMed] [Google Scholar]
- 19. Fleenor DL, Shepard AR, Hellberg PE, Jacobson N, Pang IH, Clark AF. TGFβ2-induced changes in human trabecular meshwork: implications for intraocular pressure. Invest Ophthalmol Vis Sci. 2006; 47: 226–234 [DOI] [PubMed] [Google Scholar]
- 20. Shepard AR, Miller JC, Pang IH, Jacobson N, Wang WH, Clark AF. Adenoviral gene transfer of active human transforming growth factor-β2 elevates intraocular pressure and reduces outflow facility in rodent eyes. Invest Ophthalmol Vis Sci. 2010; 51: 2067–2076 [DOI] [PubMed] [Google Scholar]
- 21. Wordinger RJ, Fleenor DL, Hellberg PE, et al. Effects of TGF-β2, BMP-4, and gremlin in the trabecular meshwork: implications for glaucoma. Invest Ophthalmol Vis Sci. 2007; 48: 1191–1200 [DOI] [PubMed] [Google Scholar]
- 22. Faralli JA, Schwinn MK, Gonzalez JM Jr, Filla MS, Peters DM. Functional properties of fibronectin in the trabecular meshwork. Exp Eye Res. 2009; 88: 689–693 [DOI] [PMC free article] [PubMed] [Google Scholar]
- 23. White ES, Baralle FE, Muro AF. New insights into form and function of fibronectin splice variants. J Pathol. 2008; 216: 1–14 [DOI] [PMC free article] [PubMed] [Google Scholar]
- 24. White ES, Muro AF. Fibronectin splice variants: understanding their multiple roles in health and disease using engineered mouse models. IUBMB Life. 2011; 63: 538–546 [DOI] [PubMed] [Google Scholar]
- 25. To WS, Midwood KS. Plasma and cellular fibronectin: distinct and independent functions during tissue repair. Fibrogenesis Tissue Repair. 2011; 4: 1–17 [DOI] [PMC free article] [PubMed] [Google Scholar]
- 26. Wierzbicka-Patynowski I, Schwarzbauer JE. The ins and outs of fibronectin matrix assembly. J Cell Sci. 2003; 116: 3269–3276 [DOI] [PubMed] [Google Scholar]
- 27. Mao Y, Schwarzbauer J. Fibronectin fibrillogenesis, cell-mediated matrix assembly process. Matrix Biol. 2005; 24: 389–399 [DOI] [PubMed] [Google Scholar]
- 28. Singh P, Carraher C, Schwarzbauer JE. Assembly of fibronectin extracellular matrix. Annu Rev Cell Dev Biol. 2010; 26: 397–419 [DOI] [PMC free article] [PubMed] [Google Scholar]
- 29. Leask A, Abraham DJ. TGF-beta signaling and the fibrotic response. FASEB J. 2004; 18: 816–827 [DOI] [PubMed] [Google Scholar]
- 30. Muro AF, Moretti FA, Moore BB, et al. An essential role for fibronectin extra type iii domain a in pulmonary fibrosis. Am J Respir Crit Care Med. 2008; 177: 638–645 [DOI] [PMC free article] [PubMed] [Google Scholar]
- 31. Kohan M, Muro AF, White ES, Berkman N. EDA-containing cellular fibronectin induces fibroblast differentiation through binding to α4β7 integrin receptor and MAPK/Erk 1/2-dependent signaling. FASEB J. 2010; 24: 4503–4512 [DOI] [PMC free article] [PubMed] [Google Scholar]
- 32. Barnes VL, Musa J, Mitchell RJ, Barnes JL. Expression of embryonic fibronectin isoform EIIIA parallels alpha-smooth muscle actin in maturing and diseased kidney. J Histochem Cytochem. 1999; 47: 787–798 [DOI] [PubMed] [Google Scholar]
- 33. Van Vliet A, Baelde HJ, Vieming LJ, de Heer E, Bruijn JA. Distribution of fibronectin isoforms in human renal disease. J Pathol. 2001; 193: 256–262 [DOI] [PubMed] [Google Scholar]
- 34. Serini G, Bochatan-Piallat M, Ropraz P, et al. The fibronectin domain ed-a is crucial for myofibroblastic phenotype induction by transforming growth factor-β1. J Cell Biol. 1998; 142: 873–881 [DOI] [PMC free article] [PubMed] [Google Scholar]
- 35. Inoue T, Nabashima K, Shimao Y, Kataoka H, Koono M. Cell density-dependent regulation of fibronectin splicing at the EDA region in fibroblasts: cell density also modulates the responses of fibroblasts to TGF-β and cancer cell-conditioned medium. Cancer Lett. 1998; 129: 45–54 [DOI] [PubMed] [Google Scholar]
- 36. Li J, Tripathi BJ, Tripathi RC. Modulation of pre-mrna splicing and protein production of fibronectin by TGF-β2 in porcine trabecular cells. Invest Ophthalmol Vis Sci. 2000; 41: 3437–3443 [PubMed] [Google Scholar]
- 37. Sethi A, Mao W, Wordinger RJ, Clark AF. Transforming growth factor-beta induces extracellular matrix protein cross-linking lysyl oxidase (LOX) genes in human trabecular meshwork cells. Invest Ophthalmol Vis Sci. 2011; 52: 5240–5250 [DOI] [PMC free article] [PubMed] [Google Scholar]
- 38. Schwinn MK, Gonzalez JM Jr, Gabelt BT, Sheibani N, Kaufman PL, Peters DM. Heparin II domain of fibronectin mediates contractility through an a4b1 co-signaling pathway. Exp Eye Res. 2010; 316: 1500–1512 [DOI] [PMC free article] [PubMed] [Google Scholar]
- 39. Vittal V, Rose A, Gregory KE, Kelley MJ, Acott TS. Changes in gene Expression by trabecular meshwork cells in response to mechanical stretching. Invest Ophthalmol Vis Sci. 2005; 46: 2857–2868 [DOI] [PubMed] [Google Scholar]
- 40. Welge-Lüssen U, May CA, Lütjen-Drecoll E. Induction of tissue transglutaminase in the trabecular meshwork by TGF-beta1 and TGF-beta2. Invest Ophthalmol Vis Sci. 2000; 41: 2229–2238 [PubMed] [Google Scholar]
- 41. Dugina V, Fontao L, Chaponnier C, Vasiliev J, Gabbiani G. Focal adhesion features during myofibroblastic differentiation are controlled by intracellular and extracellular factors. J Cell Sci. 2001; 114: 3285–3296 [DOI] [PubMed] [Google Scholar]
- 42. Fogelgren B, Polgár N, Szauter KM, et al. Cellular fibronectin binds to lysyl oxidase with high affinity and is critical for its proteolytic activation. J Biol Chem. 2005; 280: 24690–24697 [DOI] [PubMed] [Google Scholar]
- 43. Saito S, Yamaji N, Yasunaga K, et al. The fibronectin extra domain A activates matrix metalloproteinase gene expression by an interleukin-1-dependent mechanism. J Biol Chem. 1999; 274: 30756–30763 [DOI] [PubMed] [Google Scholar]
- 44. Peterson JA, Sheibani N, David G, Garcia-Pardo A, Peters DM. Heparin II domain of fibronectin uses alpha4beta1 integrin to control focal adhesion and stress fiber formation, independent of syndecan-4. J Biol Chem. 2005; 280: 6915–6922 [DOI] [PubMed] [Google Scholar]
- 45. Gonzalez JM Jr, Hu Y, Gabelt BT, Kaufman PL, Peters DM. Identification of the active site in the heparin II domain of fibronectin that increases outflow facility in cultured monkey anterior segments. Invest Ophthalmol Vis Sci. 2009; 50: 235–241 [DOI] [PMC free article] [PubMed] [Google Scholar]
- 46. Santas AJ, Bahler C, Peterson JA, et al. Effect of heparin II domain of fibronectin on aqueous outflow in cultured anterior segments of human eyes. Invest Ophthalmol Vis Sci. 2003; 44: 4796–4804 [DOI] [PubMed] [Google Scholar]