Abstract
We present an automated two-dimensional Fourier transform (2D-FT) approach to analyze the local organization of myelinated axons in the spinal cord. Coherent anti-Stokes Raman scattering (CARS) microscopy was used to observe lesions in a commonly used animal model of multiple sclerosis (MS), experimental autoimmune encephalomyelitis (EAE). A 2D-FT was applied on the CARS images to find the average orientation and directional anisotropy of the fibers within contiguous image domains. We introduce the corrected correlation parameter (CCP), a measure of the correlation between orientations of adjacent domains. We show that in the EAE animal model of MS, the CCP can be used to quantify the degree of organization/disorganization in the myelin structure. This analysis was applied to a large image dataset from animals at different clinical scores and we show that some descriptors of the CCP probability density function are strongly correlated with the clinical scores. This procedure, compatible with live animal imaging, has been developed to perform local in situ evaluation of myelinated axons afflicted by EAE.
OCIS codes: (300.6230) Spectroscopy, coherent anti-Stokes Raman scattering; (100.2960) Image analysis; (170.3880) Medical and biological imaging; (180.4315) Nonlinear microscopy; (180.6900) Three-dimensional microscopy; (000.1430) Biology and medicine; (170.4580) Optical diagnostics for medicine
1. Introduction
Proper function of the nervous system relies on fast electrical conduction between neurons, sometimes over very long distances. For instance, muscle movements are triggered by action potentials that propagate from cortical neurons to the spinal cord and finally to the neuromuscular junction. The myelin sheath surrounding the axons in the white matter of the central nervous system (CNS) is essential for efficient and fast transmission of electric signals between the source and target cells. The degeneration of myelin along axons caused by certain CNS pathologies such as multiple sclerosis (MS), leads to poor signal conduction. Demyelination also causes axons to become vulnerable to irreversible damage caused by immune cells, which often results in paralysis [1]. The driving mechanisms for the loss of myelin are thought to be largely autoimmune in nature [2]. However, much remains unanswered with respect to the exact sequence of events leading to lesion formation in MS and the key players that are involved [3, 4]. The experimental autoimmune encephalomyelitis (EAE) animal model is a good surrogate for the human condition [5, 6]. The clinical progression of the disease is assessed by evaluating the motor skills of the animal. The clinical score, given on a scale of 0 to 5, represents a global average of all lesions across the brain and spinal cord into a single number representing their final effects on motor skills, and as such, does not provide information on the severity of individual lesions. This is in stark contrast with the cellular view of EAE where one observes a very high amount of heterogeneity in spinal cord lesions both throughout the cord and across different animals [7]. With this in mind, there is a clear need for a local, objective, and fast assessment of myelin morphology or architecture to identify and follow potential early lesions at the cellular level.
Myelin was visualized with coherent anti-Stokes Raman scattering (CARS) microscopy, a label-free technique that takes advantage of the endogenous contrast provided by the lipid content of myelin [8–10]. CARS imaging of spinal tissue has been first reported in 2005 by Wang et al. [11]. Since then, it has been used to visualize demyelination [12–16], and we have proposed several techniques to characterize myelin morphology in this context [17, 18]. We now extend this work using CARS images of myelin acquired in mice affected with EAE to quantify the local tissue architecture within an image, but not the structure of individual myelin sheaths.
Recently, researchers have characterized the local tissue architecture of collagen imaged with second harmonic microscopy by using a two-dimensional Fourier transform (2D-FT) method [19–21]. More specifically, the average fiber orientation as well as the directional anisotropy within the image were extracted from the 2D-FT and then used to calculate the correlation between the orientations of neighboring domains [22]. The main goal of the present article is therefore to expand this formalism and to introduce a metric adapted to myelin images obtained with CARS microscopy. This metric becomes a local assessment of myelin health. First, we demonstrate how the degree of directional anisotropy is incorporated as a modification to the correlation parameter introduced previously. Then, we show how it is calculated on images of the spinal cord taken from EAE mice at different clinical stages of the disease. Finally, we conclude by discussing how this new metric is highly sensitive to regions where the myelin structure is strongly disrupted and can be used to separate lesions from healthy tissue.
The MATLAB code implementing this analysis as well as the data will be made available on the group web site at http://www.dcclab.ca.
2. Materials and methods
2.1. EAE Induction
EAE was induced in eight 10 weeks old C57BL/6 female mice using the Hooke Laboratories kit EK-0115. The kit is composed of an emulsion of complete Freund’s adjuvant (CFA) and MOG35-55 (1 mg/mL), a myelin oligodendrocyte peptide. The CFA is composed of incomplete Freund’s adjuvant with killed mycobacterium tuberculosis H37Ra (2 mg/mL). On the day of immunization, mice received 0.1 mL of the emulsion injected subcutaneously (s.c.) on the upper back and 0.1 mL on the lower back. They were also administered 0.1 mL of pertussis toxin (PTX, 0.7–10 μg/mL of phosphate buffer solution (PBS)) intraperitoneally (i.p.) and again 24 hours later. A total of four control animals were divided into two groups. First, two CFA control mice received the same injections on day 0 and 1, but an antigen-free emulsion was used. The CFA control mice are used to assess the effects of both PTX and CFA on myelin. Secondly, two saline control mice received saline only both s.c. and i.p. on day 0 and 1. Clinical signs were scored daily and graded from 0 to 5: 0 = no signs, 1 = limp tail, 2 = limp tail and weakness in hind legs, 3 = limp tail and paralysis of hind legs, 4 = limp tail, paralysis of hind legs and weakness of front legs, 5 = complete paralysis of both hind and front legs. All procedures were approved by our local institutional animal care and use committee.
2.2. Tissue preparation
Mice were selected for tissue processing based on their clinical score to have tissue samples from all of the early stages of the disease (0–3). Mice were intracardially perfused with 0.1 M PBS followed by 4% paraformaldehyde (PFA). The whole spinal cord was dissected out from each mouse and placed in 4% PFA overnight. Cervical, thoracic and lumbar spinal segments corresponding respectively to the C3-5, T4-8 and L3-5 levels were isolated from the spinal cord. Each spinal segment was mounted in a petri dish filled with agarose gel. A cavity corresponding approximately to the size of each spinal segment was carved into the gel and used to support the segment during imaging. The remaining space was filled with 0.1 M PBS and a coverslip was mounted on top of the agarose chamber.
2.3. CARS microscopy
The laser sources and the custom-made video-rate laser scanning microscope have been described previously [23]. In short, the laser system consists of an optical parametric oscillator (OPO) (Levante Emerald OPO ps, APE-Berlin) pumped by a frequency-doubled Nd:Vanadate mode-locked laser (picoTRAIN, High Q Laser). CARS is a nonlinear process requiring two pulsed laser beams whose frequency difference matches a Raman active vibration in the sample [24,25]. To probe the CH2 symmetric stretch vibrations of lipids at 2845 cm−1, the 1064 nm laser was used as the Stokes beam with the signal from the OPO tuned to 816.8 nm as the pump beam. The excitation beams were overlapped in space using a dichroic long-pass filter (LP02-1064RU-25, Semrock) and in time using a delay line before being sent to the video-rate laser scanning microscope. The states of polarization of the excitation beams was carefully controlled to be circular to avoid the polarization dependence of the CARS signal intensity [17]. To avoid photodamage of the spinal cord tissue, the average power of the pump and Stokes beam at the sample was limited to a few tens of mW.
The microscope achieves an image acquisition rate of 15 frames per second by using a gold-coated polygonal mirror for the fast axis (DT-36-290-025, Lincoln Laser) and a galvanometer mirror for the slow axis (6240H, Cambridge Technology). The field of view (FOV) of the microscope is 112.5 μm by 112.5 μm with a 60× objective lens (UPLSAPO 1.2 NA w, Olympus) and the images are 500×500 pixels in size (225 nm/pixel). The backscattered anti-Stokes signal at 662.8 nm was epi-detected using a dichroic long-pass filter (FF735-Di01- 25×36, Semrock) for the signal extraction, the combination of two laser block filters (FF01-750/SP-25, Semrock) and a band-pass filter (FF01-655/40-25, Semrock) to filter out unwanted residual light and a red-sensitive photomultiplier tube (R3896, Hamamatsu) for the detection.
2.4. CARS map acquisitions of the spinal cord surface
All spinal segments (cervical, thoracic and lumbar) were imaged on the dorsal side. Additionally, for the lumbar segments, the lateral and ventral sides were imaged as well. To image the complete surface of a segment, the sample was moved using a manipulator (MPC-200 with ROE-200, Sutter Instrument) across a volume corresponding to a thin rectangular slab containing the surface planes of the spinal cord. This gave an x–y grid sequence of z-stacks with an overlap of 20 % of the image FOV. Complete maps were typically acquired in 4 hours.
2.5. Post-acquisition image processing
Prior to the analysis, some image processing was required to generate 2D maps of the spinal cord surface. First, all the raw images were flat-field corrected and then the z-stacks were assembled together using Fiji [26] to form 3D maps. The last step consists in reducing the volumes to 2D maps by choosing the surface plane of interest, to facilitate their visual exploration, reduce the file sizes and decrease computation time for the analysis. The challenge in this step lies in defining this plane of interest in terms of quantitative parameters that can be automatically measured. For our particular case, we found that the average intensity and the standard deviation of the pixel values in a 100×100 window surrounding a pixel of interest in an image plane of a 3D map are good indicators to determine if that particular pixel is located in the plane of interest. For every pixel in a given x–y plane, the average intensity and standard deviation values were compared with those calculated from the pixels located in the same x–y position but at different z positions of the 3D maps. By maximizing those values, one can determine which z pixel is best suited for the 2D reconstruction of the spinal cord surface.
2.6. Analysis of fiber orientation
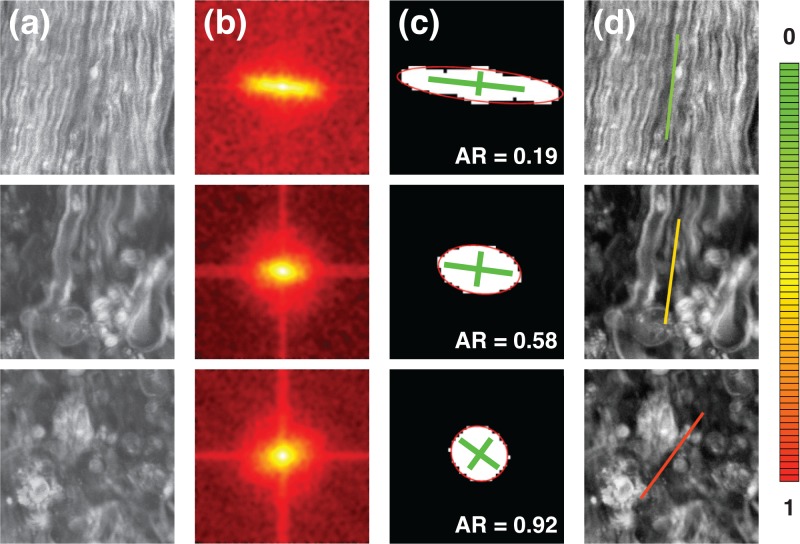
The general orientation of the fibers was obtained by finding the orientation of the Fourier spectrum of the image. In the first step of the analysis, a CARS map of the surface of the spinal cord segment was subdivided into square domains of equal sizes. The domains were transformed using a 2D-FT. The resulting images were treated using a 2D adaptive Wiener noise filtering method [27] and a 2D Savitzky-Golay smoothing filter [28] before undergoing segmentation. Each image was then segmented using a thresholding method described below and the resulting segmented object was transformed into an ellipse that has the same second-order moments.
The average fiber orientation within the image domain can be inferred from the direction of the minor axis of the ellipse. This orientation is expressed within the range ±90° with respect to the image horizontal axis. In addition, the directional anisotropy within the image domain is given by the aspect ratio (AR) between the minor and the major axes of the ellipse. The AR is interpreted as the accuracy of the calculated average fiber orientation, with values ranging from 0 (accurate) to 1 (inaccurate).
To determine the optimal domain size, we calculated the median AR from all the maps from control animals (saline and CFA) for domains of different sizes (Fig. 1). The domain size should be small enough to maximize spatial resolution but large enough to provide an accurate orientation of the fibers. At very small domain sizes, the average AR always approaches 1 regardless of the actual image due to poor frequency sampling. On the other hand, domains larger than typical lesion size sacrifice the spatial resolution with no benefit to the accuracy of the orientation. This is a direct consequence of the overall parallel alignment of the nerve fibers in the spinal cord and we thus choose to determine the optimal domain size of 192 pixels as shown in Fig. 1. Note that this is different for collagen in biological tissue in which there is no unique orientation over large areas [22].
Fig. 1.
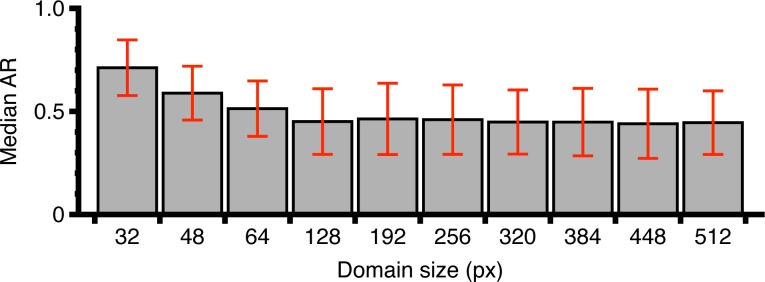
Median AR (with median absolute deviation) as a function of domain size. For small domain sizes, poor orientation accuracy is due to lack of data on fiber morphology. At large sizes, no additional accuracy is obtained on the orientation although spatial resolution is decreased. The optimal size was thus choosen to be 192 pixels.
To find the appropriate threshold level for the image segmentation, we assumed that: 1) the shape of the segmented object has to be as close as possible to an ellipse, and 2) the AR of the ellipse has to be as small as possible for an accurate estimation of the average fiber orientation. Every 2D-FT image was therefore segmented at various levels across its intensity range and for every threshold value, the ellipticity of the object and the AR of the equivalent ellipse were computed. The ellipticity is defined as [29]:
| (1) |
where I 1 is the simplest affine moment invariant of the circle [30] and can be written as:
| (2) |
I 1 is defined in terms of the central moments:
| (3) |
where x̄ and ȳ are the components of the image centroid and I(x, y) is the pixel intensity. Finally, the threshold value corresponding to the maximum ratio of the ellipticity and AR was used for the segmentation.
To demonstrate this strategy, we applied the analysis on 192×192 pixels domains for three different CARS images of mouse spinal cord surface (Fig. 2). From top to bottom in Fig. 2(a), the tissue becomes progressively afflicted by EAE lesions and the tissue organization suffers accordingly. Figure 2(b) shows the noise filtered and smoothed 2D-FT of the domains. In Fig. 2(c), superposed on the resulting segmented objects are the equivalent ellipses with lines highlighting the orientation of the minor and major axes. Finally, in Fig. 2(d), the average tissue orientation is drawn over the images with the color of the line representing the AR (see AR color code at the right of Fig. 2).
Fig. 2.
(a) Three different CARS images of mouse spinal cord surface in the longitudinal orientation. From top to bottom, the tissue becomes progressively afflicted by EAE lesions. (b) Processed 2D-FT of the domains. (c) Segmented objects with superposed equivalent ellipses and main axes. (d) Average fiber orientation overlaid on the images with AR color-coded (AR color code shown right).
2.7. Correlation parameter
The correlation parameter (CP) is a quantitative parameter evaluating the collinearity between the orientations of neighboring domains [22]. For two adjacent domains, the scalar product between the orientations of the (i, j) and (i + 1, j) domains can be expressed as S⃗i,j · S⃗ i+1,j. For domain angles θi,j and θ i+1,j, this expression becomes:
| (4) |
or, for unit vectors S⃗:
| (5) |
For simplicity, this expression can be transformed so that it varies from −1 for orthogonal domain orientations to +1 for perfectly parallel domain orientations of fibers for any two angles in the range ±90°. We call this value the collinearity between the domains i and i + 1:
| (6) |
Finally, the CP representing the collinearity of domain (i, j) with all four neighboring domains can be expressed as the average collinearity for all four neighbors:
| (7) |
or, more generally as:
| (8) |
where nb represents the four possible neighbors and the number of neighbors (Nnb) is introduced to ensure that CP stays in the range ±1. A CP value close to 0 implies a random orientation of domains with no correlation.
Moreover, the uncertainty in the fiber orientation was taken into account with a correction to the CP using the following expression:
| (9) |
where CCP is the corrected correlation parameter. When the fiber orientation is certain (low AR), this correction affects the CP only slightly. On the other hand, the usefulness of the correction is made apparent when the fiber orientation is uncertain (high AR) but correlated between neighbored domains (high CP). In this case, the CCP is lowered which gives a better indication of a lesion.
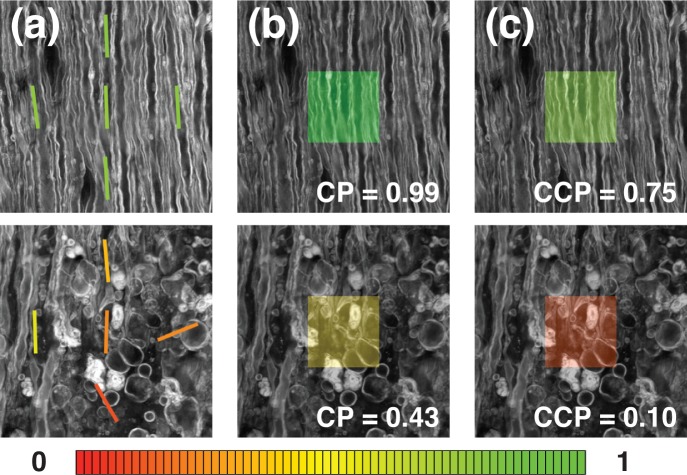
An example is presented in Fig. 3 where the CP and CCP were calculated on the central 192×192 pixels domain for two CARS images of mouse spinal cord in the longitudinal orientation. For all three panels, the top image shows healthy tissue and the bottom image shows tissue where the myelin structure is lost due to an advanced stage of EAE. In Fig. 3(a), the orientation and AR were calculated for the central domain as well as for its four neighboring domains. In Fig. 3(b) and 3(c) the CP and the CCP have been calculated for both images. For the image of healthy tissue (top example), the CCP is close to 1, implying good tissue organization. On the bottom image, the CCP is closer to 0 because the fiber orientation is uncertain and more random between the domains, which is indicative of a loss of organization in the tissue. The result is shown as a color overlay following the color code shown at the bottom of Fig. 3.
Fig. 3.
Two CARS images of healthy (top) and diseased (bottom) spinal cord. (a) The orientation and AR were calculated for square domains of 192×192 pixels. In (b) and (c), the calculated CP and CCP are shown on the bottom right corner as well as color-coded on the images (CP and CCP color code shown at the bottom).
3. Results and discussion
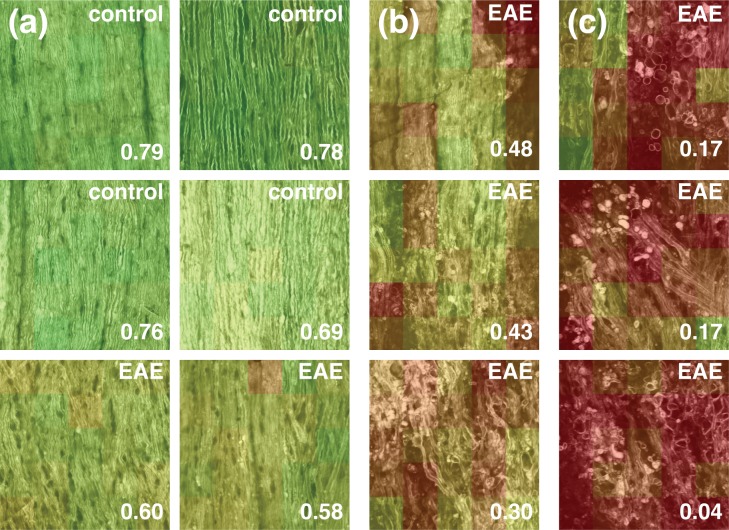
To validate the ability of the corrected correlation parameter (CCP) in discriminating different stages of myelin degeneration, images from four controls (i.e. injected with saline or CFA) and eight immunized mice were chosen and compared together. Those twelve images were representative of the various levels of surface tissue organization (healthy-appearing, moderate and severe disorganization) encountered in control and EAE animals. The 216×216 μm images were subdivided in 25 domains of 192×192 pixels and then characterized by their median CCP. Figure 4 shows the images with a color-coded CCP on each tile in decreasing order of their median CCP. In Fig. 4(a), all six images show healthy-appearing white matter and their CCPs are accordingly high (CCP > 0.5). Figure 4(b) shows three images typical of moderately disorganized tissue and Fig. 4(c) is showing three images with a more severe disorganization. As can be seen from panels b and c, the values of the median CCP confirm the visual assessment of the level of degeneration and indicate that the CCP can discriminate various lesion states as observed in the spinal cord of EAE animals. Thus, the CPP that we established represents an objective, local measurement of myelin health and is indicative of local disorganization and disruption.
Fig. 4.
The CCP was calculated for twelve images, each divided into 25 domains. The median CCP is shown. (a) Six images typical of healthy-appearing spinal cord tissue. (b) Three images showing a moderate degree of disorganization. (c) Three images showing a severe degree of disorganization.
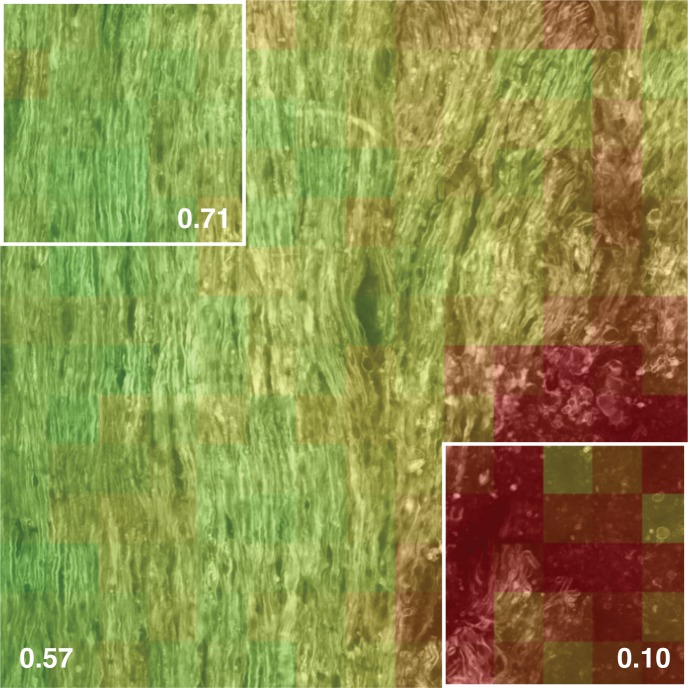
Note that over large areas of the spinal cord, the heterogeneous nature of EAE becomes apparent. For instance, in Fig. 5, a larger map of the spinal cord surface (600×600 μm) from a score 1 mouse shows that lesions appear locally throughout the spinal cord and that the level of tissue organization is highly heterogeneous. On the scale of this image, the median CCP is not sufficient to describe the tissue: the median CCP is 0.57, with the upper left area showing healthy-appearing white matter and a median CCP of 0.71, while the lower right corner shows a lesion where the tissue is severely disorganized and the median CCP is only 0.10. Hence, the CCP is only meaningful in small regions of interest whose dimensions are on the order of the expected lesion size. As we show in the next paragraph, the probability density function (PDF) of the CCP is a good descriptor for larger areas.
Fig. 5.
In this large map of spinal cord surface (600×600 μm), we can see that the lesions appear in patches. The difference between the median CCP of the whole image and that of the two subsections highlights the fact that the level of tissue disorganization is heterogeneous throughout the spinal cord.
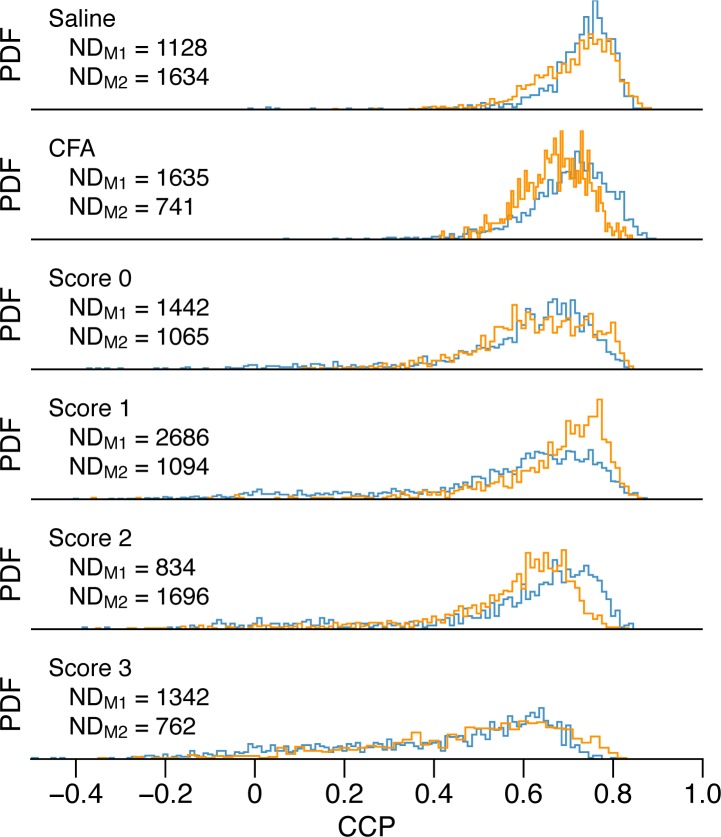
Whereas the EAE clinical score is a global functional measure of the motor skills of the animals, we have clearly demonstrated that the CCP is a local structural measure of the level of tissue organization within a myelinated area. This complex and novel analysis was applied to our complete image dataset covering about 30 mm2 of spinal cord surface from animals at different clinical scores, for a total of 16,000 square domains. The results are presented as the PDF of the CCP in Fig. 6. The two mice per condition are labeled M1 (blue line) and M2 (orange line) and the number of domains per mouse is indicated (NDM1, NDM2). As expected, samples from mice displaying high EAE clinical scores have accumulated a greater number of low CCP regions (lesions) and the severity of those lesions is higher (lower CCP values).
Fig. 6.
PDF of the CCP for all domains in maps for both control and EAE mice (two mice per condition, blue and orange lines). The number of domains per mouse (NDM1, NDM2) is indicated for all conditions.
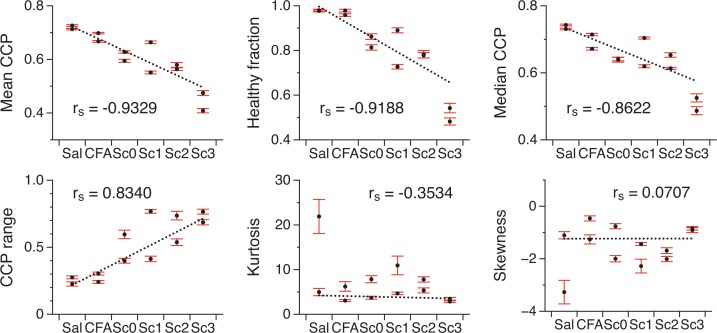
Although a certain amount of variability is apparent between mice of the same score, there is clearly a trend linking the shape of the PDF to the clinical scores. To substantiate this, we have calculated the Spearman correlation coefficients (rs) of six different descriptors of the PDF with the clinical scores. In Fig. 7, the descriptors are plotted against the different conditions in order of decreasing correlation coefficient: mean CCP (rs = −0.9329), healthy fraction (rs = −0.9188), median CCP (rs = −0.8622), middle 95% CCP range (rs = 0.8340) and PDF kurtosis and skewness (rs = −0.3534 and rs = 0.0707 respectively). The mean CCP and the healthy fraction show a strong correlation whereas the PDF kurtosis and skewness are not correlated with the clinical score. The healthy fraction is the ratio of the number of healthy domains to the total number of domains. Since 97% of the domains of the saline and CFA maps have a CCP value above 0.5, this was determined to be the threshold separating the two categories, healthy-appearing and disorganized tissue. For each parameter, we used the standard bootstrap method [31] to make sure that the spinal cord sampling was sufficient. The bootstrap percentile confidence interval at 95% was calculated using 10,000 bootstrap replications of the PDFs. The best line from a robust linear regression is also plotted to give a sense of the degree of correlation.
Fig. 7.
Different descriptors of the PDF are plotted against the clinical scores in order of decreasing correlation coefficient (rs). The bootstrap percentile confidence interval at 95% shows the sampling error. The line of best fit is plotted to emphasize the correlation.
The myelin disruption, although related to nerve function, is not a direct measurement of a nerve functional integrity. In fact, a more complete model relating myelin disruption to loss of nerve function would clearly consider the number, size and most importantly localization of the moderate to severe lesions throughout the entire spinal cord. The robust and automated technique developed here is a first step in that direction. In addition, because the CCP can be calculated in real time, this procedure is compatible with live animal imaging to provide in situ information to complement the structural measurements of the local myelin architecture. For example, it would be possible to screen large areas of the spinal cord, find areas of interest indicative of possible early lesions, and measure a more extensive set of functional parameters (blood-brain-barrier permeability, cellular recruitment, microglial activity, etc...). When coupled with a minimally invasive microendoscopic approach [32], it would be possible to follow the evolution of a given region of interest over time to understand the sequence of the interactions between all the key players.
4. Conclusion
In this article, we presented an approach to calculate the average orientation and the directional anisotropy within a myelin image domain. We also introduced a new quantitative parameter, the corrected correlation parameter (CCP), used to assess myelin health locally on images taken from the spinal cord of mice at different stages of a MS-like pathology. We have shown that the CCP can be used to quantify the degree of organization/disorganization in the myelin structure. We have also shown that in the EAE animal model of MS, the number of sites with a lower CCP increases as the disease progresses. The CCP could therefore be developed into a parameter for presymptomatic detection of myelin disruption. This metric will be combined with other measurements such as blood-brain-barrier permeability and cellular recruitment measurements to obtain a more complete picture of the disease at various stages of its development.
Acknowledgments
This work was supported by the Canadian Institute for Health Research Emerging Team grant ( RMF-111628) and the National Science and Engineering Research Council Discovery grant program. This investigation was supported in part by a Dr. William J. McIlroy studentship from the Multiple Sclerosis Society of Canada awarded to E. Bélanger.
References and links
- 1.Nave K.-A., “Myelination and the trophic support of long axons,” Nat. Rev. Neurosci. 11, 275–283 (2010) 10.1038/nrn2797 [DOI] [PubMed] [Google Scholar]
- 2.King I. L., Dickendesher T. L., Segal B. M., “Circulating Ly-6C+ myeloid precursors migrate to the CNS and play a pathogenic role during autoimmune demyelinating disease,” Blood 113, 3190–3197 (2009). [DOI] [PMC free article] [PubMed] [Google Scholar]
- 3.van der Valk P., Amor S., “Preactive lesions in multiple sclerosis,” Curr. Opin. Neurol. 22, 207–213 (2009) [DOI] [PubMed] [Google Scholar]
- 4.Filippi M., Rocca M. A., Barkhof F., Brück W., Chen J. T., Comi G., DeLuca G., De Stefano N., Erickson B. J., Evangelou N., Fazekas F., Geurts J. J. G., Lucchinetti C., Miller D. H., Pelletier D., Popescu B. F. G., Lassmann H., “Association between pathological and MRI findings in multiple sclerosis,” Lancet Neurol. 11, 349–360 (2012) 10.1016/S1474-4422(12)70003-0 [DOI] [PubMed] [Google Scholar]
- 5.Mix E., Meyer-Rienecker H., Hartung H.-P., Zettl U. K., “Animal models of multiple sclerosis–potentials and limitations,” Prog. Neurobiol. 92, 386–404 (2010) 10.1016/j.pneurobio.2010.06.005 [DOI] [PMC free article] [PubMed] [Google Scholar]
- 6.’t Hart B. A., Gran B., Weissert R., “EAE: imperfect but useful models of multiple sclerosis,” Trends Mol. Med. 17, 119–125 (2011) 10.1016/j.molmed.2010.11.006 [DOI] [PubMed] [Google Scholar]
- 7.Brown D. A., Sawchenko P. E., “Time course and distribution of inflammatory and neurodegenerative events suggest structural bases for the pathogenesis of experimental autoimmune encephalomyelitis,” J. Comp. Neurol. 502, 236–260 (2007) 10.1002/cne.21307 [DOI] [PubMed] [Google Scholar]
- 8.Evans C. L., Xie X. S., “Coherent anti-Stokes Raman scattering microscopy: chemical imaging for biology and medicine,” Annu. Rev. Anal. Chem. 1, 883–909 (2008) 10.1146/annurev.anchem.1.031207.112754 [DOI] [PubMed] [Google Scholar]
- 9.Bégin S., Bélanger E., Laffray S., Vallée R., Côté D., “In vivo optical monitoring of tissue pathologies and diseases with vibrational contrast,” J. Biophotonics 2, 632–642 (2009) 10.1002/jbio.200910071 [DOI] [PubMed] [Google Scholar]
- 10.Pezacki J. P., Blake J. A., Danielson D. C., Kennedy D. C., Lyn R. K., Singaravelu R., “Chemical contrast for imaging living systems: molecular vibrations drive CARS microscopy,” Nat. Chem. Biol. 7, 137–145 (2011) 10.1038/nchembio.525 [DOI] [PMC free article] [PubMed] [Google Scholar]
- 11.Wang H., Fu Y., Zickmund P., Shi R., Cheng J.-X., “Coherent anti-Stokes Raman scattering imaging of axonal myelin in live spinal tissues,” Biophys. J. 89, 581–591 (2005) 10.1529/biophysj.105.061911 [DOI] [PMC free article] [PubMed] [Google Scholar]
- 12.Fu Y., Wang H., Huff T. B., Shi R., Cheng J.-X., “Coherent anti-Stokes Raman scattering imaging of myelin degradation reveals a calcium-dependent pathway in lyso-PtdCho-induced demyelination,” J. Neurosci. Res. 85, 2870–2881 (2007) 10.1002/jnr.21403 [DOI] [PMC free article] [PubMed] [Google Scholar]
- 13.Imitola J., Côté D., Rasmussen S., Xie X. S., Liu Y., Chitnis T., Sidman R. L., Lin C. P., Khoury S. J., “Multimodal coherent anti-Stokes Raman scattering microscopy reveals microglia-associated myelin and axonal dysfunction in multiple sclerosis-like lesions in mice,” J. Biomed. Opt. 16, 021109 (2011). [DOI] [PMC free article] [PubMed] [Google Scholar]
- 14.Fu Y., Frederick T. J., Huff T. B., Goings G. E., Miller S. D., Cheng J.-X., “Paranodal myelin retraction in relapsing experimental autoimmune encephalomyelitis visualized by coherent anti-Stokes Raman scattering microscopy,” J. Biomed. Opt. 16, 106006 (2011). [DOI] [PMC free article] [PubMed] [Google Scholar]
- 15.Shi Y., Zhang D., Huff T. B., Wang X., Shi R., Xu X.-M., Cheng J.-X., “Longitudinal in vivo coherent anti-Stokes Raman scattering imaging of demyelination and remyelination in injured spinal cord,” J. Biomed. Opt. 16, 106012 (2011). [DOI] [PMC free article] [PubMed] [Google Scholar]
- 16.Freudiger C. W., Pfannl R., Orringer D. A., Saar B. G., Ji M., Zeng Q., Ottoboni L., Wei Y., Ying W., Waeber C., Sims J. R., De Jager P. L., Sagher O., Philbert M. A., Xu X., Kesari S., Xie X. S., Young G. S., “Multicolored stain-free histopathology with coherent Raman imaging,” Lab. Invest. 92, 1492–1502 (2012) 10.1038/labinvest.2012.109 [DOI] [PMC free article] [PubMed] [Google Scholar]
- 17.Bélanger E., Bégin S., Laffray S., De Koninck Y., Vallée R., Côté D., “Quantitative myelin imaging with coherent anti-Stokes Raman scattering microscopy: alleviating the excitation polarization dependence with circularly polarized laser beams,” Opt. Express 17, 18419–18432 (2009) 10.1364/OE.17.018419 [DOI] [PubMed] [Google Scholar]
- 18.Bélanger E., Henry F. P., Vallée R., Randolph M. A., Kochevar I. E., Winograd J. M., Lin C. P., Côté D., “In vivo evaluation of demyelination and remyelination in a nerve crush injury model,” Biomed. Opt. Express 2, 2698–2708 (2011). [DOI] [PMC free article] [PubMed] [Google Scholar]
- 19.Matteini P., Ratto F., Rossi F., Cicchi R., Stringari C., Kapsokalyvas D., Pavone F. S., Pini R., “Photothermally-induced disordered patterns of corneal collagen revealed by SHG imaging,” Opt. Express 17, 4868–4878 (2009) 10.1364/OE.17.004868 [DOI] [PubMed] [Google Scholar]
- 20.Rao R. A., Mehta M. R., Toussaint K. C., “Fourier transform-second-harmonic generation imaging of biological tissues,” Opt. Express 17, 14534–14542 (2009) 10.1364/OE.17.014534 [DOI] [PubMed] [Google Scholar]
- 21.Cicchi R., Vogler N., Kapsokalyvas D., Dietzek B., Popp J., Pavone F. S., “From molecular structure to tissue architecture: collagen organization probed by SHG microscopy,” J. Biophotonics 6, 129–142 (2013) 10.1002/jbio.201200092 [DOI] [PubMed] [Google Scholar]
- 22.Ghazaryan A., Tsai H. F., Hayrapetyan G., Chen W.-L., Chen Y.-F., Jeong M. Y., Kim C.-S., Chen S.-J., Dong C.-Y., “Analysis of collagen fiber domain organization by Fourier second harmonic generation microscopy,” J. Biomed. Opt. 18, 31105 (2013) 10.1117/1.JBO.18.3.031105 [DOI] [PubMed] [Google Scholar]
- 23.Veilleux I., Spencer J. A., Biss D. P., Côté D., Lin C. P., “In vivo cell tracking with video rate multimodality laser scanning microscopy,” IEEE J. Sel. Top. Quantum Electron. 14, 10–18 (2008) 10.1109/JSTQE.2007.912751 [DOI] [Google Scholar]
- 24.Duncan M. D., Reintjes J., Manuccia T. J., “Scanning coherent anti-Stokes Raman microscope,” Opt. Lett. 7, 350–352 (1982) 10.1364/OL.7.000350 [DOI] [PubMed] [Google Scholar]
- 25.Zumbusch A., Holtom G. R., Xie X. S., “Three-dimensional vibrational imaging by coherent anti-Stokes Raman scattering,” Phys. Rev. Lett. 82, 4142–4145 (1999) 10.1103/PhysRevLett.82.4142 [DOI] [Google Scholar]
- 26.Preibisch S., Saalfeld S., Tomancak P., “Globally optimal stitching of tiled 3D microscopic image acquisitions,” Bioinformatics 25, 1463–1465 (2009). [DOI] [PMC free article] [PubMed] [Google Scholar]
- 27.Lim J. S., Two-Dimensional Signal and Image Processing (Prentice Hall, Englewood Cliffs, 1990). [Google Scholar]
- 28.Savitzky A., Golay M. J., “Smoothing and differentiation of data by simplified least squares procedures,” Anal. Chem. 36, 1627–1639 (1964) 10.1021/ac60214a047 [DOI] [Google Scholar]
- 29.Rosin P. L., “Measuring shape: ellipticity, rectangularity, and triangularity,” Mach. Vis. Appl. 14, 172–184 (2003). [Google Scholar]
- 30.Flusser J., Suk T., “Pattern recognition by affine moment invariants,” Pattern Recogn. 26, 167–174 (1993) 10.1016/0031-3203(93)90098-H [DOI] [Google Scholar]
- 31.Efron B., Tibshirani R. J., An Introduction to the Bootstrap (Chapman & Hall, New York, 1993). [Google Scholar]
- 32.Bélanger E., Crépeau J., Laffray S., Vallée R., De Koninck Y., Côté D., “Live animal myelin histomorphometry of the spinal cord with video-rate multimodal nonlinear microendoscopy,” J. Biomed. Opt. 17, 021107 (2012) 10.1117/1.JBO.17.2.021107 [DOI] [PubMed] [Google Scholar]


