Abstract
Combining imaging and control of multiple micron-scaled objects in three dimensions opens up new experimental possibilities such as the fabrication of colloidal-based photonic devices, as well as high-throughput studies of single cell dynamics. Here we utilize the dual-objectives approach to combine 3D holographic optical tweezers with a spinning-disk confocal microscope. Our setup is capable of trapping multiple different objects in three dimensions with lateral and axial accuracy of 8 nm and 20 nm, and precision of 20 nm and 200 nm respectively, while imaging them in four different fluorescence channels. We demonstrate fabrication of ordered two-component and three dimensional colloidal arrays, as well as trapping of yeast cell arrays. We study the kinetics of the division of yeast cells within optical traps, and find that the timescale for division is not affected by trapping.
OCIS codes: (090.1760) Computer holography, (180.1790) Confocal microscopy, (140.7010) Laser trapping, (120.4610) Optical fabrication
1. Introduction
Three dimensional optical imaging has become a basic requirement for biological studies of the cell, as well as for self-assembly of micron scaled objects such as colloidal suspensions. The most common technique used to date for 3D imaging is confocal microscopy. Due to the long duration of biological processes it is highly desirable to be able to localize the observed cells while imaging, without affecting their biological function. To this end, confocal microcopy is combined with single and double optical traps routinely [1]. On a different front, holographic optical tweezers (HOTs) have been used to fabricate three dimensional colloidal arrays for potential use in photonic devices [2]. However, the imperative positional accuracy in the axial direction was never characterized. For these reasons several approaches to combine 3D imaging and multi-particle trapping were previously implemented. For instance, confocal microscopy has been combined with time sharing optical trapping [3], which is limited to 2D trapping. Adding a Pockels cell and polarizing beam splitters resulted in a setup allowing for simultaneous and independent 3D imaging and trapping, at least for a few axial trapping planes [4]. Here we propose a setup that improves on previous realizations due to the unique abilities of HOTs [5]. Namely, trapping can be done continuously in any axial position [2], accurate 3D positioning can be achieved applying adaptive optics [6], and specially crafted optical traps can be used to manipulate and trap challenging objects [7,8]. Consequently, this system is ideal for automated micro-fabrication of photonic devices, as well as for high-throughput studies of biological processes on the cell level.
A single laser beam brought to a tight focus by a high numerical aperture microscope objective lens constitutes an optical trap [9]. HOTs generalize this idea splitting a single laser beam, by means of a computer controlled diffractive optical element (DOE) [5], to form multiple optical traps [5,10,11] in the sample plane. Using a spatial light modulator as the DOE to split the beam by a phase-only hologram is especially beneficial since it utilizes most of the laser power for trapping. In addition, it enables more sophisticated beam shaping and allows for real-time corrections of aberrations in the optical train [6,12,13]. The position of the optical traps in a HOTs setup is determined by a computer controlled hologram which can encode positions of hundreds of traps in three dimensions, and change their location in a stepwise manner to manipulate trapped objects in three dimensions. When combined with a 3D imaging system, such as a confocal microscope the 3D positioning of objects can be characterized and corrected in real time. In the remainder of the article we will describe our combined HOTs-Confocal microscope setup, and characterize the accuracy and precision of our positioning both laterally and axially. In Sec. 4 we will give examples of experiments that are unique to our new setup: fabrication and 3D imaging of a 3D colloidal array, fabrication of a heterogeneous colloidal structure, and single cell division kinetics investigation of Saccharomyces Cerevisiae yeast cells.
2. Experimental
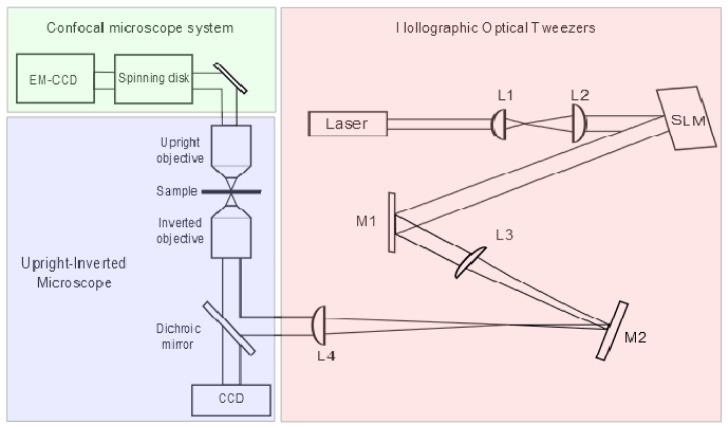
A schematic of our experimental setup is shown in Fig. 1 . We use an Olympus upright/inverted IX microscope to create a stable, well aligned two objectives setup. Through the bottom part of the microscope, which consists of a half of an inverted microscope we inset a HOTs setup driven by an Ytterbium doped fiber laser (Keopsys, KPS-KILAS-TRAPP-1083-20-PM-CO) with an emission wavelength of 1083nm and maximal power output of 20W. As is the common practice [6], the trapping laser beam is imprinted with a phase pattern generated by a liquid crystal spatial light modulator (SLM, Hamamatsu X10468-07). Optical traps are formed in the sample after being focused by a high numerical aperture objective lens (Olympus PlanApo, x60, NA = 1.42, oil immersion). Brightfield imaging is done by a CCD camera (Point Grey, Grasshopper) situated at the left port of the microscope, using transmitted illumination.
Fig. 1.
A schematic diagram of the experimental setup. Lenses L1 and L2 expand the beam diameter to overfill the SLM active area; lenses L3 and L4 reduce it to overfill the objective’s back aperture while conserving power. The inverted objective lens focuses the beam to create the optical trap array. The upright objective is used for confocal imaging.
The top part of our setup consists of a half upright microscope through which confocal imaging is done (Andor, Revolution XD). The spinning disc confocal microscope includes a Yokogawa (CSU-X1) spinning disc and an Andor (iXon 897) EM-CCD camera, with 512 × 512 pixel resolution and single photon sensitivity. Fluorescence excitation is available at λ = 405 nm, 488 nm, 561 nm, 640 nm. To acquire three-dimensional images, the objective lens (Olympus UPlanL N, x60, NA = 1.25, oil immersion) is mounted on a piezoelectric scanner (Physik Instrumente, Pifoc P-721.LLQ) and consecutive slices of the sample are recorded with 100 nm axial resolution.
Preparation of yeast culture
Colonies of Saccharomyces Cerevisiae expressing fluorescent proteins (spc42-YFP/htb2-mCherry, kind gift from Dr. Iftach Nachman) were cultured in YPD agarose media (Formedium YPD broth) at 30̊ C for at least 24 h. In order to reduce the effects of cell to cell variation, we ensure that a clonal population of cells is generated by growing sparse colonies each originating from a single mother cell. One colony was removed to a liquid YPD media and cultured for 24 h in a 120-140 RPM shaker-incubator at 30̊ C. This process allows optimal growth of free yeast cells suspended in solution. About 1 ml was taken out of the culture, pelleted by centrifugation and frozen with 30% glycerol at −80̊ C for long term storage (fresh colonies were grown in a similar manner for each experiment from the frozen stock).
Sample preparation
Two types of colloidal silica beads, 1.5 µm in diameter with fluorescence excitation/emission of λ = 485/510 nm and λ = 569/585 nm (Kisker Biotech, PSI-G1.5 and PSI-R1.5) were suspended in an aqueous solution and sandwiched between two coverslips. Samples, 24 mm × 50 mm × 25 µm in size, were sealed and placed in a home built sample holder providing mechanical stability. Yeast cell samples were prepared similarly, using Bovine serum albumin coated coverslips to prevent cells from sticking to the glass.
Hydrogel preparation and device fabrication
In order to fabricate 3D colloidal arrays we prepare colloidal dispersions in an aqueous solution of 180: 12: 1 (wt/wt) acrylamide (99%, Sigma), N,N-methylenebisacrylamide (99%, Alfa Aesar), and diethoxyacetophenone (98%, Alfa Aesar). Once particles are trapped in location, ultraviolet illumination is used to polymerize this solution into a transparent polyacrylamide hydrogel. When the gelation process is terminated, the trapping laser is turned off and the colloidal structures remain stable [2].
3. Characterization
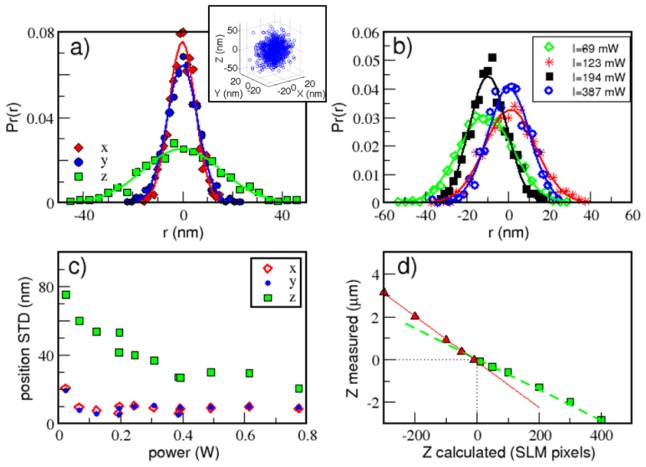
Using our novel setup as a micro-fabrication system requires accurate and precise control of particle positioning. We therefore conducted a series of characterization and calibration experiments to measure the system's accuracy and precision. In order to characterize the optical trapping quality we performed multiple confocal scans of two trapped silica particles at different laser powers. At each laser power we took 1000 z scans of the trapped particles, recalculating the trap generating hologram at each power. Using standard particle tracking algorithms [14,15], particle positions in three dimensions were extracted from the images (for the raw data, see inset in Fig. 2(a) ) as a function of time. Once the time series of the particle’s position in three dimensions is obtained, we proceed to calculate its positional probability distribution as plotted in Fig. 2(a). This information serves as the basis for our setup characterization. For instance, the standard deviation of the particle position distribution, along the x direction , is related to the trap stiffness via , where Boltzmann constant is , and Tthe absolute temperature. In order to assess the accuracy of particle positioning we calculated the standard deviation of the distance between the particles for each axis (Fig. 2). In Fig. 2(a) the probability distribution of the position of a single particle is depicted for the different axes, the lateral accuracy, is comparable to previously reported studies [16]. Due to stronger gradient forces in the lateral direction, positioning accuracy is approximately three times smaller in the axial direction. In Fig. 2(b) the probability distribution of inter-particle distance is plotted for different experiments in which the holograms were recalculated and laser power changed. By comparison, we find that traps are projected to the same location each time with precision of ~20 nm. In Fig. 2(c) the effect of laser power on trapping accuracy was measured. The standard deviation of particle position changes from to laterally and from to axially as the laser power at the trap decreases between 800 mW - 25 mW. These values correspond to trap stiffness of , in the lateral directions and, in the axial direction. In addition, we performed a z position calibration in which we trapped a single particle in z and moved it along the axial direction while grabbing a confocal scan at each position. Extracting the particles position as a function of the requested displacement allowed us to extract the ratio between the axial shift in SLM pixels and the actual particle shift (Fig. 2(d)). Interestingly, we find that this dependence is different below and above the focal plane of the inverted objective lens, changing form 7 nm/pixel above to 12 nm/pixel below.
Fig. 2.
Optical trapping characterization. a) Trapping accuracy: histogram of positions for a single trapped particle at 780 mW, inset shows the particle positions within the trap during the measurment. b) Trapping precision: histograms of lateral inter-particle distance for different hologram realizations and different laser powers. c) Trapping accuracy: standard deviation of particle position within a trap as function of power at the trap. d) Position calibration: Confocal measurement of relative Z position in microns verses the requested Z position in SLM pixels. Heights are measured relative to the focal plane of the undiffracted laser light. A different dependence is observed below and above the focal plane of the inverted objective lens, below the focal plane axial position changes as 12 nm/pixel and above it as 7 nm/pixel.
Accurate positioning of particles in three dimensions requires a calibration between programmed position and resulting position. This calibration is usually done prior to trapping using adaptive optics by imaging the optical traps as they reflect from a mirror [17]. This protocol works well for two dimensional trapping at a given axial displacement. However, the distance between traps scales with laser wavelength and with axial displacement. Moreover, spherical aberrations arising from light passing through media with different refractive indexes change the actual height of the optical traps. Theoretically [18], the actual lateral distance between traps should change linearly when shifted axially in a linear manner, since the magnification of an image depends linearly on its distance from the focal plane. We correct for all these effects to achieve accurate 3D positioning using adaptive optics. In practice, this is done by imaging the distance between two trapped particles as a function of their axial position, thus forming a calibration curve translating actual distance to the distance programmed into the generating hologram. This calibration curve is then used to calculate holograms in which lateral distances do not depend on the trap’s axial position. In this manner we achieve sub pixel accuracies of fewer than 100 nm (Fig. 3(b) ).
Fig. 3.
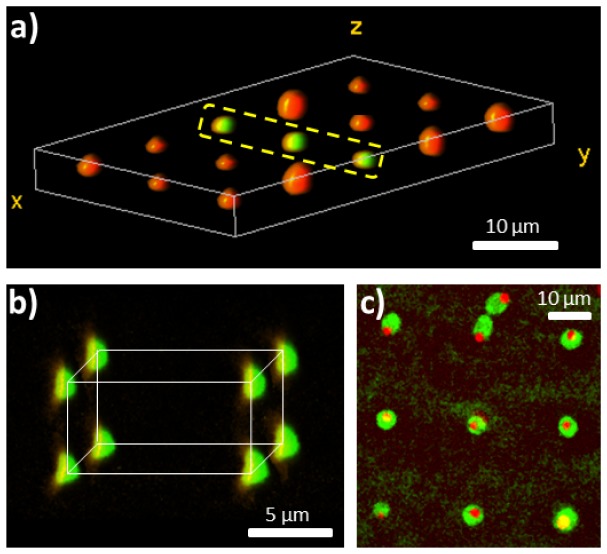
3D confocal images of trapped arrays. a) 5x3 array of Silica particles of two types: green fluorescing (in the center line), and red fluorescing (forming the outer rows). b) Volume rendering of a 2x2x2 array of trapped, green fluorescent, colloidal Silica particles, the particles are positioned within 100 nm of their desired position. c) S. Cerevisiae yeast cells trapped in a 3x3 array, the nuclei imaged in red and the cytoplasm in green. Each trapping site is comprised of two optical traps to ensure horizontal orientation of cells.
4. Applications
In the following section we will describe two unique applications for our combined HOTs-Confocal setup: simultaneous 3D imaging and trapping of various materials to produce free standing colloidal arrays, and fluorescence characterization of biological processes in localized cells.
In Fig. 3(a) 3D volume rendering of a trapped array of 5x3 two types of colloidal particles, suspended in acrylamide monomer solution, is depicted, the central column of which fluoresces in green while the rest fluoresce in red. Such heterostructures, comprising of optical gain materials, are sought after for all-optical photonic devices. 3D imaging of a 3D colloidal array combined with adaptive optics was used to demonstrate another required capability for photonic device fabrication; accurate 3D positioning (see Fig. 3(b)). The assembled structures were then gelled using ultraviolet illumination with no detectable change in particles’ position, similar to previous reports [2].
Trapping of non-spherical objects, such as yeast cells requires at least two optical traps per lattice site to control the orientation of the trapped object. In Fig. 3(c) we show a 3x3 array of S. Cerevisiae yeast cells which were trapped using nine pairs of optical traps and imaged in two fluorescence channels to observe the nuclei (red) and the cytoplasm (green). It is interesting to note that mother and daughter cells remain attached long after division has occurred. This is seen in Fig. 3(c), were two cells become trapped in a single array location.
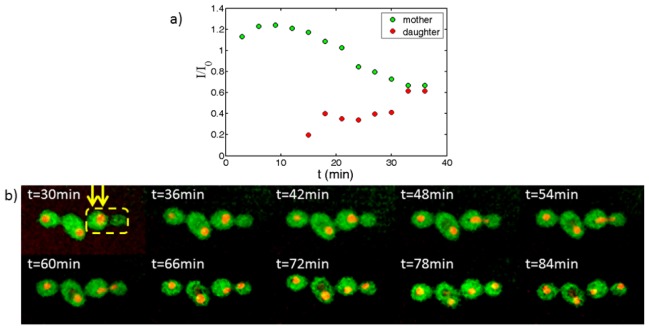
For biological applications it is imperative that monitored cells remain viable while localized by an optical trap. One indication of the cell’s wellbeing is that it continues to reproduce at regular rates within the trap. In Fig. 4 the kinetics of nuclear division in a budding cell is presented (see also Media 1 (16.8MB, AVI) ). A mother cell, already after budding, is trapped by two optical traps whose locations are indicated in yellow arrows in Fig. 4(b). The cell was monitored for approximately two hours not changing its location for the whole duration of the experiment. After 36 min, the cell nucleus started migrating towards the daughter cell. It started splitting after 48 min and continued thus for twenty minutes, in accord with previous studies [19]. Finally the two resulting nuclei drifted apart. We measured the integrated intensity of the nuclei of the mother and daughter cell starting from t = 30 min from a single confocal slice of the sample, normalizing both intensities by the integral intensity of the nucleus of the cell on the left side of the mother cell Fig. 4(a). Clearly during nuclear division the amount of dyed nuclear material decreases in the mother cell in correlation with its appearance in the daughter cell.
Fig. 4.
(a) Nuclear division kinetics of a budding yeast cell. Intensity of fluorescence from nuclei material is measured at a single confocal cross section and is normalized according to integrated intensity of an adjacent cell which remains unchanged and in focus the whole duration of the experiment. (b) Time lapse confocal imaging of a yeast cell dividing within two optical traps at 1085 nm (Media 1 (16.8MB, AVI) ). Both optical traps, are anchoring the mother cell during the budding and nuclear splitting process (yellow arrows indicate trap positions). The cell remained trapped for the duration of the experiment (approximately two hours).
5. Discussion
In this article we presented a new optical trapping setup; a combination of holographic optical tweezers and a confocal microscope, allowing simultaneous 3D imaging and manipulation. This novel combination allows us to harness adaptive optics to optimize positioning accuracy in three dimensions. We presented two example applications which can benefit from these novel capacities, namely, micro-fabrication of all optical photonic devices, and parallel molecular kinetics measurements in live cells, on the single cell level.
The method presented here to fabricate colloidal particle arrays can be utilized in the future to produce all-optical photonic devices, if two additional requirements are met. First connections to light sources and detectors are required, and second propagating beams in the lateral direction need to be confined in the axial direction as well. Fiber connections to external light sources and detectors can be placed during sample cell assembly, the colloidal array can then be assembled around the input and output fibers to ensure optimal coupling to the colloidal device. Axial confinement can be achieved by using Bragg mirror coverslips designed to reflect the wavelength of light propagating in the device (e.g. 1.55 µm), and to transmit the wavelength of the trapping laser (e.g. 1.085 µm).
The four florescence channels present in our setup, and the high sensitivity of our camera can be used to study correlations in the position of up to four different biological molecules within a localized cell during processes such as drug intake and division. Performing such experiments in parallel, on an array of trapped cells, will enable assessment of population diversity.
Acknowledgments
Y.R would like to thank William Irvine for discussions originating this line of work, and Iftach Nachman for the fluorescently labeled Saccharomyces Cerevisiae cells. This work was supported in part by the James Franck German-Israeli Binational Program in Laser-Matter interactions, in part by the Marie Curie Reintegration Grant (PIRG04-GA-2008- 239378), and in part by the Israel Science Foundation (Grant Number 1271/08).
References and links
- 1.Visscher K., Brakenhoff G. J., “Single beam optical trapping integrated in a confocal microscope for biological applications,” Cytometry 12(6), 486–491 (1991). 10.1002/cyto.990120604 [DOI] [PubMed] [Google Scholar]
- 2.Roichman Y., Grier D. G., “Holographic assembly of quasicrystalline photonic heterostructures,” Opt. Express 13(14), 5434–5439 (2005). 10.1364/OPEX.13.005434 [DOI] [PubMed] [Google Scholar]
- 3.Visscher K., Brakenhoff G. J., Krol J. J., “Micromanipulation by “multiple” optical traps created by a single fast scanning trap integrated with the bilateral confocal scanning laser microscope,” Cytometry 14(2), 105–114 (1993). 10.1002/cyto.990140202 [DOI] [PubMed] [Google Scholar]
- 4.Vossen D. L. J., van der Horst A., Dogterom M., van Blaaderen A., “Optical tweezers and confocal microscopy for simultaneous three-dimensional manipulation and imaging in concentrated colloidal dispersions,” Rev. Sci. Instrum. 75(9), 2960 (2004). 10.1063/1.1784559 [DOI] [Google Scholar]
- 5.Grier D. G., “A revolution in optical manipulation,” Nature 424(6950), 810–816 (2003). 10.1038/nature01935 [DOI] [PubMed] [Google Scholar]
- 6.Polin M., Ladavac K., Lee S. H., Roichman Y., Grier D. G., “Optimized holographic optical traps,” Opt. Express 13(15), 5831–5845 (2005). 10.1364/OPEX.13.005831 [DOI] [PubMed] [Google Scholar]
- 7.Peng F., Yao B., Yan S., Zhao W., Lei M., “Trapping of low-refractive-index particles with azimuthally polarized beam,” J. Opt. Soc. Am. B 26(12), 2242 (2009). 10.1364/JOSAB.26.002242 [DOI] [Google Scholar]
- 8.MacDonald M. P., Paterson L., Sibbett W., Dholakia K., Bryant P. E., “Trapping and manipulation of low-index particles in a two-dimensional interferometric optical trap,” Opt. Lett. 26(12), 863–865 (2001). 10.1364/OL.26.000863 [DOI] [PubMed] [Google Scholar]
- 9.Ashkin A., Dziedzic J. M., Yamane T., “Optical trapping and manipulation of single cells using infrared laser beams,” Nature 330(6150), 769–771 (1987). 10.1038/330769a0 [DOI] [PubMed] [Google Scholar]
- 10.McGloin D., Spalding G. C., Melville H., Sibbett W., Dholakia K., “Three-dimensional arrays of optical bottle beams,” Opt. Commun. 225(4-6), 215–222 (2003). 10.1016/j.optcom.2003.07.032 [DOI] [Google Scholar]
- 11.Simpson N. B., Allen L., Padgett M. J., “Optical tweezers and optical spanners with Laguerre-Gaussian modes,” J. Mod. Opt. 43(12), 2485–2491 (1996). 10.1080/09500349608230675 [DOI] [Google Scholar]
- 12.Roichman Y., Waldron A., Gardel E., Grier D. G., “Optical traps with geometric aberrations,” Appl. Opt. 45(15), 3425–3429 (2006). 10.1364/AO.45.003425 [DOI] [PubMed] [Google Scholar]
- 13.Bowman R. W., Wright A. J., Padgett M. J., “An SLM-based Shack–Hartmann wavefront sensor for aberration correction in optical tweezers,” J. Opt. 12(12), 124004 (2010). 10.1088/2040-8978/12/12/124004 [DOI] [Google Scholar]
- 14.Crocker J. C., Grier D. G., “Methods of digital video microscopy for colloidal studies,” J. Colloid Interface Sci. 179(1), 298–310 (1996). 10.1006/jcis.1996.0217 [DOI] [Google Scholar]
- 15.Gao Y., Kilfoil M. L., “Accurate detection and complete tracking of large populations of features in three dimensions,” Opt. Express 17(6), 4685–4704 (2009). 10.1364/OE.17.004685 [DOI] [PubMed] [Google Scholar]
- 16.Gibson G. M., Leach J., Keen S., Wright A. J., Padgett M. J., “Measuring the accuracy of particle position and force in optical tweezers using high-speed video microscopy,” Opt. Express 16(19), 14561–14570 (2008). 10.1364/OE.16.014561 [DOI] [PubMed] [Google Scholar]
- 17.Roichman Y., Cholis I., Grier D. G., “Volumetric imaging of holographic optical traps.,” Opt. Express 14(22), 10907–10912 (2006). 10.1364/OE.14.010907 [DOI] [PubMed] [Google Scholar]
- 18.J. W. Goodman, Introduction to Fourier Optics, 2nd ed. (McGraw-Hill, 1996). [Google Scholar]
- 19.Lord P. G., Wheals A. E., “Rate of cell cycle initiation of yeast cells when cell size is not a rate-determining factor,” J. Cell Sci. 59, 183–201 (1983). [DOI] [PubMed] [Google Scholar]


