Abstract
Abnormal changes in orientation of myofibers are associated with various cardiac diseases such as arrhythmia, irregular contraction, and cardiomyopathy. To extract fiber information, we present a method of quantifying fiber orientation and reconstructing three-dimensional tractography of myofibers using optical coherence tomography (OCT). A gradient based algorithm was developed to quantify fiber orientation in three dimensions and particle filtering technique was employed to track myofibers. Prior to image processing, three-dimensional image data set were acquired from all cardiac chambers and ventricular septum of swine hearts using OCT system without optical clearing. The algorithm was validated through rotation test and comparison with manual measurements. The experimental results demonstrate that we are able to visualize three-dimensional fiber tractography in myocardium tissues.
OCIS codes: (110.4500) Optical coherence tomography, (100.0100) Image processing, (170.6935) Tissue characterization
1. Introduction
An important structural feature of the heart that directly impacts the electrical conduction and mechanical contraction is the orientation of myofibers, diameter of which ranges from 10 µm to 20 µm [1] in normal human heart. The conduction of action potentials within cardiac tissue shows a direction-dependence. The structural anisotropy of the myocardium is correlated with the function, where the propagation of electrical wavefronts is about three times faster along the longitudinal axis than along the transverse axis of the myofiber [2]. Abnormal myofiber orientation or myofiber disarray can cause conduction abnormalities resulting in arrhythmia [3]. Furthermore, the myofiber orientation directly influences mechanical contraction where the fibers follow a left-handed helical path near the epicardium and right-handed helical path near the endocardium [4]. Therefore, changes in fiber orientation structure may result in abnormal mechanical contraction of heart, which is observed within patients who suffer from cardiomyopathy [5] or dilated hearts [6].
Due to the strong relationship between myofiber orientation and cardiovascular diseases, there have been numerous studies to investigate the relationships. Traditional studies included sectioning the myocardium and staining with histology. This provides high resolution imaging, but three-dimensional structure is lost and the procedure is labor intensive [7]. Because of this, there has been a shift towards the use of medical imaging modalities, which provide three-dimensional imaging to analyze the myofiber architecture of the heart. Diffusion tensor magnetic resonance imaging (DTMRI) has been developed to measure the fiber architecture in the brain [8, 9] and the heart [10–12]. Within DTMRI, the diffusion of water within the biological sample is measured. The principle direction of diffusion tensor is regarded as the myofiber direction. Another modality being explored for fiber orientation is ultrasound. Lee and colleagues [13] developed an echocardiography based shear wave imaging to map myocardial fiber structure.
Optical systems have also been utilized to capture fiber orientation in recent publications. To study embryonic growth in left ventricle, confocal microscopy was used to reconstruct myofiber images and computed local transmural myofiber angle distribution in [14]. Tsai et al. performed second harmonic generation microscopy of the collagen fibers in myocardium [15]. Polarized light imaging, which is formerly utilized to reconstruct three-dimensional fiber tract in brain [16], has been recently used to remodel fiber structure in heart [17] by means of measuring the birefringence of fibers.
Optical coherence tomography (OCT) is a nondestructive, noncontact image technique capable of providing three-dimensional images at micron level at high acquisition speeds [18]. OCT is able to provide detailed morphological information about myofibers within heart wall [19] through either catheter-based OCT system [20, 21] or benchtop OCT system [22]. Previous studies have measured fiber orientation within two dimensions in excised heart preparation after fixation and with the use of optical clearing to increase contrast [23, 24] or polarization sensitive optical coherence tomography (PSOCT) for measurement of optical axis orientation [25]. Furthermore, fiber orientation information from OCT images corresponded to conduction velocity measured with optical mapping [22] and used to characterize the specialized conduction system such as the sinoatrial nodes [26]. Since the action potential propagates in three-dimensional space, there is a need to specify the fiber orientation in three dimensions. However, the methods to extract three-dimensional information of myofibers are still elusive and a specific preparation time is required for optical clearing in current experiment set-up.
In this manuscript, we present an automated algorithm to quantify fiber orientation in three dimensions without the need for optical clearing. This was accomplished by implementing a particle filter based algorithm that reconstructs three-dimensional tractography. The assessment of proposed quantification and tractography algorithms are validated in myofibers with swine hearts.
2. Method and materials
2.1 Image protocol
Three-dimensional image sets were generated from healthy swine (n = 5) hearts ex vivo. Three swine hearts (Heart I to Heart III) were acquired through Columbia University’s tissue sharing program. Animals were fresh and each heart was removed at room temperature. Two other swine hearts (Heart IV and Heart V) were obtained from a local butcher. Samples were dissected from right atrium, left atrium, right ventricle, left ventricle, and ventricular septum respectively. After dissection, samples were immediately imaged on both the endocardial and epicardial sides.
TELESTO, a commercial spectral domain OCT system (Thorlabs GmbH, Germany), was used to image samples. It was an InGaAs based system centering at 1325 nm, with a bandwidth of 150 nm. The axial and lateral resolutions were 4.9 µm and 5.3 µm in water respectively. The maximum axial line rate was 92 kHz. In our experiment, each volume consists of 600 × 600 × 512 pixels, corresponding to a tissue volume of 4 mm × 4 mm × 1.88 mm. The volumetric scan was performed at 28 kHz. Four successively acquired OCT images were averaged.
2.2 Quantification of fiber orientation in three dimensions
It has been previously shown that the myofibers are approximately parallel to the endocardial and epicardial surface [27–30], with a variation of 4 ° to 7 ° [31–34]. To quantify the general trend of 3D orientation of myofibers, we determined the orientation within en face (X-Y plane) images and back projected the fiber with respect to the sample surface. The flowchart is shown in Fig. 1 , illustrating the framework of our automated method to determine fiber orientation in three dimensions. Specifically, the algorithm includes two components: 1) fiber orientation determination in en face plane and 2) surface plane detection and fitting.
Fig. 1.
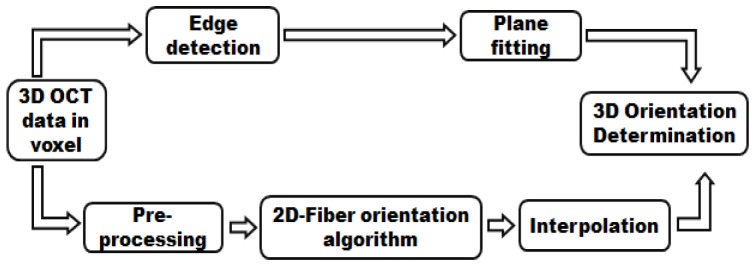
Flowchart of the automated algorithm for quantification of fiber orientation in three dimensions. Components of preprocessing, two dimensional fiber orientation algorithm and interpolation are used to quantify fiber orientation in en face plane. Edge detection block and plane fitting block are used to back project the fiber orientation from two dimensions to three dimensions.
In en face plane, we modified the intensity based gradient algorithm [23, 35] that was previously used to quantify fiber orientation in two dimensions. As the first step of pre-processing, a number of successive en face images at different depths were averaged to achieve higher image quality. The number of averaged images was determined by the depth resolution of OCT system and the diameter of myofibers. In our system design, the number was set to be four. To sharpen the image, a second order Butterworth high pass filter was convolved with the averaged en face OCT image. In addition, a median filter was used to reduce speckle noise. For each image pixel (i, j), the intensity gradients in the horizontal (Gx) and vertical (Gy) direction were calculated by convolving two 3 × 3 Sobel filters with en face OCT images. The magnitude of gradient G(i, j) and angle Φ(i, j) was calculated as:
| (1) |
| (2) |
Within a small sub-region W, the angle probability P(ω) (0° ≤ ω ≤ 179°) was:
| (3) |
where
| (4) |
This scheme assumed that the gradient in each pixel (i, j) in W follows a Von Mises distribution, analogous to a normal distribution, with mean of Φ(i, j) [35]. In W, the gradient of all pixels were considered and the weighted sum was computed in Eq. (4). The mean value of ω was regarded as estimation of dominant gradient in W. Note that the fiber orientation is perpendicular to gradient direction in en face plane. The estimated fiber orientation was determined by shifting the gradient direction by 90°. Since the fiber orientation in W is a summation of all local angles Φ(i, j), angle ω is supposed to follow normal distribution so that the mean of ω is an accurate estimation of fiber orientation. Within some sub-regions ω calculated from Eq. (3) were not normal distributed, which resulted in estimations in some sub-regions that were highly erroneous. To overcome this issue we developed a confidence metric to assess the reliability of the orientation estimation. The metric was defined as the probability where ω equals its mean value divided by standard deviation of ω. If the confidence value was below a threshold, the estimation of a sub-region was considered as unreliable. The fiber orientation in unreliable sub-region would be recalculated by the interpolation of the estimations in its reliable neighboring regions. If all neighboring regions were unreliable, we claimed that no fiber existed in the sub-region.
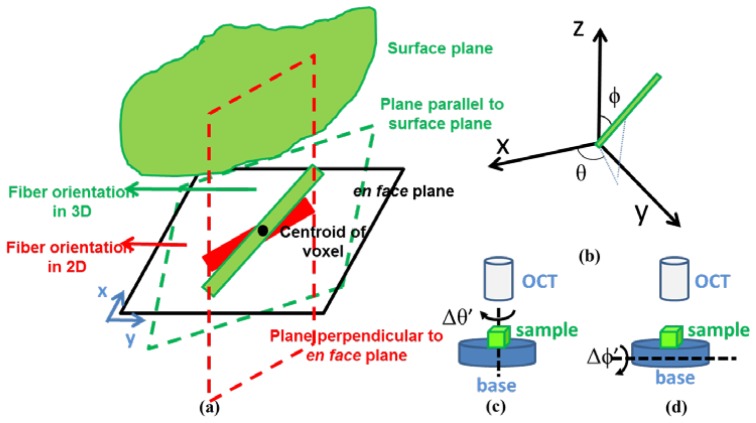
To obtain three-dimensional orientation, we projected the measured en face orientation with respect to the sample surface. To determine the angle of the surface plane we detected the edge in each Bscan (x-z plane) of OCT image by searching the maximum gradient point in a smooth-filtered image. For each voxel in three dimensions, we detected all edge points corresponding to the surface of the voxel. We further employed linear least square method to fit a plane through those edge points. The fitted surface plane was utilized to reconstruct fiber orientation from two dimensions to three dimensions. A schematic of the fiber orientation determination is plotted in Fig. 2(a) . We draw two planes (represented as planes with dash borders) through the centroid of voxel: one in parallel to the fitted surface plane and the other perpendicular to the en face plane with a projection in en face plane orientated in the direction of its estimated fiber orientation. The two planes intersected to produce a new line, which indicated the 3D fiber orientation. We quantify the estimated fiber orientation with polar angle ϕ and azimuth angle θ in a polar coordinate system, which are plotted in Fig. 2(b).
Fig. 2.
(a) Schematic of quantifying fiber orientation in three dimensions (green line). Two planes are produced: one is parallel to surface plane and the other is perpendicular to en face plane with a projection in en face plane as the red line. The intersection of the two planes is the fiber orientation in three dimensions. (b) Angles in three dimensions. The red line represents the fiber. Polar angle ϕ is the angle of fiber with respect to z axis. Azimuth angle θ is the angle of the projection of fiber in en face plane with respect to x axis. (c) Visualization of rotation experiment for azimuth angle. Sample is placed in a based under OCT system. The base rotates Δθ’ in en face plane and remains unchanged in polar angle. (d) Visualization of rotation experiment for polar angle. Sample is placed in a based under OCT system. The base rotates Δϕ’ in polar angle and the azimuth angle is kept unchanged.
We evaluated our 3D fiber orientation algorithm in swine hearts. Representative results are shown in Fig. 3 , where the results in each sub-region are at two depths and shown for the septum (Heart I), atrium (Heart II) and ventricle (Heart III). In this paper, the sub-region in Eq. (3) is a 0.3 mm × 0.3 mm × 0.03 mm volume, unless stated otherwise. The results were compared with the OCT image in en face plane and the surface plane. We found that the estimation of orientation agreed with the streamline in en face image of OCT data and was approximately parallel to surface. The orientation is color coded in unit vector and visualized in the RGB color space (R = |cosθ·cosϕ|, G = |cosθ·sinϕ|, B = |sinθ|).
Fig. 3.

Quantification of 3D fiber orientation from three swine hearts: (a) ventricular septum (Heart I); (b) left atrium (Heart II); (c) left ventricle (Heart III). Light gray shows endocardial surface. Two representative en face OCT images are shown, with 3D fiber orientation overlayed with orientation encoded in color.
2.3 Tractography of fibers in three dimensions
The problem of reconstructing tractography from an OCT image is to estimate the fiber trace. Here, we formulated the fiber tracking problem as state space model and utilized particle filter techniques [36] to reconstruct tractography [37]. The initial estimation of the fiber tracking step was based off of the fiber orientation results in Section 2.2. Thereafter, the myofibers were traced by the particle filtering step incorporating the intensity of OCT image. We generated clusters of particles to track possible fiber trace. The automated algorithm in Section 2.2 provided prior probability densities that characterized the properties of particle propagation. The observed OCT image was used to assess the reliability of each particle trace. In particular, the trace of myofiber can be modeled as a sequence of points in image space Z = {z0, z1, …, zn}. We assume that the propagation trace forms a Markov chain [38]. Let z0 as the anchor of a fiber. The progressive growing process of a fiber trace can be described as:
| (5) |
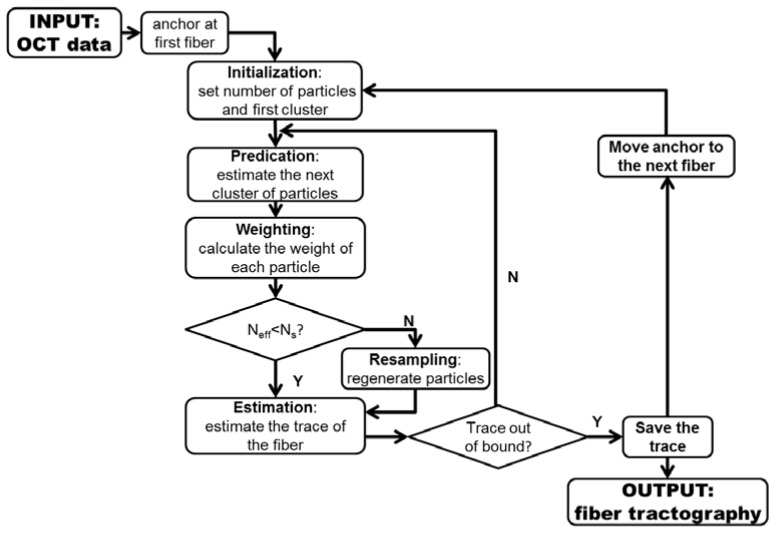
where ρ and are the step size and direction of propagation fiber at step n. The input of the algorithm is the OCT image Y. The output of the algorithm is the coordinates of fiber trace Z. Here, we use to determine the coordinate of zn. The schematic representing the data flow in the fiber tracking is shown in Fig. 4 .
Fig. 4.
Flow diagram of tractography using particle filter method. Sequential clusters of particles are generated, weighted in each iteration. The coordinates of particles in each cluster are weighted summed to estimate the trace of myofibers in OCT image. Neff is a metrics to evaluate whether most of particles are with low weights. Ns is a threshold to determine whether a resampling process is needed.
First we defined the number of particle M and an anchor z0. The principle of particle filtering is to sequentially sample M paths from the anchor z0. All particles propagated in the area of interest will be used to predicate the coordinates along the fiber trace. Given a set of particles at step k, the propagation of fiber trace to next step k + 1 was performed through following steps: predication, weighting, resampling (optional) and estimation.
In the predication step, the direction where the particle propagated was determined by the angle probability in the area where the estimation of previous step locates. The propagation model can be expressed as:
| (6) |
where P(ω)W is the probability in Eq. (4). It has been previously shown that myofibers are nearly parallel to epicardial and endocardial surfaces. Therefore, a variation of 4 ° was added to the mean of P(ω)W based on measurements of existing literature [31–34]. Angle ω was the direction that propagated. W denoted the sub-region where particle located. The orientation was generated based on the probability in Eq. (6). The coordinate of was then computed based on Eq. (5).
The weighting step gave a measurement of reliability for the propagation from to . Theoretically, the weights is determined by the weight of previous step and the probability of viewing the observation given the propagated direction [36]. The weight can be represented as:
| (7) |
| (8) |
whereis the observation in OCT image when particle propagated from to . It was defined as all pixel values (or voxel values in three dimensions) the trace to covered in OCT data set. If the fiber trace exactly covers, the standard deviation of all pixel (voxel) values in was very low and the predication is considered as being reliable. Therefore, we set the reciprocal of standard deviation of as an estimation of and calculate according to Eq. (7) and Eq. (8).
The resampling step was called when large numbers of particles had low weights, which means most of the particles are negligible. We measured metric, Neff, as following:
| (9) |
Neff is an estimation of the degeneracy highly related to the variance of weights [36]. Small Neff indicates high degeneracy. If Neff was smaller than a threshold Ns, we regenerated the low weighted particles based on the coordinates of particles, which were of higher weights.
The coordinates of the fiber at step k + 1 was estimated as the weighted center of M particles. The fiber trace propagated until it was out of the image boundary. The tractography scheme and results are presented in Fig. 5 at an en face plane within a right ventricle (Heart IV). Figure 5(a) shows the quantification results of fiber orientation computed by the method mentioned in Section 2.2. The estimated fiber orientations in the sub-region were used in prediction step. Figure 5(b) displays the propagation trace of one fiber, which starts at a blue anchor on the right lower corner of OCT image. The colored segments are the propagation trace for each particle at different steps. The white dots are the weighted center of the particle cluster at each step. The tractography of multiple fibers are shown in Fig. 5(c). Compared with the OCT image, we successfully reconstructs the fiber in the en face plane.
Fig. 5.
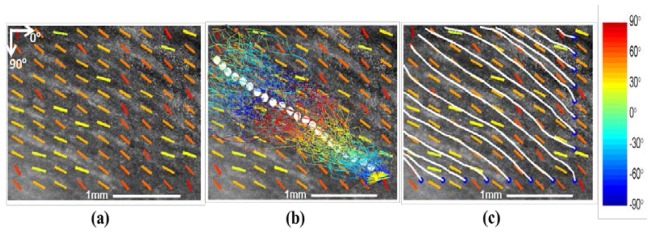
Fiber tracking in en face plane within a right ventricle (Heart IV). a) OCT image in en face plane, with orientation overlayed in coded color. b) Propagation of particles for tracking fiber trace. The fiber trace starts at an anchor denoted as blue dot. The colored lines show the traces how particles propagate from one step to another. The white dots are the estimated trace of fiber. c) Tractography results for multiple fibers. All fibers start at anchors located at the boundary of image. The white lines represent the fiber trace.
All algorithms in this paper were implemented using software package MATLAB 7.14.0.739 R2012a (The Mathworks, Natick, Massachusetts). The algorithms run in a Lenovo desktop with an Intel processor running at 3.40 GHz and 12 GB RAM memory.
3. Results
3.1 Rotation test
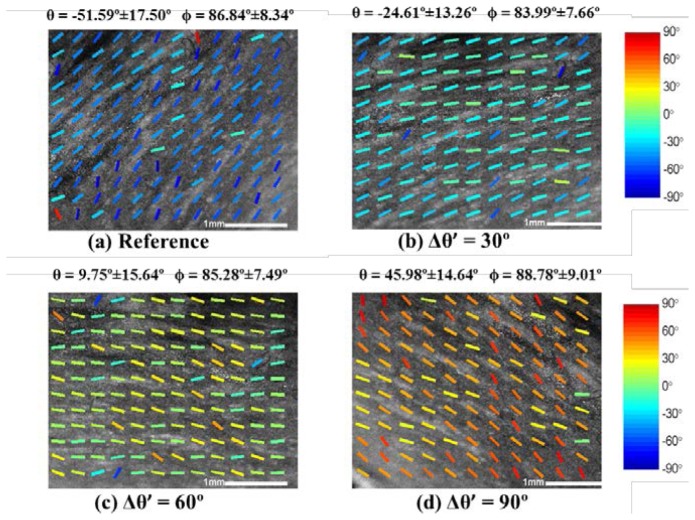
To validate our three-dimensional fiber orientation algorithm, we designed series of rotation tests. Representative results are shown from a data set acquired from the right ventricle of a swine heart (Heart IV). The experimental protocol was shown in Fig. 2(c), where we placed the sample on a base and rotated the base’s azimuth angle in the en face plane with polar angle unchanged. We imaged the sample in increments of 30° of rotation. We computed polar angle, ϕ, and azimuth angle, θ, using the three-dimensional fiber orientation algorithm and presented the results in Fig. 6 . The mean and standard deviation over all sub-regions are shown at the top of each OCT images. Comparing the mean of θ in Fig. 6(b), 6(c) 6(d) with the reference angle in Fig. 6(a), the measured Δθ’ were 26.98°, 61.34° and 97.59° respectively. The difference between reference angle and measured angle were within 15% of the reference change of angle. The experiment demonstrated that our algorithm was able to quantify the changes of angle at en face plane. Importantly, the measured Δϕ with respect to the reference were −2.85 °, −1.56 °, 1.94 °.
Fig. 6.
Fiber orientation results in the rotation experiment of azimuth angle as described in Fig. 2(c). The data was obtained from right ventricle of Heart IV. The reference OCT image and fiber orientations before rotation is shown in (a). During the rotation, we imaged and processed the image when the rotations are (b) 30° (c) 60° (d) 90°. The measured mean value and standard deviation of azimuth angle and polar angle are computed and displayed on the top of each image. The measured change on polar angle, Δϕ’, was within 5°. The change of azimuth angle, Δθ’, matches the rotation in our experiment with respect to reference angle.
Similarly, we successively rotated the polar angle with an increment of 7.50° on the same sample. The surface and OCT image are plotted in Fig. 7 for comparison. The change of polar angle was observed from both quantification results and surface plane. The mean and standard deviation over all sub-regions are also shown at the top of each OCT images. Comparing the mean of ϕ in Fig. 7(b), 7(c), 7(d) with the reference angle in Fig. 7(a), the measured Δϕ’ were 7.13°, 14.57° and 19.36° respectively. The difference between reference angle and measured angle were also within 15% of the reference change of angle. In addition, the Δθ’ with respect to the reference was 0.04 °, 8.84 °, 0.67 °. This experiment showed that our edge detection and curve fitting methods are feasible among different change of polar angles.
Fig. 7.
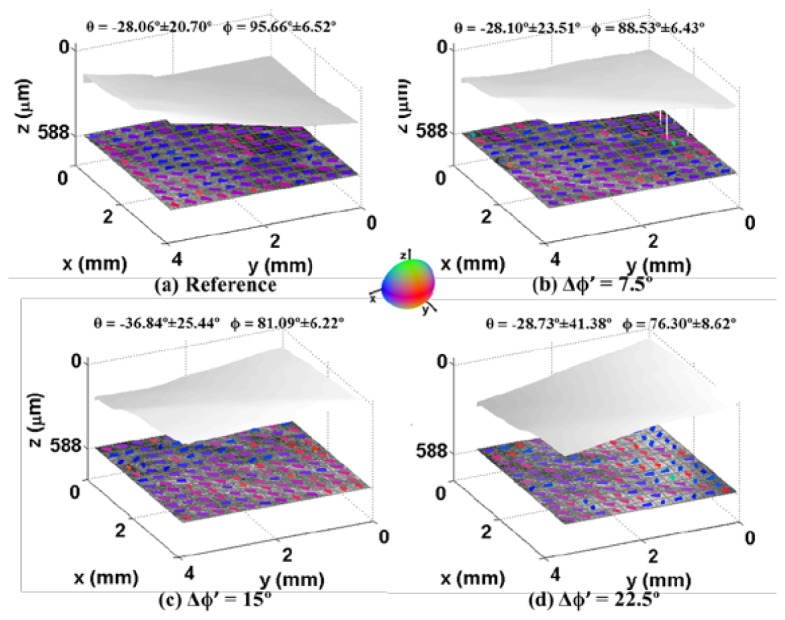
Fiber orientation results in the rotation experiment of polar angle as described in Fig. 2(d). The data was obtained from right ventricle of Heart IV. The reference OCT image and fiber orientations before rotation are shown in (a). During the rotation, we imaged and processed the image when the rotations are (b) 30° (c) 60° (d) 90°. The measured mean value and standard deviation of azimuth angle and polar angle are computed and displayed on the top of each image. Light gray shows endocardial surface. The azimuth angle, Δθ’, remains changes little. The change of polar angle, Δϕ’, matches the rotation in our experiment with respect to reference angle.
A summary of the rotational experiments for five samples of each experiment is shown in Table 1 . The samples are from five swine hearts (Heart I to Heart V). The mean value of the change of angle agrees with reference angle within 1.5 ° in both azimuth and polar angle rotation test. We found that the mean and standard deviation of Δϕ’ in azimuth angle rotation is larger than that of Δθ’ in polar angle rotation test though the reference change of angles are both 0 °. The reason is that amount of light back reflected into the system’s objective is reduced when the surface is tilted, resulting in OCT images with decreased image quality. The image processing results thereby degrades. We found that root-mean-square (RMS) of pixels dropped from 21.45 in Fig. 7(a) to 18.39 in Fig. 7(d), which indicated a decreased contrast.
Table 1. Statistic results of rotation experiments. The polar angle and azimuth angle rotation experiments are described in Fig. 2(c) and Fig. 2(d), respectively. Both polar angle and azimuth angle are measured in each experiment setup. The measurements of change of angle are listed as mean ± standard deviation calculated from Heart I to Heart V.
| Reference (°) | Measurements (°) | # of samples | ||||||
|---|---|---|---|---|---|---|---|---|
| Azimuth Angle Rotation | Δθ’ | 90 | 89.14 ± 7.11 | 5 | ||||
| Δϕ’ | 0 | 1.76 ± 1.35 | 5 | |||||
| Polar Angle Rotation | Δθ’ | 0 | 4.96 ± 4.02 | 5 | ||||
| Δϕ’ | 15 | 13.99 ± 3.01 | 5 | |||||
3.2 Depth vs orientation
We sampled a volume over an area of 1 mm × 1mm on epicardial side (atrial samples) or endocardial (ventricular samples) side and processed our automated algorithm. We set the depth where we firstly screen clear fiber streamline as reference depth (depth = 0 µm). Due to the different structure of samples and image quality in various data set, the reference depth used in this section can be 0.2166 mm to 0.5508 mm under the surface. The depth was increased in an increment of 25 µm. The measured mean value of azimuth angle, θ, were recorded and linearly fitted at each depth. We found that the relationship between depth and azimuth angle are well linearly fitted with an R2 of 0.7778 within the range of 0 to 500 µm in left ventricle and 0.7748 in left atrium within the range of 0 to 300 µm in a representative heart, Heart II. However, the linear relationship diminishes with increasing depth due to a decrease in image contrast in depth. We compared a range of 300um and 500um within the atrium and ventricle to a range of 1000um in both chambers to assess an appropriate range for evaluating orientation versus depth. We found that the R2 of linear fitting model was dramatically reduced at a range of 1000um in atrium and ventricle. Such limitation exists in all chambers. There are two reasons for this limitation. First, the quality of OCT image degrades when depth increases. The image became darker and shadowing might appear at some depth. Second, it may not be myocardial tissue when depth goes deeper. Besides, we found the validate range is related to thickness of wall. In the following experiments, we present the orientation results from depth of 0 to 300 µm in atrium and 0 to 500 µm in ventricle and ventricular septum.
Table 2. R Square values at increased depth range in atrium and ventricle of Heart II.
| Left Atrium | Left Ventricle | ||
|---|---|---|---|
| Depth range (mµ) | R square | Depth range(mµ) | R square |
| 0 to 300 | 0.7748 | 0 to 500 | 0.7778 |
| 0 to 1000 | 0.2160 | 0 to 1000 | 0.4154 |
To validate the method quantitatively, an investigator blinded to the results of algorithm manually measured the fiber orientation on the same area and depth. We compared azimuth angle, θ, from automated algorithm and manual measurement. The comparison is plotted in Fig. 8 . The two linearly fitted models matched very well with slops around 1 and R square values larger than 0.7500.
Fig. 8.
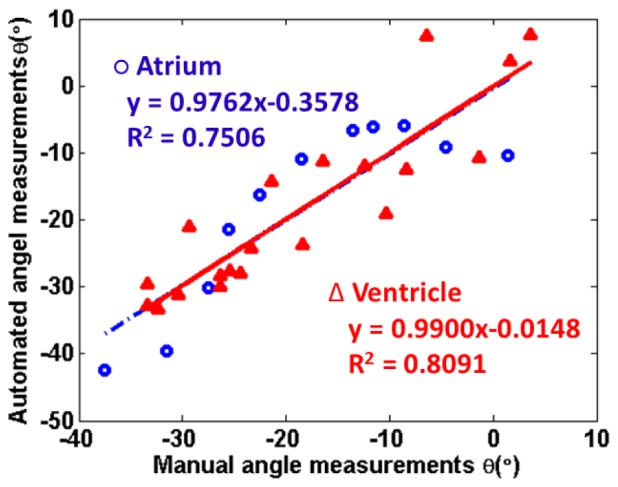
Comparison of manual fiber orientation measurements of azimuth angle, θ, vs computed θ based on automated algorithm. The samples are from left atrium (blue circle) and left ventricle (red triangle) of Heart II over an area of 1mm × 1mm area at an increased depth. The depth was increased from epicardial side to endocardial side in an increment of 25 µm. The results from automated algorithm match the manual measurements.
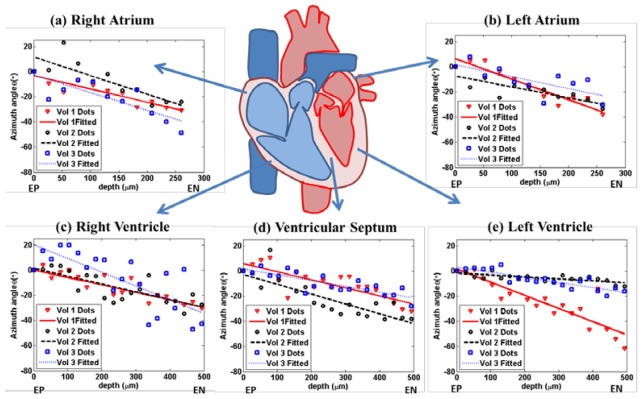
We studied the relationship in all heart chambers and septum. Three volumes were imaged in each chamber and ventricular septum from three swine (Heart I to Heart III). To compare the rate at which the azimuth angle, θ, changes with depth, we set the azimuth angle, θ, at reference depth as 0 ° and plot the relative angle at the increased depth in Fig. 9 .The measurements were linearly fitted with an R2 ranging from 0.5105 to 0.8876, demonstrating a nearly linear relationship between depth and orientation within all samples. The slopes of the orientation versus depth varied in different part of heart. We perform ANOVA test on the slopes in all chambers and ventricular septum, finding that the atrium has a statistically higher slope than the ventricle with a p-value of 0.0026. Even in the same chamber, the slopes may vary. For example, in Fig. 9(e), the slopes in Vol 1and Vol 3 are quite different and both of them were much smaller than the slopes in atrium.
Fig. 9.
Fiber orientation as a function of depth. Three volumes of OCT image data were acquired and processed for each chambers from Heart I to Heart III. The relationship is linearly fitted by least square method. The fiber orientations are quantified in each en face plane. The mean of orientation over an area of 1 mm × 1mm is plotted at different depth from epicardial side. The experiments in different chambers: (a) right atrium, (b) left atrium, (c) right ventricle, (d) ventricular septum and (e) left ventricle. The fiber orientation changes monotonically with depth. “EP” denotes epicardium. “EN” denotes endocardium.
3.3 Tractography in three dimensions
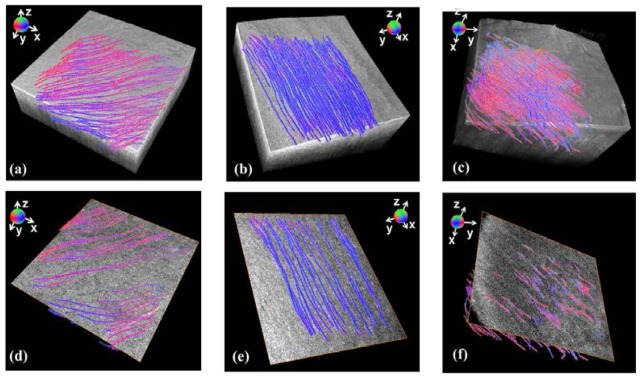
We performed fiber tractography algorithm in three-dimensional space from the data set obtained in the ventricular septum, ventricle, and atrium of three swine hearts (Heart I to Heart III). The seeds were randomly generated on the boundary of the area of interest. In each volume, the orientation of the myofiber was color encoded in three dimensions. Three representative results are presented in Fig. 10(a) to 10(c) in comparison to the original OCT image volume. We found most of the fibers aligned at the same orientation. Meanwhile, the orientation slightly changed along each single fiber trace. In the left atrium, which is shown in Fig. 10(b), apparent orientation change was observed with increased depth. We compared the tractography results with en face image in Fig. 10(d) to 10(f). The reconstructed fibers are crossing the en face plane, which indicates that the fibers intersected with en face plane in a manner shown in Fig. 2(a). Additionally, we found that our reconstructed fiber trace matched the streamline in OCT image in all three data set. From all six figures, we conclude that the tractography results show the fiber structure in three dimensions. The fiber tracking algorithm runs less than 7 minutes per volume in Fig. 10.
Fig. 10.
The tractography of myofibers in three dimensions. Our quantification and tractography algorithms enable the reconstruction of fiber structure in myocardium tissues. Results are compared with OCT image in (a) ventricular septum of Heart I (Media 1 (3.3MB, MP4) ) (b) left atrium of Heart II (Media 2 (3MB, MP4) ) (c) left ventricle of Heart III (Media 3 (2.3MB, MP4) ) in a volume of 2 mm × 2mm × 1mm underneath the surface. The fiber structures are also shown along with fiber OCT image in en face plane. The reconstructed fibers match the streamline in original OCT data in (d) ventricular septum (Media 4 (2.5MB, MP4) ) (e) left atrium (Media 5 (2MB, MP4) ) (f) left ventricle (Media 6 (1.6MB, MP4) ).
To evaluate the results of the fiber tracts in three dimensional spaces, we calculated the angle between the surface plane and fiber tract within the three data set shown in Fig. 10. The measurements in ventricular septum, left atrium and left ventricle are 2.21 ± 1.48 °, 2.25 ± 0.89 °, 2.94 ± 2.06 ° (mean ± standard deviation), respectively. The results show that the fiber tracts computed by the algorithm are nearly parallel to surface.
4. Discussion
In this paper, we presented a gradient-based algorithm to quantify the orientation of myofibers in three dimensions. The rotation test and comparison with manual measurements demonstrate a high accuracy of our method. On the basis of the algorithm, we were able to confirm the relationship between fiber orientation and depth. Furthermore, particle filter technique was utilized to map the tractography of the myofibers. The streamlines of fibers were visualized within myocardium tissues.
To evaluate the accuracy and sensitivity of our algorithm, we calculated the variation between computed change of angle and actual change of angle among all results. The measured variation of our algorithm is within 9 ° in azimuth angle and within 4° in polar angle. It is known that the change of azimuth angle between diastole and systole can be an average of 14 ° to 17° [7, 39, 40] in parts of ventricle. Therefore, accuracy of our algorithm is sufficient to reliably monitor changes in myofiber orientation during the cardiac cycle.
Considering the swine hearts are from different source, we investigated the image data from fresh and purchased heart. The attenuation coefficients in purchased heart are higher than fresh heart. Generally, the images collected from fresh heart have higher intensity and stronger contrast. However, we did not observe significant differences in the slope, change in fiber orientation with depth, between the two subgroups
Our method and experimental design demonstrate great potential for in vivo tractography of myofibers. First, our method can reconstruct the fiber tractography on fresh tissue. In existing work, an optical clearing that usually takes up to 24 hours to prepare tissue has to be performed [23,24] to enhance the image contrast. Second, our method has the sensitivity to capture change of angle. The rotation test indicates that our method is capable of accurate quantification of change in either polar angle or azimuth angle. Given the fact that the heart is dynamically beating during in vivo experiment, our method sheds light on achieving dynamic and real-time monitor of heart beating.
One limitation in our method is that the performance may degrade when depth increases to more than 1mm. However, such limitation does not affect the role that our method plays in most of applications. For small animals, like mouse, the thickness of ventricle is much less than 1 mm [41]. Furthermore, for clinical translation of performing an optical biopsy, standard endomyocardial biopsies of the ventricle sample 1mm cubed volumes [42], similar to the field of view of an OCT volume. In addition, we can screen the majority of myocardium in swine atria. Figure 11 presents a typical OCT image that was acquired from a volume of atrium. The minimum thickness of atrial wall can be around 0.5 mm, which is within the scan depth of our OCT system. Another limitation is that the heart is not in motion and we image the myocardium statically in our experiment. When imaging a beating heart, there will be a need to develop motion compensation algorithms. In the future we will optimize the algorithm to run in near real time.
Fig. 11.

Microstructure of the atria. (a-c) Representative three-dimensional data set of left atrium: (a) X-Y plane showing myofiber organization; (b) X-Z plane; (c) Y-Z plane. Imaging is possible through the entire atrial wall, where the smallest wall thickness is 0.5mm.
Among various imaging modalities that are currently used to extract fiber orientation, OCT based method is promising from many aspects. The data acquisition time is shorter in OCT than that in DTMRI. Moreover, the OCT system is able to provide a more morphological detailed than DTMRI system and ultrasound-based system due to its high resolution. In addition, our method can be adapted with existing PSOCT systems [25]. Currently, we identify the myofibers based on the gradient information. We foresee that the birefringence and optical axis orientation measured in PSOCT can be additional weighting factors to be used in our particle filtering algorithm to track fibers.
In the future, we will extend our algorithm to analyze in vivo imaging of the myocardium using catheter-based OCT system [43]. It has been previously demonstrated that in vivo imaging of the myocardium is possible with a catheter once it is in contact with the tissue wall, displacing the blood [44]. Moreover, gating algorithms [45] will be utilized to reconstruct dynamic images of myofibers throughout the cardiac cycle. It is recently reported that 3D images can be reconstructed through forward image OCT catheter using MEMS [46]. We envision that our method can be applied to catheter-based OCT three-dimensional images of myocardium tissues. The three-dimensional fiber information can help to diagnose the disarray of myofibers and identify myocardial infarction. Moreover, it is also possible to utilize our method to applications such as monitoring collagen fibers for wound healing [18], tracking white matter for brain disease [37], and assessing the muscular dystrophy [47]. Identifying fiber tractography in three dimensions will promote the development of these applications.
5. Conclusion
We have demonstrated the feasibility of extracting the fiber orientation and reconstructing three-dimensional tractography of myofibers using OCT. We propose and develop a gradient based algorithm to quantify fiber orientation in three dimensions and utilize particle filtering to track myofibers. We show that, without any optical clearing, we can visualize fiber tractography in myocardium tissues in all cardiac chambers and ventricular septum. Our method paves a way for further in vivo experiment and may help to improve diagnosis and monitor clinical outcomes of cardiovascular disease.
Acknowledgment
The authors will like to thank Akachi Ukwu for her technical assistance. The research was funded in part by the National Institute of Health and National Heart, Blood and Lung Institute Clinical Loan Repayment Program (CPF) and Columbia University’s provost grant program for junior faculty who contribute to the diversity goals of the university (CPF).
References and links
- 1.Armstrong A. T., Binkley P. F., Baker P. B., Myerowitz P. D., Leier C. V., “Quantitative investigation of cardiomyocyte hypertrophy and myocardial fibrosis over 6 years after cardiac transplantation,” J. Am. Coll. Cardiol. 32(3), 704–710 (1998). 10.1016/S0735-1097(98)00296-4 [DOI] [PubMed] [Google Scholar]
- 2.M. Shenasa, G. Hindricks, M. Borggrefe, G. Breithardt, M. E. Josephson, and D. P. Zipe, Cardiac Mapping (Wiley, 2012). [Google Scholar]
- 3.Kléber A. G., Rudy Y., “Basic Mechanisms of Cardiac Impulse Propagation and Associated Arrhythmias,” Physiol. Rev. 84(2), 431–488 (2004). 10.1152/physrev.00025.2003 [DOI] [PubMed] [Google Scholar]
- 4.Pluijmert M., Kroon W., Rossi A. C., Bovendeerd P. H. M., Delhaas T., “Why SIT Works: Normal Function Despite Typical Myofiber Pattern in Situs Inversus Totalis (SIT) Hearts Derived by Shear-Induced Myofiber Reorientation,” PLOS Comput. Biol. 8(7), e1002611 (2012). 10.1371/journal.pcbi.1002611 [DOI] [PMC free article] [PubMed] [Google Scholar]
- 5.M. D. Eggen, C. M. Swingen, and P. A. Iaizzo, “Analysis of fiber orientation in normal and failing human hearts using diffusion tensor MRI,” in ISBI '09., 2009), 642–645. [Google Scholar]
- 6.Tseng W.-Y. I., Dou J., Reese T. G., Wedeen V. J., “Imaging myocardial fiber disarray and intramural strain hypokinesis in hypertrophic cardiomyopathy with MRI,” J. Magn. Reson. Imaging 23(1), 1–8 (2006). 10.1002/jmri.20473 [DOI] [PubMed] [Google Scholar]
- 7.Streeter D. D. J., Jr, Spotnitz H. M., Patel D. P., Ross J. J., Jr, Sonnenblick E. H., “Fiber orientation in the canine left ventricle during diastole and systole,” Circ. Res. 24(3), 339–347 (1969). 10.1161/01.RES.24.3.339 [DOI] [PubMed] [Google Scholar]
- 8.Leergaard T. B., White N. S., de Crespigny A., Bolstad I., D’Arceuil H., Bjaalie J. G., Dale A. M., “Quantitative Histological Validation of Diffusion MRI Fiber Orientation Distributions in the Rat Brain,” PLoS ONE 5(1), e8595 (2010). 10.1371/journal.pone.0008595 [DOI] [PMC free article] [PubMed] [Google Scholar]
- 9.Basser P. J., Pajevic S., Pierpaoli C., Duda J., Aldroubi A., “In vivo fiber tractography using DT-MRI data,” Magn. Reson. Med. 44(4), 625–632 (2000). [DOI] [PubMed] [Google Scholar]
- 10.Wu M.-T., Tseng W.-Y. I., Su M.-Y. M., Liu C.-P., Chiou K.-R., Wedeen V. J., Reese T. G., Yang C.-F., “Diffusion Tensor Magnetic Resonance Imaging Mapping the Fiber Architecture Remodeling in Human Myocardium After Infarction: Correlation With Viability and Wall Motion,” Circulation 114(10), 1036–1045 (2006). 10.1161/CIRCULATIONAHA.105.545863 [DOI] [PubMed] [Google Scholar]
- 11.Sosnovik D. E., Wang R., Dai G., Reese T. G., Wedeen V. J., “Diffusion MR tractography of the heart,” J. Cardiovasc. Magn. Reson. 11(1), 47 (2009). 10.1186/1532-429X-11-47 [DOI] [PMC free article] [PubMed] [Google Scholar]
- 12.Helm P., Beg M. F., Miller M. I., Winslow R. L., “Measuring and Mapping Cardiac Fiber and Laminar Architecture Using Diffusion Tensor Mr Imaging,” Ann. N. Y. Acad. Sci. 1047(1), 296–307 (2005). 10.1196/annals.1341.026 [DOI] [PubMed] [Google Scholar]
- 13.Lee W. N., Pernot M., Couade M., Messas E., Bruneval P., Bel A., Hagège A. A., Fink M., Tanter M., “Mapping Myocardial Fiber Orientation Using Echocardiography-Based Shear Wave Imaging,” IEEE Trans. Med. Imaging 31(3), 554–562 (2012). 10.1109/TMI.2011.2172690 [DOI] [PubMed] [Google Scholar]
- 14.Tobita K., Garrison J. B., Liu L. J., Tinney J. P., Keller B. B., “Three-dimensional myofiber architecture of the embryonic left ventricle during normal development and altered mechanical loads,” Anat. Rec. A Discov. Mol. Cell. Evol. Biol. 283A(1), 193–201 (2005). 10.1002/ar.a.20133 [DOI] [PubMed] [Google Scholar]
- 15.Tsai M.-R., Chiu Y.-W., Lo M. T., Sun C.-K., “Second-harmonic generation imaging of collagen fibers in myocardium for atrial fibrillation diagnosis,” J. Biomed. Opt. 15(2), 026002 (2010). 10.1117/1.3365943 [DOI] [PubMed] [Google Scholar]
- 16.M. Axer., D. Grassel., M. Kleiner., J. Dammers., T. Dickscheid., J. Reckfort., T. Hutz., B. Eiben., U. Pietrzyk., K. Zilles., and K. Amunts., “High-Resolution Fiber Tact Reconstruction in the Human Brain by Means of Three-Dimensional Polarized Light Imaging,” Neuroinform 5(2011). [DOI] [PMC free article] [PubMed]
- 17.P. Desrosiers, G. Michalowicz, P.-S. Jouk, Y. Usson, and Y. Zhu, “Modeling of the Optical Behavior of Myocardial Fibers in Polarized Light Imaging,” in Statistical Atlases and Computational Models of the Heart. Imaging and Modelling Challenges, O. Camara, T. Mansi, M. Pop, K. Rhode, M. Sermesant, and A. Young, eds. (Springer Berlin Heidelberg, 2013), pp. 235–244. [Google Scholar]
- 18.W. Drexler and J. G. Fujimoto, Optical Coherence Tomography: Technology and Applications (Springer-Verlag Berlin Heidelberg, 2008). [Google Scholar]
- 19.Ambrosi C. M., Moazami N., Rollins A. M., Efimov I. R., “Virtual histology of the human heart using optical coherence tomography,” J. Biomed. Opt. 14(5), 054002 (2009). 10.1117/1.3213604 [DOI] [PMC free article] [PubMed] [Google Scholar]
- 20.Fleming C. P., Quan K. J., Rollins A. M., “Toward guidance of epicardial cardiac radiofrequency ablation therapy using optical coherence tomography,” J. Biomed. Opt. 15(4), 041510 (2010). 10.1117/1.3449569 [DOI] [PMC free article] [PubMed] [Google Scholar]
- 21.Fleming C. P., Quan K. J., Wang H., Amit G., Rollins A. M., “In vitro characterization of cardiac radiofrequency ablation lesions using optical coherence tomography,” Opt. Express 18(3), 3079–3092 (2010). 10.1364/OE.18.003079 [DOI] [PubMed] [Google Scholar]
- 22.Hucker W. J., Ripplinger C. M., Fleming C. P., Fedorov V. V., Rollins A. M., Efimov I. R., “Bimodal biophotonic imaging of the structure-function relationship in cardiac tissue,” J. Biomed. Opt. 13(5), 054012 (2008). 10.1117/1.2975826 [DOI] [PMC free article] [PubMed] [Google Scholar]
- 23.Fleming C. P., Ripplinger C. M., Webb B., Efimov I. R., Rollins A. M., “Quantification of cardiac fiber orientation using optical coherence tomography,” J. Biomed. Opt. 13(3), 030505 (2008). 10.1117/1.2937470 [DOI] [PMC free article] [PubMed] [Google Scholar]
- 24.Goergen C. J., Radhakrishnan H., Sakadžić S., Mandeville E. T., Lo E. H., Sosnovik D. E., Srinivasan V. J., “Optical coherence tractography using intrinsic contrast,” Opt. Lett. 37(18), 3882–3884 (2012). 10.1364/OL.37.003882 [DOI] [PMC free article] [PubMed] [Google Scholar]
- 25.Fan C., Yao G., “Imaging myocardial fiber orientation using polarization sensitive optical coherence tomography,” Biomed. Opt. Express 4(3), 460–465 (2013). 10.1364/BOE.4.000460 [DOI] [PMC free article] [PubMed] [Google Scholar]
- 26.Ambrosi C. M., Fedorov V. V., Schuessler R. B., Rollins A. M., Efimov I. R., “Quantification of fiber orientation in the canine atrial pacemaker complex using optical coherence tomography,” J. Biomed. Opt. 17(7), 071309 (2012). 10.1117/1.JBO.17.7.071309 [DOI] [PMC free article] [PubMed] [Google Scholar]
- 27.Streeter D. D., Jr, Spotnitz H. M., Patel D. P., Ross J., Jr, Sonnenblick E. H., “Fiber orientation in the canine left ventricle during diastole and systole,” Circ. Res. 24(3), 339–347 (1969). 10.1161/01.RES.24.3.339 [DOI] [PubMed] [Google Scholar]
- 28.N. Sperelakis, Y. Kurachi, A. Terzic, and M. V. Cohen, Heart Physiology and Pathophysiology (Elsevier Science, 2000). [Google Scholar]
- 29.Hunter P. J., Nielsen P. M., Smaill B. H., LeGrice I. J., Hunter I. W., “An anatomical heart model with applications to myocardial activation and ventricular mechanics,” Crit. Rev. Biomed. Eng. 20(5-6), 403–426 (1992). [PubMed] [Google Scholar]
- 30.Pope A. J., Sands G. B., Smaill B. H., LeGrice I. J., “Three-dimensional transmural organization of perimysial collagen in the heart,” Am. J. Physiol. Heart Circ. Physiol. 295(3), H1243–H1252 (2008). 10.1152/ajpheart.00484.2008 [DOI] [PMC free article] [PubMed] [Google Scholar]
- 31.Scollan D. F., Holmes A., Zhang J., Winslow R. L., “Reconstruction of Cardiac Ventricular Geometry and Fiber Orientation Using Magnetic Resonance Imaging,” Ann. Biomed. Eng. 28(8), 934–944 (2000). 10.1114/1.1312188 [DOI] [PMC free article] [PubMed] [Google Scholar]
- 32.D. Streeter, “Gross Morphology and Fiber Geometry of the Heart,” in Handbook of Physiology: The Cardiovascular System, B. Bethesda, ed. (American Physiology Society, 1979), pp. 61–112. [Google Scholar]
- 33.D. U. J. Keller, Multiscale Modeling of the Ventricles: From Cellular Electrophysiology to Body Surface Electrocardiograms (KIT Scientific Publishing, 2011). [Google Scholar]
- 34.G. Seemann, D. U. J. Keller, D. L. Weiss, and O. Dossel, “Modeling human ventricular geometry and fiber orientation based on diffusion tensor MRI,” in Com. Card,2006, 2006), 801–804. [Google Scholar]
- 35.Karlon W. J., Covell J. W., McCulloch A. D., Hunter J. J., Omens J. H., “Automated measurement of myofiber disarray in transgenic mice with ventricular expression of ras,” Anat. Rec. 252(4), 612–625 (1998). [DOI] [PubMed] [Google Scholar]
- 36.Arulampalam M., Maskell S., Gordon N., Clapp T., “A tutorial on particle filters for online nonlinear/non-Gaussian Bayesian tracking,” IEEE, Trans. Sig. Pro 50(2), 174–188 (2002). 10.1109/78.978374 [DOI] [Google Scholar]
- 37.Zhang F., Hancock E. R., Goodlett C., Gerig G., “Probabilistic white matter fiber tracking using particle filtering and von Mises-Fisher sampling,” Med. Image Anal. 13(1), 5–18 (2009). 10.1016/j.media.2008.05.001 [DOI] [PMC free article] [PubMed] [Google Scholar]
- 38.S. Meyn and R. L. Tweedie, Markov Chains and Stochastic Stability (Cambridge University Press, 2009), p. 622. [Google Scholar]
- 39.W. Yin and E. X. Wu, “MR investigation of the coupling between myocardial fiber architecture and cardiac contraction,” in EMBC 2009, 2009), 4395–4398. [DOI] [PubMed] [Google Scholar]
- 40.Mekkaoui C., Nielles-Vallespin S., Gatehouse P., Jackowski M., Firmin D., Sosnovik D., “Diffusion MRI tractography of the human heart In Vivo at end-diastole and end-systole,” J. Cardiovasc. Magn. Reson. 14(Suppl 1), O49 (2012). 10.1186/1532-429X-14-S1-O49 [DOI] [Google Scholar]
- 41.Doevendans P. A., Daemen M. J., de Muinck E. D., Smits J. F., “Cardiovascular phenotyping in mice,” Cardiovasc. Res. 39(1), 34–49 (1998). 10.1016/S0008-6363(98)00073-X [DOI] [PubMed] [Google Scholar]
- 42.Konno S., Sakakibara S., “ENdo-myocardial biopsy,” Dis. Chest 44(4), 345–350 (1963). 10.1378/chest.44.4.345 [DOI] [PubMed] [Google Scholar]
- 43.Wang H., Kang W., Carrigan T., Bishop A., Rosenthal N., Arruda M., Rollins A. M., “In vivo intracardiac optical coherence tomography imaging through percutaneous access: toward image-guided radio-frequency ablation,” J. Biomed. Opt. 16(11), 110505 (2011). 10.1117/1.3656966 [DOI] [PMC free article] [PubMed] [Google Scholar]
- 44.Fleming C. P., Rosenthal N., Rollins A. M., Arruda M., “First in vivo Real-Time Imaging of Endocardial RF Ablation by Optical Coherence Tomography ” J. In. Card. R. M 2(2011). [Google Scholar]
- 45.Gargesha M., Jenkins M. W., Wilson D. L., Rollins A. M., “High temporal resolution OCT using image-based retrospective gating,” Opt. Express 17(13), 10786–10799 (2009). 10.1364/OE.17.010786 [DOI] [PMC free article] [PubMed] [Google Scholar]
- 46.Park H.-C., Song C., Kang M., Jeong Y., Jeong K.-H., “Forward imaging OCT endoscopic catheter based on MEMS lens scanning,” Opt. Lett. 37(13), 2673–2675 (2012). 10.1364/OL.37.002673 [DOI] [PubMed] [Google Scholar]
- 47.Klyen B. R., Shavlakadze T., Radley-Crabb H. G., Grounds M. D., Sampson D. D., “Identification of muscle necrosis in the mdx mouse model of Duchenne muscular dystrophy using three-dimensional optical coherence tomography,” J. Biomed. Opt. 16(7), 076013 (2011). 10.1117/1.3598842 [DOI] [PubMed] [Google Scholar]


