

Abstract
Protein microarrays, or multiplexed and high-throughput assays, monitor multiple protein binding events to facilitate the understanding of disease progression and cell physiology. Fluorescence imaging is a popular method to detect proteins captured by immobilized probes with high sensitivity and specificity. Reliability of fluorescence assays depends on achieving minimal inter- and intra-assay probe immobilization variation, an ongoing challenge for protein microarrays. Therefore, it is desirable to establish a label-free method to quantify the probe density prior to target incubation to calibrate the fluorescence readout. Previously, a silicon oxide on silicon chip design was introduced to enhance the fluorescence signal and enable interferometric imaging to self-calibrate the signal with the immobilized probe density. In this paper, an integrated interferometric reflectance imaging sensor and wide-field fluorescence instrument is introduced for sensitive and calibrated microarray measurements. This platform is able to analyze a 2.5 mm × 3.4 mm area, or 200 spots (100 μm diameter with 200 μm pitch), in a single field-of-view.
INTRODUCTION
Binding interactions between biomolecules are the foundation of cellular and molecular biology. Knowing the presence, absence, or relative amount of an analyte within a biological system aids in understanding disease progression and cell physiology. Microarrays provide concurrent monitoring of multiple analytes within a sample to illustrate the profoundly complex and intricate relationship amongst biological proteins, cells, and tissues.1, 2, 3, 4 However, protein microarrays have been slow to receive Food and Drug Administration approval due to the need for rigorous quality control and quality assurance procedures.5, 6, 7 The performance of a microarray can be affected by the array geometry, probe density, spot morphology, background signal, probe specificity, and detection sensitivity.8, 9 Through careful design of the array layout, surface chemistry, antibody selection, and the detection modality, most of these sources of variation are controlled.10, 11, 12 Probe immobilization, however, inherently fluctuates because of the complex and delicate relationship between the protein physiology and the environment. Therefore, detection techniques that rely upon a reproducible probe immobilization, such as fluorescence imaging, are susceptible to variability.
Improving and characterizing protein immobilization are vital for a low coefficient of variation. Sophisticated labeled and label-free methods have been developed to evaluate the spot morphology. Labeled techniques have investigated the co-spotting of various length DNA probes with secondary fluorophores to determine the slide quality.9, 13, 14, 15 For proteins, labeling the probe directly may alter the functionality, and co-spotting will require extensive design to prevent cross-reactivity and reduction in probe density.5 To circumvent issues with labeled detection, a label-free photonic crystal biosensor has been developed to visualize DNA microarrays on a structured glass slide for quality ranking.11 However, this method is restricted to DNA microarrays and has not been demonstrated for protein microarrays. Moreover, a label-free method, capable of not only measuring spot morphology (a qualitative metric) but also probe density, is a more quantitative measure of microarray quality.12
A label-free, high-throughput, and multiplexed interference-based technique called the interferometric reflectance imaging sensor (IRIS) is capable of noninvasively quantifying the biomass immobilization on the surface. Utilizing optical interference and a silicon oxide on silicon (SiO2/Si) slide, IRIS has shown multiplexed, high-throughput, high sensitivity, and dynamic detection capabilities for molecular surface binding.16, 17 Additionally, the layered structure required for IRIS does not have a detrimental effect on the fluorescence readout, and the structure can be adjusted to enhance the fluorescence signal beyond glass slides.
A multi-spectral approach coupled with modeling is preferred over a single wavelength measurement because of dynamic range and linear sensitivity. The dynamic range of single wavelength monitoring is limited due to ambiguity in the reflectance curve. Additional restriction to the operable dynamic range is imposed by the nonlinear slope of the reflectance curve. As the measured wavelength shifts on the reflectance curve, the conversion factor between reflectivity shift and oxide growth alters.18 These issues place tight constraints on the substrate fabrication. Requiring higher fabrication accuracy than standard practice will increase costs and limit the application.
The IRIS technique is able to operate linearly over a larger dynamic range by sequentially acquiring images under multiple LED illumination then mapping the multi-spectral data for each pixel to the corresponding SiO2 thickness via a nonlinear fitting algorithm, see Fig. 1. This larger dynamic range relaxes fabrication requirements for the standard thickness variation from vendors to be applicable. This method of monitoring protein binding can quantify the bound density with pg/mm2 accuracy and precision.19
Figure 1.

Summary of the IRIS technique. (a) A schematic of the IRIS platform. LEDs illuminate the sample surface in a reflection mode setup. The surface reflection is imaged to a camera through a 4-f system. (b) Each pixel is recording the spectral intensity information of the surface. The intensity is modulated according to the reflectance corresponding to the SiO2 thickness. (c) Plotting a line profile across a cropped fitted image shows the SiO2 profile of several different proteins.
Detection using a second antibody offers higher sensitivity and specificity than label-free detection of analytes. Label-free methods lack an additional step to isolate specific binding from non-specific binding. Therefore, we recently reported a dual label-free and labeled method, called calibrated fluorescence enhancement (CaFE), and a slide design to correct for inter- and intra-assay probe immobilization variation by calibrating the fluorescence response with respect to surface-bound probe density.20
This initial work utilizes an IRIS instrument to measure the probe immobilization and a separate fluorescence reader to measure the captured target immobilization. If these instruments can be integrated, the labor and instrumentation costs associated with this method of calibration will be reduced. For example, cell phones have evolved beyond their original function by combining the camera, GPS, calendar, and computer. We embrace a similar system integration approach and integrate the IRIS and fluorescence platforms in a stand-alone microarray calibration instrument. This work will present the hardware/software design and characterization of the combined apparatus. Ultimately, this work can lead to a modular attachment for commercial fluorescence imagers to allow self-calibration of microarrays without additional instrumentation.
INSTRUMENT DESIGN
The calibrated fluorescence reader merges the IRIS and fluorescence imaging modalities. The IRIS modality precisely determines the surface-bound probe density for repeatable slide calibration. The slide design, illumination source selection, and the numerical aperture (NA) of the system, all factor into the IRIS sensitivity. In parallel, the fluorescence imaging modality determines the limit-of-detection of the minimal measurable target concentration of the combined instrument. For fluorescence imaging, the strength of the signal is directly related to the intensity of the excitation wavelength at the fluorophore, the optical efficiency of both the illumination and imaging path, and the level of background noise on the detector. These design considerations for an optimized calibrated fluorescence reader as well as the custom slides are discussed in Secs. 2A, 2B, 2C.
Slide design
Traditionally, glass slides are the solid support for fluorescence assays. These slides are readily available, compatible with a wide array of surface chemistries, and do not auto-fluoresce. However, fluorophores emit photons in an omnidirectional profile and preferentially into the high refractive index glass slide, resulting in significant loss of emitted fluorescence photons through the backside. Previous studies show that utilizing a layered substrate, e.g., SiO2/Si, can redirect the emission profile back to the detector for fluorescence enhancement.21, 22SiO2/Si substrates are a standard in the semiconductor industry and the wide availability, well-established processing protocols, and smooth SiO2 surface make them a promising alternative to glass slides. The glass top-layer facilitates the use of well-established surface chemistries.23, 24, 25 In addition, the layered design produces an interference signal to enable IRIS measurements16, 17 and shows fluorescence enhancement factors beyond available glass substrates.26 Cretich and Reddington et al. demonstrate an approach to assay development through the implementation of a 2 thickness SiO2/Si slide, which is optimized for both IRIS (500 nm SiO2) and fluorescence enhancement (100 nm SiO2) in a single experiment.27 Monroe et al. further investigate the application of dual thickness design for on-slide calibration (ONC) and introduce a single thickness SiO2 layer (324 nm) for co-located calibration (CLC).20
High NA interferometric reflectance imaging sensor
The sensitivity of both IRIS and wide-field fluorescence imaging drives the overall system performance. On the one hand, the fluorescence signal strength depends upon a narrowband excitation source and the optical efficiency of the system; therefore, a high NA is desired for sensitive measurements. On the other hand, the IRIS technique is designed to perform with multiple illumination sources and a low NA objective for simplistic modeling of the surface.
Initially, the IRIS method used an unpolarized, tunable laser to sweep over a 20 nm range at 1 nm increments while illuminating a 17 μm thick SiO2 layer.16 A more simplistic system with four unpolarized discrete LEDs, to circumvent imaging issues associated with wide-field laser imaging like speckle, has shown to achieve the same sensitivity with a 500 nm SiO2 layer and on-chip fiducial marks for intensity monitoring.17, 28 The modeling for the tunable laser can be described by the Fresnel reflection of a two-interface system when assuming a near-normal (paraxial approximation), single-wavelength illumination:29
| (1) |
| (2) |
| (3) |
| (4) |
where k is the optical wavenumber in the SiO2, d is the thickness of the SiO2 layer, r12 and r23 are the Fresnel reflection coefficients, and n1, n2, and n3 are the complex indices of refraction of the air, SiO2, and Si, respectively. With the incorporation of LEDs, the model must be improved to incorporate the bandwidth of the sources:
| (5) |
where f is the weight for the LED bandwidths. A fluorescence reader desires a high NA for fluorescence sensitivity. Therefore, the case where the NA is not small and invalidates the near-normal approximation requires the implementation of the angular spectrum representation (ASR):
| (6) |
where v is the weight for each collected angle, and Rs and Rp are the s- and p-polarization reflectance, respectively. In this case, the Fresnel coefficients and the wavenumber are defined as
| (7) |
| (8) |
| (9) |
| (10) |
| (11) |
where θ1, θ2, and θ3 are the propagation angles in air, SiO2, and Si, respectively.
To determine the regime where the paraxial approximation no longer applies, Monte Carlo simulations are conducted to estimate the IRIS error as a function of NA. These simulations progress as follows. The reflectivity of a SiO2/Si substrate for a given NA and LED spectral profile is generated for 2 SiO2 thicknesses. The LEDs are assumed to have gaussian spectra with bandwidths approximating the LEDs in the system. Next, the sources of noise (shot noise, readout noise, and dark noise) are calculated for each simulation and added. Note the quantity of noise added is random for each LED because shot noise follows a Poisson distribution. Finally, the model (ASR or paraxial approximation) is fit to the noisy data using the Levenberg-Marquardt algorithm. The fitting process extracts the optical thickness for each pixel in the image. Because IRIS measurements relate the difference between the spot thickness and background thickness to the amount of mass bound, the metric for comparison is the percent error between the expected and simulated difference.
The results (Fig. 2) show that the paraxial approximation model (Eq. 5) becomes invalid at higher NA while the ASR model (Eq. 6) stays consistent. Therefore, to accommodate the required high NA for sensitive fluorescence imaging, the more complex ASR model must be utilized to guarantee accuracy and precision in the measurement of immobilized probe density.
Figure 2.

Monte Carlo simulations of IRIS accuracy for a 1 nm thickness change while increasing NA (N = 100). (a) The paraxial approximation model becomes more erroneous at higher NA leading to a model breakdown. (b) However, the ASR model shows a significantly reduced and constant error. The vertical error bars are ±1 standard deviation.
Optical design
For an integrated instrument, the optical paths of each modality are analyzed for potential synergies to minimize the platform complexity. The optical design of both platforms is a top-illuminated, also known as reflection-mode, microscope. For reliable data collection, the sample must be illuminated uniformly across the imaged field-of-view in both cases. Since, in this case, both IRIS and wide-field fluorescence imaging use LEDs as the illumination source, the illumination paths are merged into a common Kohler illumination configuration. Yet, one caveat requiring attention is that fluorescence imaging necessitates spectral filters.
Fluorescence imaging optimizes sensitivity by ensuring maximum illumination intensity at the sample, but spectrally filters the illumination signal before detection to isolate the emitted fluorophore signal. To achieve spectral isolation, a short-pass excitation filter purifies the illumination spectra and a long-pass or band-pass filter in the imaging path minimizes the detected background signal from the illumination and external sources. For additional isolation and greater illumination/imaging efficiency, fluorescence imaging utilizes a long-pass dichroic mirror instead of a beamsplitter. This switch allows maximum reflection of the illumination signal to the sample and maximum transmission of the emitted fluorescence signal to the detector.
For this instrument, a 5× 0.5NA objective is coupled with the corresponding tube lens and a 0.63× magnification adapter for high NA, low magnification, and minimal aberration imaging. The resulting field-of-view is 2.5 mm × 3.4 mm with a 1 in. camera sensor. Illumination is performed with a red, green, yellow, blue LED package for IRIS imaging and a high power green LED with a short-pass filter for fluorescence imaging of Cy3. These sources are combined using a 50:50 non-polarizing beamsplitter before entering the Kohler illumination optics. For efficient switching of modalities, the dichroic mirror and band-pass filters are designed for quick removal and swapping with the 50:50 non-polarizing beamsplitter required for IRIS imaging, Fig. 3.
Figure 3.
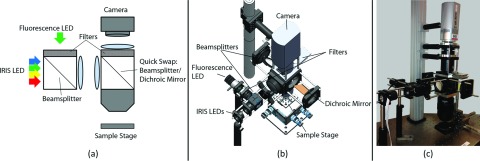
Integrated instrument design. (a) Schematic of the optical layout. For fluorescence, the second beamsplitter is swapped for a dichroic mirror and the emission filters are inserted. (b) Model of instrument with key components labeled. (c) Image of the constructed instrument.
METHODS
Reagents and equipment
TRIS, BSA, Tween 20, PBS tablets, and bovine serum albumin were purchased from Sigma-Aldrich (St. Louis, MO). Rabbit anti-β-lactoglobulin was purchased from Bethyl Laboratories Inc. (Montgomery, TX). Secondary antibodies (Cy3-labelled goat anti-mouse IgG) were purchased from Jackson ImmunoResearch Inc. (West Grove, PA). GenePix 4000B was used to acquire fluorescence measurements as a control. The S3 FlexArrayer from Scienion AG was used to spot proteins on the SiO2/Si slides.
SiO2/Si coating by copoly(DMA-NAS-MAPS)
SiO2/Si slides were dip coated for 30 min in a solution of copoly(DMA-NAS-MAPS) purchased from Lucidant Polymers, LLC. Then, the slides were washed with water and dried at 80 °C for 15 min. This polymer was selected for its coating reproducibility and optical transparency.
Proof of concept experiment
Instrument validation is performed by using the method described in Monroe et al.20 A direct label-free comparison between the IRIS platform and the integrated reader is completed to ensure an accurate measurement of probe immobilization with the implementation of a 0.5NA objective and the ASR model. In addition, the calibration capabilities of the platform are interrogated through an anti-β-lactoglobulin/β-lactoglobulin fluorescence sandwich assay using Cy3-label-secondary antibodies against β-lactoglobulin. The immobilized anti-β-lactoglobulin probe density is correlated to the detected Cy3 fluorescence signal. The anti-β-lactoglobulin/β-lactoglobulin system was picked for its well-established spotting protocols and reliable spotting morphologies.
A traditional sandwich assay using an anti-β-lactoglobulin/β-lactoglobulin system is conducted to model a variety of different antigen/ligand interactions. Ten replicates of anti-β-lactoglobulin of varying concentrations (0.015, 0.03, 0.063, 0.125, 0.25, and 1 mg/ml) are spotted onto 4 slides for ONC and 4 slides for CLC. After overnight humid chamber incubation, all slides are washed 3 times with 1X PBST, 3 times with 1X PBS, and 2X DI H2O for 4 min each, washed with water, and dried with a stream of argon gas. At this point, the immobilized probe density is measured using IRIS platform and the label-free modality of the calibrated fluorescence reader. The slides are blocked with 50 mM ethanolamine in TRIS/HCl 1 M pH 9 for 45 min and incubated with 10 μg/mL of β-lactoglobulin in PBS for 2 h. Next, the slides are washed with 1X PBST for 10 min, rinsed with water, dried with argon gas, and incubated with 1 μg/mL of Cy3 labeled secondary antibody against β-lactoglobulin in 1% weight/volume BSA in PBS for 1 h. Finally, the slides are washed with PBS for 10 min, rinsed with water, and dried with argon before the fluorescence signal is measured with the GenePix 4000B scanner and the calibrated fluorescence reader.
Fluorescence evaluation with the GenePix4000B was performed using 90% photomultiplier tube gain and 90% laser power for the maximal fluorescence signal without saturation. Fluorescence evaluation with the integrated calibrated fluorescence reader was performed using a 60 s exposure time at maximum LED power. The mean fluorescence intensity was normalized by the maximum detected fluorescence signal for each calibration approach and then plotted against the immobilized surface probe density.
RESULTS AND DISCUSSION
The presented instrument integrates the IRIS technique and fluorescence imaging to calibrate the fluorescence response to the probe immobilization of a microarray. Fig. 4 shows the label-free accuracy of the integrated reader against the IRIS platform. The integrated platform results strongly agree with the IRIS system for both substrate configurations. Thus, the conclusion can be drawn that the ASR model for high NA imaging offers equal accuracy and sensitivity to the IRIS platform.
Figure 4.

Comparison of the IRIS platform and the calibrated fluorescence reader's label-free modality. Diminishing concentrations of probe were spotted onto 4 slides for ONC and 4 slides for CLC. The resultant average and standard deviation of the 10 replicate spots at each spotted concentration for both calibration methods are shown here for both instruments. An R-squared value of >0.995 in both cases exemplifies the validity of the ASR model for high NA IRIS measurements. Error bars are ±1 standard deviation.
With the new high NA model authenticated, the calibration performance of the ONC and CLC designs can be evaluated for the integrated platform. Fig. 5a shows a correlation of 0.954 for the ONC and 0.930 for CLC. These results illustrate the presented platform's capability to calibrate the microarray accurately. Comparing the calibration response of the integrated calibrated fluorescence system to the optimized IRIS and Genepix 4000B combination shows almost identical normalized responses (Fig. 5b). The near-complete overlap of the integrated platform calibration and the IRIS|Genepix calibration proves the integrated system is able to operate with comparable IRIS and fluorescence sensitivities for accurate assay calibration.
Figure 5.

Validation of the integrated system. (a) The fluorescence signal shows a highly linear relationship to the measured probe density for both the ONC and CLC configurations on the calibrated fluorescence reader. (b) Comparing the integrated reader response to the IRIS and Genepix 4000B instruments shows a close relationship in calibration response. In both plots, the fluorescence is normalized by the maximum measured signal.
CONCLUSION
The performance of protein microarrays is affected by the array geometry, probe density, spot morphology, background signal, specificity, and sensitivity. Methods to address probe immobilization used in DNA microarrays are not cross-applicable to protein microarrays due to additional molecular complexity. Previously published data introduces a discussion on the substrate design to enable the nondestructive calibration of the fluorescence signal to the immobilized protein density measured by IRIS.20
This manuscript presents the design and characterization of a calibrated fluorescence reader. This reader incorporates IRIS and wide-field fluorescence imaging measurements for self-calibrating fluorescence assays. The ASR model for high NA IRIS measurements has been introduced and validated through direct comparison of the integrated reader and IRIS system. After certifying the label-free modality of the platform, a sandwich assay was conducted by spotting anti-β-lactoglobulin, incubating β-lactoglobulin, and then a Cy3-labeled-secondary antibody against β-lactoglobulin to verify the fluorescence sensitivity and linearity of the calibrated response. The resulting calibrated curve shows a strong correlation amongst all the slides and to the IRIS and Genepix reader calibration. These experiments verify both the label-free and fluorescence detection capabilities as well as illustrate the capability to calibrate an assay with a single, integrated platform.
Further engineering of the introduced platform can follow two diverging paths: (1) a standalone platform for an automated all-in-one sample-to-answer reader or (2) a modular unit for existing fluorescence readers. The development of standalone platform requires the implementation of an automated XYZ platform for focusing and indexing and fluidic controls to automate the assay. Although these items are not trivial, they have been addressed for similar technologies.16, 30 The modular unit for existing fluorescence readers would modify the light source. Wide-field fluorescence microscopes typically use one of the four types of light sources: a xenon arc lamp, a mercury-vapor lamp, a high-power LED, or a supercontinuum source. All of these sources require a similar optical path as IRIS. In the system presented, the optical path between the fluorescence high-power LED and the IRIS LEDs differed only by the emission filter. Therefore, an illumination housing which merges the fluorescence source and the IRIS source onto the same optical path would allow for the transition from a fluorescence reader to a calibrated fluorescence reader.
ACKNOWLEDGMENTS
The authors acknowledge financial support from the National Institutes of Health (NIH) award R01 AI1096159, the Smart Lighting Engineering Research Center cooperative agreement EEC-0812056, and the National Cancer Institute (NCI) and Boston University's Cross-Disciplinary Training in Nanotechnology for Cancer, NIH Grant No. R25 CA153955, awarded to M.R.M. The content is solely the responsibility of the authors and does not necessarily represent the official views of the National Science Foundation, National Cancer Institute, or the National Institutes of Health.
References
- Aguilar-Mahecha A., Hassan S., Ferrario A. C., and Basik M., OMICS: J. Integr. Biol. 10, 311 (2006). 10.1089/omi.2006.10.311 [DOI] [PubMed] [Google Scholar]
- Bild A. H., Yao G., Chang J. T., Wang Q., Potti A., Chasse D., Joshi M.-B., Harpole D., Lancaster J. M., Berchuck A., Olson J. A., Marks J. R., Dressman H. K., West M., and Nevins J. R., Nature 439, 353 (2006). 10.1038/nature04296 [DOI] [PubMed] [Google Scholar]
- Garaizar J., Brena S., Bikandi J., Rementeria A., and Pontón J., FEMS Yeast Res. 6, 987 (2006). 10.1111/j.1567-1364.2006.00108.x [DOI] [PubMed] [Google Scholar]
- Kassahn K. S., J. Fish Biol. 72, 2407 (2008). 10.1111/j.1095-8649.2008.01890.x [DOI] [Google Scholar]
- Kricka L. J. and Master S. R., Clin. Chem. 55, 1053 (2009). 10.1373/clinchem.2009.126557 [DOI] [PubMed] [Google Scholar]
- Stokes T. H., Moffitt R. A., Phan J. H., and Wang M. D., Ann. Biomed. Eng. 35, 1068 (2007). 10.1007/s10439-007-9313-y [DOI] [PubMed] [Google Scholar]
- Wilkes T., Laux H., and Foy C. A., OMICS: J. Integr. Biol. 11, 1 (2007). 10.1089/omi.2006.0001 [DOI] [PubMed] [Google Scholar]
- Dufva M., Biomol. Eng. 22, 173 (2005). 10.1016/j.bioeng.2005.09.003 [DOI] [PubMed] [Google Scholar]
- Hessner M. J., Nucleic Acids Res. 31, 60e (2003). 10.1093/nar/gng059 [DOI] [PMC free article] [PubMed] [Google Scholar]
- Anderson T., Wulfkuhle J., Liotta L., Winslow R. L., and Petricoin E., Proteomics 9, 5562 (2009). 10.1002/pmic.200900505 [DOI] [PMC free article] [PubMed] [Google Scholar]
- George S., Block I. D., Jones S. I., Mathias P. C., Chaudhery V., Vuttipittayamongkol P., Wu H.-Y., Vodkin L. O., and Cunningham B. T., Anal. Chem. 82, 8551 (2010). 10.1021/ac101551c [DOI] [PubMed] [Google Scholar]
- Olle E. W., Messamore J., Deogracias M. P., McClintock S. D., Anderson T. D., and Johnson K. J., Exp. Mol. Pathol. 79, 206 (2005). 10.1016/j.yexmp.2005.09.003 [DOI] [PubMed] [Google Scholar]
- Novikov E. and Barillot E., BMC Bioinf. 6, 293 (2005). 10.1186/1471-2105-6-293 [DOI] [PMC free article] [PubMed] [Google Scholar]
- Hessner M. J., Singh V. K., Wang X., Khan S., Tschannen M. R., and Zahrt T. C., BMC Genomics 5, 12 (2004). 10.1186/1471-2164-5-12 [DOI] [PMC free article] [PubMed] [Google Scholar]
- Peterson G., Bai J., and Narayanan S., J. Microbiol. Methods 77, 261 (2009). 10.1016/j.mimet.2009.02.014 [DOI] [PubMed] [Google Scholar]
- Ozkumur E., Needham J. W., Bergstein D. A., Gonzalez R., Cabodi M., Gershoni J. M., Goldberg B. B., and Ünlü M. S., Proc. Natl. Acad. Sci. U.S.A. 105, 7988 (2008). 10.1073/pnas.0711421105 [DOI] [PMC free article] [PubMed] [Google Scholar]
- Daaboul G. G., Vedula R. S., Ahn S., Lopez C. A., Reddington A., Ozkumur E., and Ünlü M. S., Biosens. Bioelectron. 26, 2221 (2011). 10.1016/j.bios.2010.09.038 [DOI] [PubMed] [Google Scholar]
- Zhao M., Wang X., Lawrence G. M., Espinoza P., and Nolte D. D., IEEE J. Sel. Top. Quantum Electron. 13, 1680 (2007). 10.1109/JSTQE.2007.911002 [DOI] [Google Scholar]
- Ozkumur E., Yalçin A., Cretich M., Lopez C. A., Bergstein D. A., Goldberg B. B., Chiari M., and Ünlü M. S., Biosens. Bioelectron. 25, 167 (2009). 10.1016/j.bios.2009.06.033 [DOI] [PMC free article] [PubMed] [Google Scholar]
- Monroe M. R., Reddington A. P., Collins A. D., LaBoda C., Cretich M., Chiari M., Little F. F., and Ünlü M. S., Anal. Chem. 83, 9485 (2011). 10.1021/ac202212k [DOI] [PMC free article] [PubMed] [Google Scholar]
- Volle J., Chambon G., Sayah A., Reymond C., Fasel N., and Gijs M. A. M., Biosens. Bioelectron. 19, 457 (2003). 10.1016/S0956-5663(03)00201-X [DOI] [PubMed] [Google Scholar]
- Bras M., Dugas V., Bessueille F., Cloarec J. P., Martin J. R., Cabrera M., Chauvet J. P., Souteyrand E., and Garrigues M., Biosens. Bioelectron. 20, 797 (2004). 10.1016/j.bios.2004.03.018 [DOI] [PubMed] [Google Scholar]
- Cretich M., Damin F., Pirri G., and Chiari M., Biomol. Eng. 23, 77 (2006). 10.1016/j.bioeng.2006.02.001 [DOI] [PubMed] [Google Scholar]
- Kusnezow W. and Hoheisel J. D., J. Mol. Recognit. 16, 165 (2003). 10.1002/jmr.625 [DOI] [PubMed] [Google Scholar]
- Cretich M., Monroe M. R., Reddington A., Zhang X., Daaboul G. G., Damin F., Sola L., Ünlü M. S., and Chiari M., Proteomics 12, 2963 (2012). 10.1002/pmic.201200202 [DOI] [PubMed] [Google Scholar]
- Cretich M., Breda D., Damin F., Borghi M., Sola L., Ünlü M. S., Burastero S. E., and Chiari M., Anal. Bioanal. Chem. 398, 1723 (2010). 10.1007/s00216-010-4077-x [DOI] [PubMed] [Google Scholar]
- Cretich M., Reddington A., Monroe M., Bagnati M., Damin F., Sola L., Ünlü M. S., and Chiari M., Biosens. Bioelectron. 26, 3938 (2011). 10.1016/j.bios.2011.03.016 [DOI] [PMC free article] [PubMed] [Google Scholar]
- Vedula R., Daaboul G., Reddington A., Özkumur E., Bergstein D. A., and Ünlü M. S., J. Mod. Opt. 57, 1564 (2010). 10.1080/09500340.2010.507883 [DOI] [Google Scholar]
- Yeh P., Optical Waves in Layered Media (John Wiley and Sons, 2004). [Google Scholar]
- Reddington A. P., Trueb J. T., Freedman D. S., Tuysuzoglu A., Daaboul G. G., Lopez C. A., Karl W. C., Connor J. H., Fawcett H., and Ünlü M. S., IEEE Trans. Biomed. Eng. 1 (2013). 10.1109/TBME.2013.2272666 [DOI] [PMC free article] [PubMed] [Google Scholar]