

Abstract
In neurons, small-conductance calcium activated potassium (KCNN/SK/KCa2) channels maintain calcium homeostasis after NMDA receptor activation, thereby preventing excitotoxic neuronal death. So far, little is known about the function of KCNN/SK/KCa2 channels in non-neuronal cells, such as microglial cells. In this study, we addressed the question whether KCNN/SK/KCa2 channels activation affected inflammatory responses of primary mouse microglial cells upon lipopolysaccharide (LPS) stimulation. We found that CyPPA, a positive pharmacological activator of KCNN/SK/KCa2 channels, significantly reduced LPS-stimulated activation of microglia in a concentration dependent manner. The general KCNN/SK/KCa2 channel blocker apamin reverted these effects of CyPPA on microglial proliferation. Since calcium plays a central role in microglial activation, we further addressed whether KCNN/SK/KCa2 channel activation affected the changes of intracellular calcium levels, [Ca2+]i, in microglial cells. Our data show that LPS-induced elevation of [Ca2+]i was attenuated following activation of KCNN2/3/KCa2.2/KCa2.3 channels by CyPPA. Furthermore, CyPPA reduced downstream events including TNF-α and IL-6 cytokine production and NO release in activated microglia. Further, we applied specific peptide inhibitors of the KCNN/SK/KCa2 channel subtypes to identify which particular channel subtype mediated the observed anti-inflammatory effects. Only inhibitory peptides targeting KCNN3/SK3/KCa2.3 channels, but not KCNN2/SK2/KCa2.2 channel inhibition, reversed the CyPPA-effects on LPS-induced microglial proliferation. These findings revealed that KCNN3/SK3/KCa2.3 channels can modulate the LPS-induced inflammatory responses in microglial cells. Thus, KCNN3/SK3/KCa2.3 channels may serve as a therapeutic target for reducing microglial activity and related inflammatory responses in the central nervous system.
Keywords: potassium KCNN/SK/KCa2 channels, CyPPA, calcium homeostasis, microglia, cytokines
Introduction
Microglial cells are the immune competent cells in the central nervous system originating from the peripheral mesodermal tissue during early postnatal development (Chan et al., 2007). Under physiological conditions, microglial cells display ramified morphology that is regarded as the resting phenotype (Kettenmann et al., 2011). During pathophysiological states, such as brain trauma, cerebral ischemia, or in neurodegenerative diseases, microglial cells become activated and change into a macrophage-like phenotype. Besides these pronounced morphological changes, activated microglia display increased proliferation rate, migration to the site of injury, increase in nitric oxide (NO) production, and release of several cytokines and chemokines (Rupalla et al., 1998).
Intracellular calcium [Ca2+]i controls the microglial activity state and acts as a central element in microglial activation (Hoffmann et al., 2003). Ca2+-permeable receptor-operated channels and Ca2+-permeable store-operated channels are the major responsible for increases in [Ca2+]i and related signaling pathways (Moller, 2002). Microglial receptors associated with calcium signaling and microglial activation pathways are multifaceted and include receptors for chemokines, complement factors, acetylcholine, endothelin, and purines (Kettenmann et al., 2011). In microglia, increases in [Ca2+]i are necessary for developing full cytokine induction (Hoffmann et al., 2003). Furthermore, in human microglia, cytokines promote Ca2+ influx (Goghari et al., 2000), which, in turn, might further activate microglia and increase cytokine production in a positive feedback loop manner.
It was previously reported that [Ca2+]i-dependent signaling is tightly associated with Ca2+-dependent potassium channels (Stocker, 2004; Dolga et al., 2011). For example, Ca2+-dependent potassium channels, such as large conductance Ca2+-activated potassium (BKCa) channels and small/intermediate-conductance Ca2+-activated potassium (KCNN1-3/SK/IK/KCa2) channels have been linked to microglial activation processes (Bordey and Spencer, 2003; Schlichter et al., 2010). In the central nervous system, KCNN1/SK1/KCa2.1, KCNN2/SK2/KCa2.2, KCNN3/SK3/KCa2.3 and KCNN4/SK4/KCa3.1 channels are widely expressed and functional (Stocker, 2004). In microglial cells, SK/KCa2 channels may be involved in microglial respiratory burst and related production of toxic oxygen radicals and nitric oxide. For example, apamin, a blocker of all KCNN/KCa2 channel subtypes, was able to inhibit the respiratory burst in microglia (Khanna et al., 2001). In our study, we aimed to differentiate the potential contribution of each particular KCNN/SK/KCa2 channel subtype to microglial activation by using specific KCNN/SK/KCa2 channel inhibitory peptides.
Since increases of intracellular [Ca2+]i potentiate microglial activation and contribute to full cytokine induction (Hoffmann et al., 2003), and KCNN/SK/KCa2 channels modulate calcium signaling (Dolga et al., 2011), we study the influence of KCNN/SK/KCa2 channels on microglial calcium homeostasis and its impact on LPS-induced microglial activation. We investigate particularly the role of extracellular calcium and KCNN2/3/KCa2.2/KCa2.3 channels in microglial activation, associated morphological changes, and cytokine production. We explore KCNN2/3/KCa2.2/KCa2.3 channel pathways using the positive modulator CyPPA (Hougaard et al., 2007) in combination with specific inhibitory peptides for each of the KCNN/SK/KCa2 channel subtypes (Tuteja et al., 2010). Using these specific inhibitory peptides we revealed that KCNN3/SK3/KCa2.3 channel activation was required to inhibit inflammatory responses of primary microglial cells after exposure to LPS. These results expose KCNN3/SK3/KCa2.3 channels as potential therapeutic targets to block inflammatory responses of microglia in neurological diseases.
Materials and methods
Primary microglia culture
Microglia cultures were prepared as previously described (Saura et al., 2003). Briefly, brains were removed from 1-3 day-old C57Bl/6 pups, minced, dissociated for 15 min in 1 mg/ml trypsin, and then cells were cultured in Dulbecco’s modified Eagle containing-calcium medium (DMEM, PAA Laboratories, Cölbe, Germany) consisting of Hams F12 (50/50), supplemented with 10% Fetal calf serum (FCS), 100 U/mL penicillin, 100 μg/mL streptomycin and 2 mM glutamine. After 2 days of in vitro cultivation, the growth medium was completely replaced by fresh medium. After 10-14 days, flasks were mechanically shaken for 60 min, 150 rpm to yield microglia in the supernatant, which were sub-cultured into uncoated 96 well plates (15000-17000 cells/well). They were kept in 30% astrocyte conditioned medium and 70% fresh DMEM/F12 supplemented with 10% Fetal calf serum (FCS), 100 U/mL penicillin, 100 μg/mL streptomycin and 2 mM glutamine for 1-2 days to achieve microglia in a quiescent state. For all experiments, primary microglial cells were used only for the first and second passage. For experiments with DMEM without calcium, we have used DMEM (#E15-078, PAA Laboratories) containing high glucose (4,5 g/L), HEPES (6 g/L) and sodium pyruvate (110 mg/L); and supplemented with 10% FCS, 100 U/mL penicillin, 100 μg/mL streptomycin and 2 mM glutamine. Primary mouse microglia were ≥ 95% pure, as verified by labelling with F4/80 (BioLegend, San Diego, CA, #122601) and GFAP antibodies (Cell Signaling, #2118). The compounds CyPPA (Hougaard et al., 2007), EDTA, LPS and apamin (Stocker, 2004) were obtained from Sigma, Deisenhofen, Germany. All compounds otherwise indicated were also purchased from Sigma (Deisenhofen, Germany).
LPS and drug treatment
Primary microglial cells were shaken off mixed glial cultures and plated in a density of 15000-17000 cells/well in 96-well plates overnight. Media was then changed to fresh DMEM/F12 (50/50) containing 10% FCS, 100 U/mL penicillin, 100 μg/mL streptomycin and 2 mM glutamine. Microglia were left non-stimulated or activated with 200 ng/ml lipopolysaccharide (LPS, Sigma, Deisenhofen, Germany) in the presence or absence of different concentrations of N-Cyclohexyl-N-[2-(3,5-dimethyl-pyrazol-1-yl)-6-methyl-4-pyrimidinamine (CyPPA) (10-75 μM) or apamin (5-20 μM). After 1-2 days, media was collected and either diluted 1/10 before use in ELISA studies or let undiluted for other applications, such as Griess reaction.
Griess reaction
NO production due to enhanced expression of iNOS in activated microglia was measured by a colorimetric method based on Griess reagent (Promega, Madison WI, USA, #G2930). The optical density (OD) was determined at 550 nm by an automated FLUOstar Optima reader (BMG Labtechnologies GmbH, Inc., Offenburg, Germany).
ELISA analysis
Concentrations of TNF-α and IL-6 in the supernatant of primary microglial cells were quantified by standard ELISA techniques using the Duoset ELISA system (R&D, Minneapolis, MN) according to the manufacturer’s instructions. Results represent the mean ± S.D. of three experiments, with each sample examined in triplicate within each experiment.
Cell viability assessment
Quantification of cell viability was performed by 3-(4,5-Dimethylthiazol-2-yl)-2,5-diphenyltetrazolium bromide (MTT) reduction assay at 0.5 mg/mL for 1 h. The reaction was terminated by removing the media and freezing the plate at -80° C for at least 1 h. Dimethyl sulfoxide (DMSO) solvent was added to each well for 1 h under shaking conditions at 37° C. The absorbance of each well was determined with an automated FLUOstar Optima reader (BMG Labtechnologies GmbH, Inc., Offenburg, Germany) at 570 nm with a reference filter at 630 nm. In addition, real time detection of cell proliferation was performed by measurements of cellular impedance by the xCELLigence system (Roche, Penzberg, Germany).
xCELLigence impedance-based system
xCELLigence system Real-Time Cell Analyzer RTCA-MP (Roche Diagnostics, Penzberg, Germany) allows tracking cellular impedance generated by cells, which after seeding, cover a micro-electrode network at the bottom of a culture dish. Cell resistance or impedance, depicted as cell index values (CI) and normalization were performed using the RTCA Software 1.2 (Roche Diagnostics). The normalization of cell index (NCIti) arbitrarily sets the cell index values to 1 at the indicated time points. xCELLigence system provides cell characteristic kinetic traces based on cell number and morphology, and the degree to which they interact with the sensor surface. The cell resistance is increasing in a dependent way with both cell number and morphological alterations. In our study, cell impedance was used to monitor the real time kinetics of microglial morphology alterations (Diemert et al., 2012). Primary microglial cells were seeded at a density of 15000 cells/well in 96-well E-plate (Roche Diagnostics). Prior to plating, background impedance was determined and always subtracted as blank value. Twenty-four hours after seeding, the cells were treated with different modulators of KCa2 channels in the presence or absence of LPS. At short time after each treatment, the cell index drastically drops for 30-60 min due to the media change and temperature difference (Diemert et al., 2012), followed by a total recovery set in to values before media change or drug treatment.
Immunocytochemistry
Cells were fixed using paraformaldehyde (PFA) 4% for 20 minutes and permeabilized using Triton X 0.04% for 5 minutes. Unspecific binding was blocked by incubation with 3% of goat serum for 30 minutes. Incubation with primary antibody against F4/80, GFAP at a concentration of 1:100 was conducted overnight at 4°C. Secondary anti-rabbit antibodies coupled to Alexa FLUOR® 488, (Invitrogen, Karlsruhe, Germany) were incubated at room temperature. Nuclei were counterstained with DAPI. Images were acquired using a confocal laser scanning microscope (Axiovert 200, Carl Zeiss, Jena, Germany) equipped with an UV and an argon laser delivering light at 364 nm and 488 nm, respectively. Light was collected through a 63 × 1.4 NA or 100 × 1.3 NA oil immersion objectives.
Protein analysis
Primary microglia were lysed in 20 mM Tris, 150 mM NaCl, 1 mM EDTA, 1 mM EGTA, 1% Triton X, pH 7.4, complete mini protease inhibitor cocktail tablet, and phosphatase inhibitor cocktail 1 and 2 (Sigma-Aldrich). The membranes were incubated overnight with primary antibodies (1: 3000 and 1:1000; rabbit anti-KCa2.2 and - KCa2.3 channel (Sailer et al., 2004) at 4°C and afterwards with peroxidase-conjugated secondary antibodies (1: 5000).
Transfection
Cellular loading of peptides was performed with cationic lipid mixture ProJect™ Protein Transfection Reagent kit according to the manufacturer’s instructions (Pierce Prod# 89850). Prediction of coiled-coil domains of the C-terminus of KCa2 channels by Coils Version 2.2 program (http://www.ch.embnet.org) and the characterization of peptide specificity for KCa2 channels was performed by Tuteja and colleagues (Tuteja et al., 2010). Microglial cells were transfected with 50 μM peptides in 96 well plates (15000-17000 cells/well) for 48 h. The evaluation of the impact of these peptides was carried out by microscope and by the impedance measurements (xCELLigence, Roche, Penzberg).
RT-PCR
Total RNA was extracted using the NucleoSpin RNA II kit (MACHEREY-NAGEL GmbH & Co. KG, Düren, Germany) following the manufacturer’s instructions. RT reactions were conducted using SuperScript® III One-Step RT-PCR System (Invitrogen) in a Lab Cycler, Sensoquest (SensoQuest Biomedizinische Elektronik GmbH, Göttingen, Germany). Following primers synthesized by Eurofins MWG Operon (Ebersberg, Germany) were used: KCNN1/SK1/KCa2.1 (240 bp) 5’-CTGTGGGAAGGGCGTGTGTCTG-3’; 5’-CCGAACCCGGCTTTGGTCTGG-3’; KCNN2/SK2/KCa2.2 (220 bp) 5’-GTGCTCTTGGTTTTAGTATCTCG-3’; 5’-CAACCTGCACCCATTATTCC-3’; KCNN3/SK3/KCa2.3 (400 bp) 5’-GCCAACAAGCGGAAAAACCAAAAC-3’; 5’-CCAGGCGTGCCGTCCAGAAGAAC-3’; KCNN4/SK4/IK/KCa3.1 (410 bp) 5’-GCATCGGGGCGCTCAACCA-3’; 5’-AGCGGCCGACTCCTTCATCTCTTT-3’. cDNAse digestion and RT-PCR without RT in the reaction mixture were used as negative controls for genomic DNA contamination. The following amplification of cDNA by PCR using specific primers were carried at the following steps: 1. denaturing at 95°C for 4 min; 2. 94°C for 30 sec; 3. Tm (annealing temperature) for 30 sec, depending on the KCNN/SK/KCa2 isoform of interest; 4. extension at 72°C for 30 sec; with 30 cycles from step 2 to 4. The final extension step was set to 72°C for 5 min. The Tm for KCNN1/SK1/KCa2.1 was 63°C; 57,3°C for KCNN2/SK2/KCa2.2; 61°C for KCNN3/SK3/KCa2.3 (Dolga et al., 2011).
Calcium measurements
To study the effects of LPS on [Ca2+]i, we used a ratiometric calcium dye, Fura-2AM. Sub-cultured primary microglia grown on Ibidi μ-slides (Ibidi GmbH, Martinsried, Germany at a density of 15000-17000 cells/well, for 2-3 days was incubated with 2 μM FURA-2 AM for 30 min at 37°C in HEPES-ringer buffer. Fluorescence intensities from single cells excited at the two wavelengths (F340 and F380) were recorded separately and combined (fluorescence ratio: r=F340/F380) after background subtraction (fluorescence of a cell-free area). Measurements were performed on 20-30 cells per well (with at least 3 wells per condition). For assessment of calcium levels, measurements were performed on random spots of Ibidi μ-slides without the treatment history knowledge and the data was pooled independently of microglial morphological shape. Experiments were repeated at least 3 times using primary microglia cultures from independent preparations.
Statistical analysis
All data are given as means ± S.D. For statistical comparisons between two groups, Student’s t-test was used assuming a normal distribution of the respective data (analysed with Shapiro-Wilk test) and U-test Mann-Whitney (for ELISA and NO measurements from 6 different wells and repeated for 3 times with independent primary microglial culture preparations). Multiple comparisons were performed by ANOVA followed by Scheffé’s and Bonferoni post hoc test (for MTT assays and calcium measurements, 6 different wells, repeated at least 3 times with independent primary microglial culture preparations). Calculations were made with the Winstat standard statistical software package (Robert Fitch Software, Bad Krozingen, Germany). A statistically significant difference was assumed at *p < 0.05, **p < 0.01, ***p < 0.001.
Results
Activation of KCNN/SK/KCa2 channels reverses LPS-induced microglial activation
To study the impact of KCNN/SK/KCa2 channels on the activation of microglial cells, we first established LPS-induced microglial activation kinetics using real-time impedance measurements (Diemert et al., 2012). These measurements provide information on microglial morphological changes, which are continuously monitored for the whole period of LPS exposure. LPS is commonly used to induce activation of microglial-macrophage cells and in studies of bacterial infections. Impedance alterations were displayed as cell index and suggested that LPS induced a continuous concentration-response increase in microglial proliferation (Figure 1A), which were detected within 90 minutes following LPS exposure. This increase in cell index persisted during the following 24 hours (Figure 1B). The impedance measurements were paralleled by immunofluorescence studies with a microglial marker (F4/80 antibody) (Figure 1C). We found that LPS induced marked alterations of microglial structural features in a concentration-dependent manner as detected by both, xCELLigence measurements and F4/80 immunostainings. Based on these results and on clinically relevant concentration ranges (Hanisch et al., 2001) we used 200 ng/ml LPS in further experiments of the study.
Figure 1. LPS induces primary microglial activation.
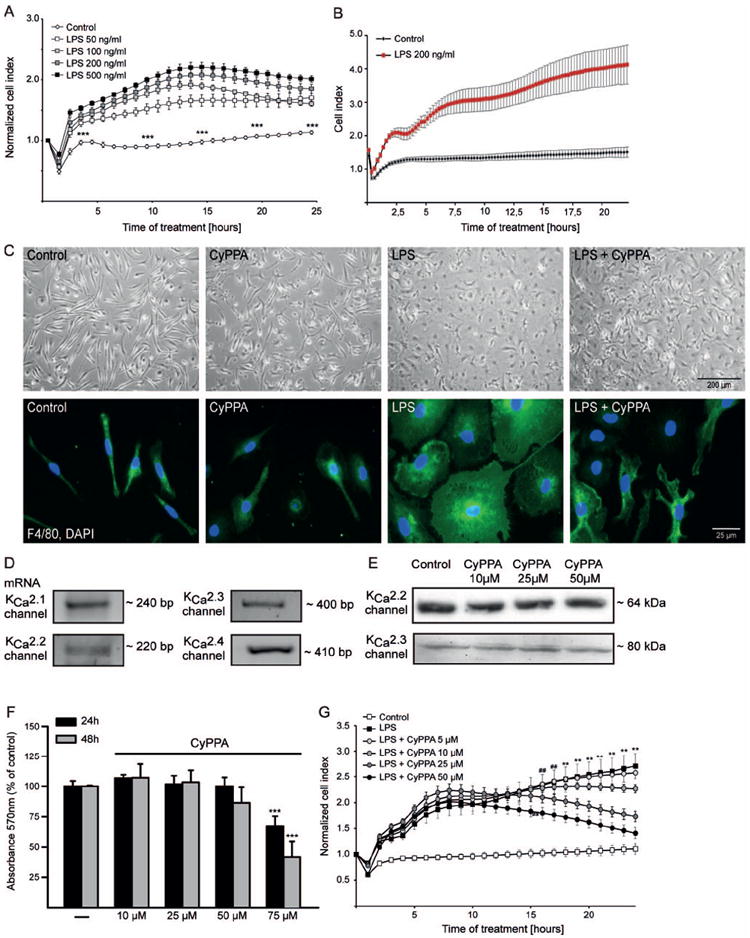
A. Microglial cells were seeded in 96 well E-plates at a density of 15000 cells/well and monitored with a real-time impedance-based xCELLigence system. After 24 h, cells were challenged with different concentrations of LPS, ranging from 50 to 500 ng/ml, as indicated. The time point of LPS treatment or media change is marked as “0 h” in the graph. B. Representative LPS kinetic curve using xCELLigence system (n=6 wells). The time point of LPS treatment or media change is marked as “0 h” in the graph. C. Morphometric alterations of activated microglia were visualized by bright-field microscope and by immunostaining with F4/80 antibody. D. mRNA analysis of KCNN/SK/KCa2 channel subtypes. E. Western blot analysis of KCNN2/SK2/KCa2.2 and KCNN3/SK3/KCa2.3 channels in microglial cells treated in the presence or absence of different concentrations of CyPPA, ranging from 10 to 50μM. F. MTT analysis of microglial cells treated with different concentrations of CyPPA for 24 and 48 h. Results are given as mean values ± S.D. (***p<0.001 versus non-treated microglia, ANOVA, Scheffé’s test, n=18 wells, repeated 3 times with independent primary microglia preparations). G. xCELLigence analysis of microglial cells treated with 200 ng/ml LPS, in the presence or absence of different concentrations of CyPPA (5–50 μM), as indicated. The time point of treatment is marked as “0 h” in the graph (**p<0.01 versus CyPPA-treated microglia (25μM), ##p<0.01 versus CyPPA-treated (50μM) microglia, ANOVA, Scheffé’s test, n=6 wells, experiment repeated at least 3 times with independent primary microglia preparations).
To dissect the role of KCa2 channels in activated microglia following the LPS challenge, we used pharmacological modulators of KCNN/SK/KCa2 channels and tested their influence on microglial morphological changes and proliferation. First, we established the expression levels of KCNN/SK/KCa2 channels by RT-PCR analysis. In primary microglia cells, mRNA analysis by RT-PCR revealed expression of all KCNN1/SK1/KCa2.1, KCNN/SK2/KCa2.2 and KCNN/SK3/KCa2.3 channel subtypes (Figure 1D). As a positive control, we documented the expression of KCa3.1 channel subtype that is known to be highly expressed in microglia (Kaushal et al., 2007). Next, we assessed the appropriate concentration and time kinetics of the positive KCNN2/3/KCa2.2/KCa2.3 channel modulator CyPPA in primary microglia (Figure 1E, F). Western blot analysis showed that CyPPA alone is not altering the KCNN/SK2/KCa2.2 or KCNN/SK3/KCa2.3 channel expression (Figure 1E). MTT analysis showed that at low concentrations of 10–25 μM, CyPPA did not affect cellular survival even after 48 h. However, at concentrations higher than 75 μM CyPPA considerably reduced cellular viability after 24 hours (Figure 1F). Based on these results, we used concentrations below 75 μM CyPPA in our further studies.
Co-treatment of microglia with LPS and CyPPA promoted a strong reduction of LPS-induced cell index increase in a concentration-dependent manner. However, CyPPA together with LPS did not reduce the first increase in the cell index, but produced a decline in cell index values following 8-10 h after CyPPA application (Figure 1G). Using the xCELLigence system, we determined the IC50 of 19 μM for CyPPA at 24 h after LPS application. Immunofluorescence analysis of specific microglial markers, such as F4/80 proteins, showed that LPS enlarged microglial cell bodies, which was prevented by CyPPA (Figure 1C). To exclude toxic effects of CyPPA in the presence of LPS, we analyzed metabolic activity using an MTT assay. CyPPA exposure for 24 hours reduced LPS-dependent microglial activation, but showed no alterations in the MTT assay when compared with non-treated microglia (Figure 2A). Thus, the CyPPA-induced decline in the cell index determined by impedance measurements was unlikely related to a reduced viability of microglial cells 24 h after the LPS challenge.
Figure 2. CyPPA prevents cytokine release.
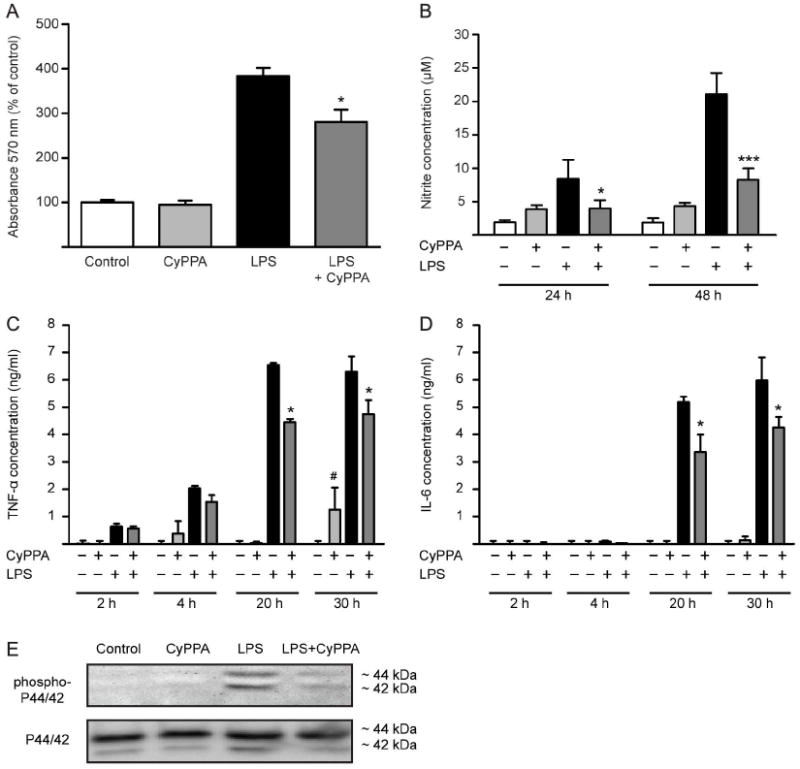
A. MTT analysis of microglial cells treated with CyPPA (25 μM) for 24 in the presence of LPS (200 ng/ml). Results shown represent mean ± S.D. (*p<0.05 versus LPS-treated microglia, ANOVA, Scheffé’s test, n=6 wells, experiment repeated at least 3 times with independent primary microglia preparations). B. NO production of microglial cells treated with 200 ng/ml LPS in the presence and absence of CyPPA (25 μM). The effects of CyPPA (25 μM) on cytokine production, TNF-α (C) and IL-6 (D) in LPS (200 ng/ml)-activated microglia for 2-30 h. Results represent mean S.D. (*p <0.05; ***p<0.001 versus LPS-treated microglia; #p<0.05 versus non-treated cells, U-test Mann-Whitney, n=3). E. Western blot analysis of phosphorylated and non-phosphorylated p44/p42 MAPK in microglial cells treated in the presence or absence of CyPPA (25 μM) and LPS (200 ng/ml).
To further evaluate the impact of KCNN2/3/KCa2.2/KCa2.3 channels on microglial activation processes, we investigated NO production and cytokine release in response to positive modulation of KCNN2/3/KCa2.2/KCa2.3 channels. CyPPA (25 μM) significantly reduced the LPS-mediated NO production in microglial cells at 24 and 48 hours (Figure 2B). Notably, CyPPA alone slightly increased NO release under control conditions but still blocked the burst of NO production induced by LPS (Figure 2B).
Similarly, activation of KCNN2/3/KCa2.2/KCa2.3 channels affected LPS-induced cytokine release in microglia. Under control conditions, the cytokines were not detectable in the supernatant of microglial cells. Activation of KCNN2/3/KCa2.2/KCa2.3 channels did not induce cytokine production at earlier time points (Figure 2C, D). However, CyPPA increased TNF-α release after 30 h treatment without altering the production of IL-6 cytokine. LPS caused an extracellular accumulation of the cytokines TNF-α as early as 4 h, which was partially reduced by activation of KCNN2/3/KCa2.2/KCa2.3 channels (Figure 2C). This reduction of LPS-dependent cytokine TNF-α and IL-6 release was even more pronounced after 20 and 30 h, suggesting a strong inhibitory effect on inflammatory responses in microglia by KCNN2/3/KCa2.2/KCa2.3 channel activation (Figure 2C, D).
To further determine the effects of CyPPA on LPS-dependent microglial activation and proliferation, we assessed the levels of phosphorylated p44/42 mitogen-activated protein kinase (MAPK) protein, a well-established marker for cell proliferation and microglial activation (Liva et al., 1999; Koistinaho et al., 2002). Western blot analysis showed that LPS promoted p44/42 MAPK phosphorylation, effect prevented by activation of KCNN2/3/KCa2.2/KCa2.3 channels with CyPPA (Figure 2E).
Pre-treatment with KCNN2/3/KCa2.2/KCa2.3 channel activators prevents microglial activation
To investigate the contribution of KCNN2/3/KCa2.2/KCa2.3 channels in microglial activation pathways, we pre-treated primary microglia with CyPPA for 24 h prior to LPS application. Such activation of KCNN2/3/KCa2.2/KCa2.3 channels strongly prevented the morphological alterations mediated by LPS, as detected by impedance measurements (Figure 3A).
Figure 3. Activation of KCNN2/3/KCa2.2/KCa2.3 channels prevents microglial activation.
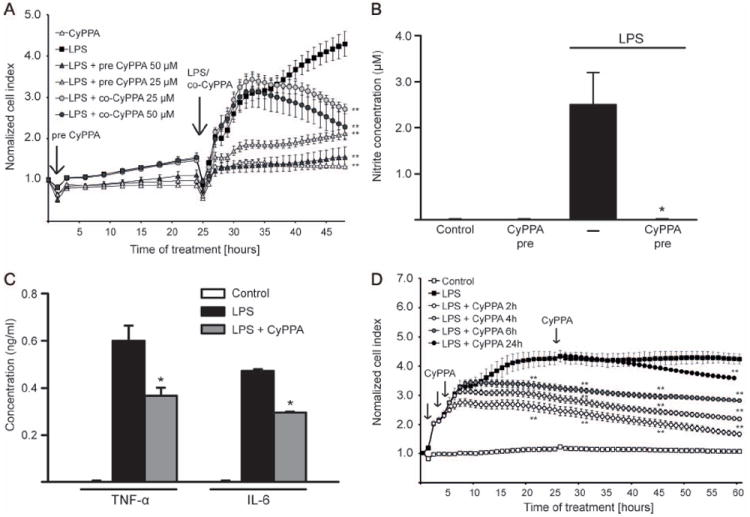
A. Microglial cells were seeded in 96 well E-plates with a density of 15000 cells/well and monitored with a real-time xCELLigence impedance-based system. Some microglial culture were pre-treated with CyPPA (25 and 50 μM) for 24 h (indicated as “LPS+pre CyPPA”). Afterwards, cells with or without CyPPA pre-incubation were challenged with LPS (200 ng/ml), as indicated by an arrow on the kinetic curve. To demonstrate that CyPPA is able to reduce LPS-induced cell index increase, some microglia were co-treated with LPS and CyPPA (indicated as “LPS+co-CyPPA”). The time point of CyPPA treatment initiation or media change is marked as “0 h” and of LPS challenge as “24 h” (n=6 wells, experiment repeated at least 3 times with independent primary microglia cultures, **p<0.01 versus LPS-treated microglia, ANOVA, Scheffé’s test). B. NO production of microglial cells pre-treated with CyPPA (25μM) in the presence and absence of LPS (200 ng/ml) (*p <0.05 versus LPS-treated microglia, U-test Mann-Whitney, n=3, experiment repeated 3 times with independent primary microglia cultures). C. Cytokine production in microglial cells pre-treated with CyPPA (25μM, 24 h) and followed by LPS challenge (200 ng/ml, 8 h). (*p <0.05 versus LPS-treated microglia, U-test Mann-Whitney, n=3, experiment repeated at least 3 times with independent primary microglia cultures). D. Microglial cells were challenged with LPS (200 ng/ml) followed by CyPPA treatment 2, 4, 6 and 24 h post LPS application (as indicated by black arrows on the graph). Microglial cells were monitored with a real-time xCELLigence impedance-based system for 60 h. The time point of LPS treatment initiation or media change is marked as “0 h” in the graph (n=4-6 different wells, experiment repeated at least 3 times with independent primary microglia cultures,**p<0.01 versus LPS-treated microglia, ANOVA, Scheffé’s test).
In addition, LPS-induced NO production as a result of microglial activation was drastically reduced by pre-treatment with CyPPA (Figure 3B). The analysis of cytokine release revealed that TNF-α and IL-6 production were also attenuated when microglia were pre-treated for 24 h with the KCNN2/3/ KCa2.2/KCa2.3 channel activator (Figure 3C).
To further evaluate the effect of KCNN2/3/KCa2.2/KCa2.3 channels on microglial activation, we performed experiments with CyPPA at different time points after the initiation of LPS-induced microglial activation. Microglia received CyPPA (25 μM) 2 h, 4 h, 6 h and 24 h following the LPS challenge. xCELLigence impedance analysis showed that CyPPA was able to block microglial proliferation in the first hours of LPS treatment (Figure 3D). Further, CyPPA was able to reduce the cell index even when applied only 24 h after the onset of the LPS challenge, suggesting that KCNN2/3/KCa2.2/KCa2.3 channels also affected ongoing microglial activation pathways.
KCNN/SK/KCa2 channel activator CyPPA controls microglial activation through effects on intracellular calcium levels
Next, we addressed the question, whether LPS was still capable of inducing microglial activation in the absence of extracellular Ca2+. We compared LPS effects on microglial cells in calcium-containing medium with effects obtained in calcium-free medium. Impedance measurements showed that activation of microglial cells was drastically reduced in the absence of extracellular calcium (Figure 4A and B). These experiments were also paralleled by MTT proliferation assays, which confirmed that activation of microglia was significantly diminished in the absence of extracellular calcium (Figure 4C). Further, the cells were challenged with LPS in the presence of the calcium chelator EDTA to substantiate the role of extracellular calcium in LPS-induced microglial activation. Chelating extracellular calcium by EDTA attenuated microglial activation in a concentration- and time-dependent manner (Figure 4D). It is interesting to note that EDTA alone did not influence cell proliferation when compared to controls, while a combination of LPS and EDTA reduced cell proliferation in the microglial cultures compared to LPS treatment alone (Figure 4E). These findings indicate that microglial activation depends on extracellular calcium.
Figure 4. Extracellular calcium is a prerequisite for microglial activation.
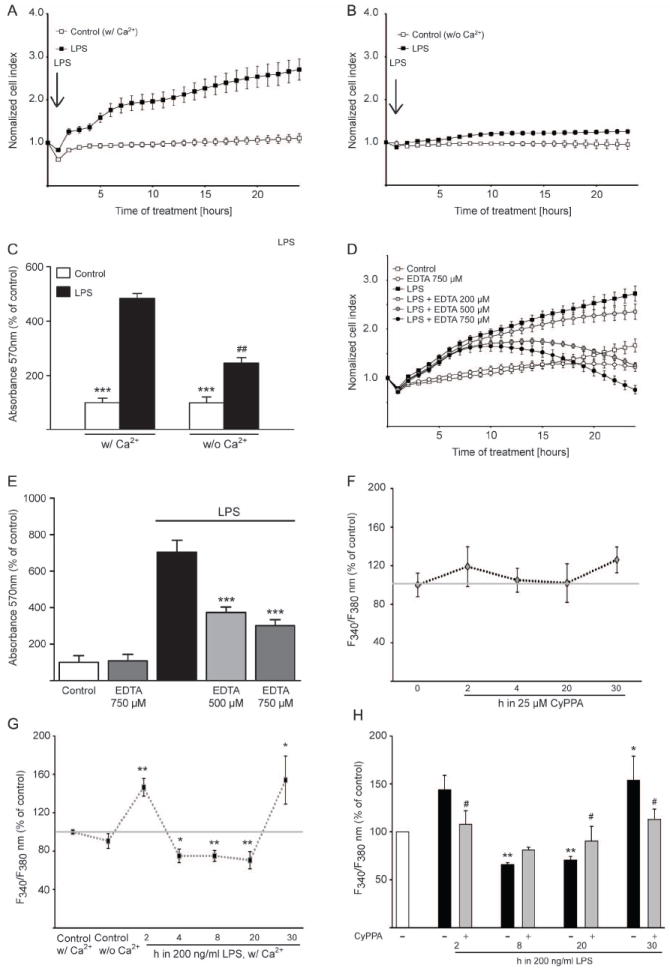
Morphological alterations of microglial cells were detected by real-time impedance-based system. A. Microglia was challenged with 200 ng/ml LPS in the presence of extracellular calcium or (B) in calcium-free medium. The time point of treatment is marked as “0 h” in the graph (n=6 different wells, experiment repeated 3 times with independent primary microglia cultures). C. MTT analysis of microglial cells challenged with LPS (200ng/ml) in calcium-containing medium as well as in calcium-free medium (***p<0.001 versus LPS-treated microglia, ##p<0.01 versus LPS-treated cells in calcium-containing medium, ANOVA, Scheffé’s test, n=6 different wells, experiment repeated 3 times with independent primary microglia cultures). D. xCELLigence measurements of LPS-activated cells co-treated with different concentrations of EDTA, ranging from 200 to 750 μM, as indicated. E. MTT analysis of microglia activated by 200 ng/ml LPS in the presence of the extracellular calcium chelator, EDTA (500 and 750 μM). Results represent mean ± S.D. (***p<0.001 versus LPS-treated microglia, ANOVA, Scheffé’s test, n=6, experiment repeated 3 times with independent primary microglia cultures). F-H. Calcium measurements were performed with Fura-2AM calcium sensor. Basic intracellular Ca2+ changes (F340/F380) during the first 30 h (F,n = 3 independent experiments from different primary microglial preparations, with 30-40 cells measured per condition) after incubation with 25μM CyPPA (F) or 200 ng ml−1 LPS (G). (n = 30-40 cells, **p<0.01 versus untreated microglia, #p<0,05 versus LPS-treated microglia, ANOVA, Scheffé’s test, n=3 independent experiments). H. Microglia cells were challenged with 200 ng/ml LPS for 2-30 h. Some cells were treated with CyPPA (25μM) and the intracellular calcium was measured with Fura-2AM calcium sensor. Results represent mean ± S.D. (***p<0.001 versus LPS-treated microglia, ANOVA, Scheffé’s test, n=3).
Chronic elevation of basal [Ca2+]i in response to LPS exposure is a central element in microglial activation processes (Hoffmann et al., 2003). To further study the proposed role of increased intracellular calcium levels for the activation of microglial cells, we performed time kinetics using a ratiometric calcium indicator, Fura-2 AM. CyPPA alone did not cause any significant alterations of [Ca2+]i compared to control microglia cultures (Figure 4F). Thus, activation of KCNN2/3/KCa2.2/KCa2.3 channels did not affect calcium signalling per se/under control conditions. To obtain further insight in microglial calcium signalling, we monitored intracellular calcium for a period of 30 hours after the onset of LPS challenge. Alteration in calcium levels were analysed in microglial cells treated for 2, 4, 8, 20 and 30 h with LPS. Interestingly, using this approach, LPS induced an increase in intracellular calcium levels upon 2 h of LPS application, followed by a reduction in [Ca2+]i signals after 4 h of LPS challenge, followed by higher values than non-treated microglia, after 20 h of LPS application (Figure 4G). This striking reduction in [Ca2+]i correlated well with the previous report on the LPS-dependent effects on [Ca2+]i kinetics (Beck et al., 2008). Microglial cells challenged with LPS for at least 30 h in the presence of CyPPA, however, did not show the previously observed LPS-induced elevation of [Ca2+]i (Figure 4H). Interestingly, CyPPA attenuated LPS-mediated calcium increases already after 2 h of LPS challenge. This result suggests that activation of KCNN2/3/KCa2.2/KCa2.3 channels could prevent LPS-induced alterations in microglial intracellular calcium (Figure 4H).
KCNN3/SK3/KCa2.3 channels but not KCNN2/SK2/KCa2.2 channels prevent microglial activation by LPS
To probe the proposed role of KCNN/SK/KCa2 channels in microglial activation, we treated microglial cells with apamin, a non-selective KCNN/SK/KCa2 channel subtype pore blocker. Microglial proliferation was not affected by apamin alone, while the CyPPA-dependent decrease of cell index in activated microglia was clearly blocked by apamin (Figure 5A). To further differentiate the contribution of the individual KCNN/SK/KCa2 channel subtypes in LPS-induced microglial activation, we used specific inhibitory peptides for each KCNN/SK/KCa2 channel subtype expressed in microglia, i.e. KCNN1/SK1/KCa2.1, KCNN2/SK2/KCa2.2 and KCNN3/SK3/KCa2.3 channels (Tuteja et al., 2010). Since these inhibitory peptides bind to the intracellular C-terminus, we used the Pro-Ject™ transfection reagent to ensure intracellular uptake of the respective peptide inhibitors. The transfection efficacy of the inhibitory peptides was assessed with rhodamine-labeled control peptides which showed a transfection rate of greater than 90 % (Figure 5E).
Figure 5. Prevention of microglial activation is dependent on KCNN3/SK3/KCa2.3 channels.
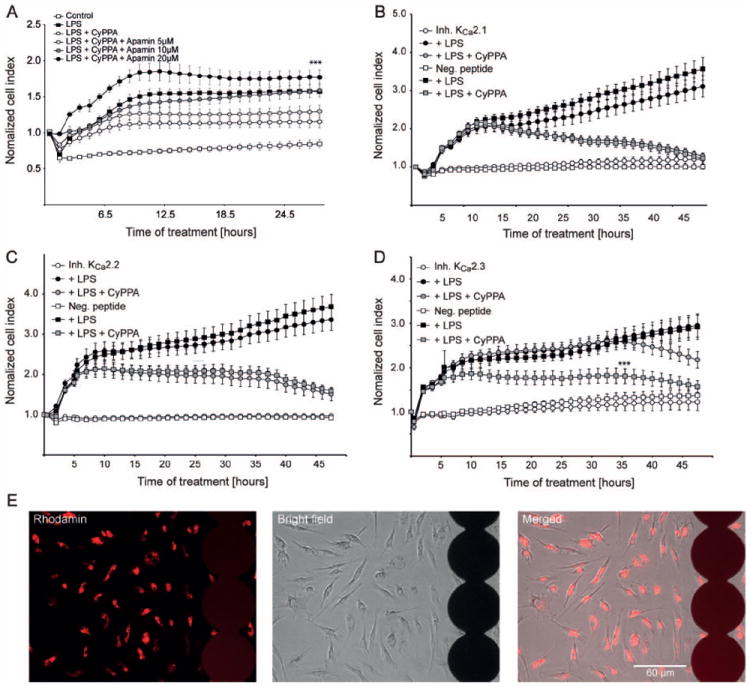
A. Microglial cells were seeded in 96 well E-plates with a density of 15000 cells/well and monitored with a real-time xCELLigence impedance-based system. Microglial cells were challenged with LPS (200 ng/ml) and co-treated with CyPPA (25 μM) in the presence and absence of different concentrations of apamin. The time point of pre-treatment is marked as “0 h” in the graph (n=6 wells, experiment repeated 3 times with independent primary microglia cultures, ***p <0.001 versus CyPPA-treated microglia, ANOVA, Scheffé’s test). B. xCELLigence measurements of microglial cells transfected with inhibitory peptides specific for (B) KCNN1/SK1/KCa2.1, (C) KCNN2/SK2/KCa2.2 or (D) KCNN3/SK3/KCa2.3 channels. Cells were treated with 200 ng/ml LPS in the presence or absence of 25 μM CyPPA. The time point of pre-treatment is marked as “0 h” in the graph (n=6, ***p <0.001 versus LPS+CyPPA-treated microglia transfected with KCa2.3 inhibitory peptides, ANOVA, Scheffé’s test). E. The transfection efficacy of the ProJect™ transfection kit was assessed with rhodamine-labeled peptides (red fluorescence) using. The photomicrographs show the transfected cells growing on the electrode layer (black circles) of E-plates that enable cellular impedance measurements.
Application of specific inhibitory peptides for KCNN1/SK1/KCa2.1 and KCNN2/SK2/KCa2.2 channels did not influence CyPPA effect on LPS-induced microglial proliferation. In sharp contrast, the specific inhibitory peptides for KCNN3/SK3/KCa2.3 channels delayed the CyPPA effect for at least 10-15 h, suggesting that CyPPA blocked LPS-induced activation of microglia through enhanced activity of KCNN3/SK3/KCa2.3 channels (Figure 5B-D).
LPS-induced NO and cytokine release by microglial cells are altered by modulation of KCNN3/SK3/KCa2.3 channels
Next, we determined the effect of the KCNN/SK/KCa2 channel blocker apamin and the specific inhibitory peptides on NO production, as well as the release of cytokines, i.e. characteristic features of microglial inflammatory responses. Interestingly, apamin reversed the inhibitory effects of CyPPA on LPS-induced cytokine releases (Figure 6A and B). Since apamin is a general KCNN/SK/KCa2 channel blocker, we further investigated NO and cytokine release in the presence of specific inhibitory KCNN/SK/KCa2 channel peptides, in order to distinguish particular contributions of the individual KCa2 channel subtypes. The peptides targeting the KCNN3/SK3/KCa2.3 channel abolished the CyPPA-mediated inhibition of LPS-induced NO production (Figure 6C). Interestingly, CyPPA reduced TNF-α release in activated microglia even in the presence of KCa2.3 channel inhibitory peptides (Figure 6D). These data show that the TNF-α release activities are not modulated by KCNN3/SK3/KCa2.3 channels. In contrast, IL-6 release was not reduced by CyPPA in the presence of KCNN3/SK3/KCa2.3 inhibitory peptides when compared with the corresponding LPS-activated microglia (Figure 6E). These results strongly suggested that IL-6 release was regulated by KCNN3/SK3/KCa2.3 channel subtypes.
Figure 6. KCa2.3 regulates microglial activation pathways.
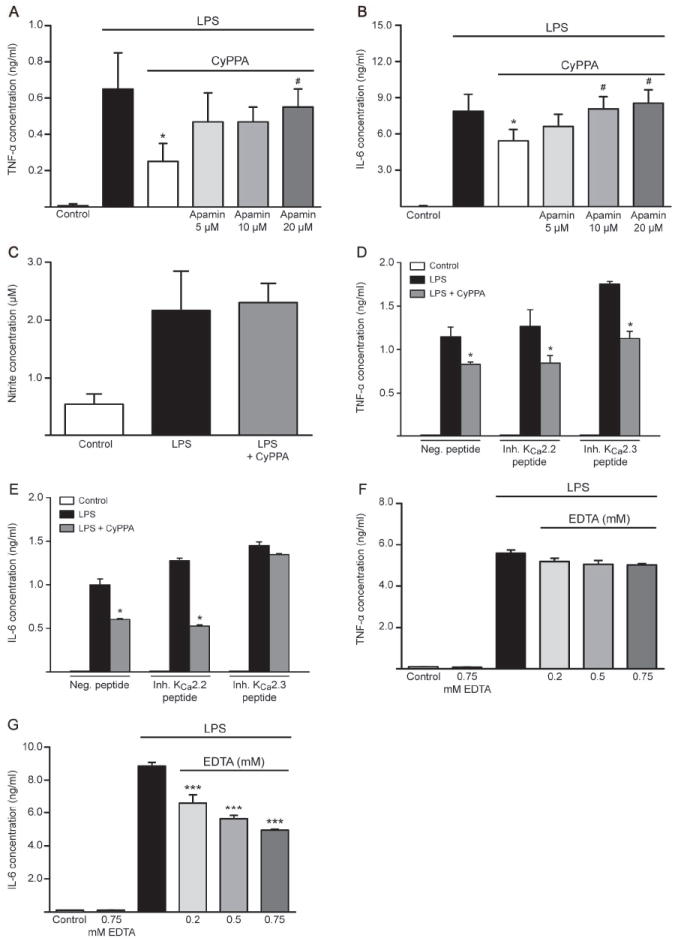
Cytokine production, TNF-α (A) and IL-6 (B) in microglial cells co-treated with LPS (200 ng/ml) and CyPPA (25 μM) in the presence and absence of different concentrations of apamin. Results represent mean ± S.D. (*p <0.05 versus LPS-treated microglia, #p<0.05 versus CyPPA-treated microglia, U-test Mann-Whitney, n=3, experiment repeated 3 times with independent primary microglia cultures). C. NO release in microglial cells transfected with inhibitory peptides for KCNN3/SK3/KCa2.3 channels. Results shown represent mean ± S.D. (n=3, experiment repeated 3 times with independent primary microglia cultures). D. TNF-α and E. IL-6 production in microglial cells transfected with inhibitory peptides for KCNN2/SK2/KCa2.2 and KCNN3/SK3/KCa2.3 channels and challenged with LPS (200 ng/ml) in the presence of CyPPA (25 μM). Results are presented as mean values ± S.D. (*p <0.05 versus LPS-treated microglia, U-test Mann-Whitney, n=3, experiment repeated 3 times with independent primary microglia cultures). F. TNF-α and G. IL-6 production in microglial cells and co-treated with different concentrations of EDTA, as indicated. Results are shown as mean values ± S.D. (***p <0.001 versus LPS-treated microglia, U-test Mann-Whitney, n=6, experiment repeated 3 times with independent primary microglia cultures).
To determine the impact of calcium signaling on cytokine release, we analyzed the cytokine production in response to microglial activation when extracellular calcium was chelated with various concentrations of EDTA. It was previously shown that reducing intracellular [Ca2+]i with BAPTA-AM strongly attenuated cytokine release in activated microglia (Hoffmann et al., 2003). However, treatment with ionomycin was demonstrated to enhance intracellular [Ca2+]i without any cytokine production, suggesting that increases in [Ca2+]i are permissive but cannot trigger the cytokine production and release by itself (Hoffmann et al., 2003). In our studies, chelating extracellular calcium in LPS-stimulated microglia did not alter TNF-α release (Figure 6F). Interestingly, in sharp contrast to the results obtained with TNF-α measurements, the chelation of extracellular calcium with EDTA strongly attenuated the IL-6 release in a dose-dependent manner (Figure 6G). These experiments suggest that KCNN3/SK3/KCa2.3 activation attenuated IL-6 release because of reduced Ca2+ influx, whereas TNF-α release is regulated in a calcium-independent manner.
Discussion
The results of the present study demonstrate that in primary microglial cells, KCNN3/SK3/KCa2.3 channel activation attenuates LPS-induced increases in [Ca2+]i, morphological transformation to macrophages, cell proliferation, and IL-6 production. Persistent elevation of [Ca2+]i was previously reported in mouse microglia after 24 h of LPS treatment (Hoffmann et al., 2003). There is an ongoing debate on the mechanisms underlying receptor-mediated microglial activation and calcium homeostasis. Several hypotheses imply that an elevation of [Ca2+]i in microglial cells results from altered efficiencies of Ca2+ extrusion pumps and insufficient intracellular Ca2+ buffering systems. Several ion channels have been reported to act in concert to shape the calcium signals in microglial cells (Beck et al., 2008; Launay et al., 2004). Sub-cultured microglial cells express inward rectifying potassium currents (IIRK), voltage-gated and delayed rectifying potassium currents (IDRK), including Kv1.3 and Kv1.5 channels (Kettenmann et al., 1990; Boucsein et al., 2000; Beck et al., 2008). In addition, transient receptor potential cation channel subfamily M member 4 (TRPM4), a Ca2+-activated Ca2+ current (ICRAC) was shown to regulate Ca2+ oscillations by membrane potential changes (Launay et al., 2004; Beck et al., 2008). During several days of sub-culturing microglia, the percentage of cells that exhibit potassium IIRK current increased, and the percentage of cells with prominent potassium IDRK current drastically declined (Beck et al., 2008). Following 24 h LPS challenge, 14% of cells revealed IIRK current and 3% IDRK current, suggesting that IIRK current is essential for LPS-dependent Ca2+ alterations. In the present study, we reveal a significant contribution of KCNN/SK/KCa2 channels in regulating the calcium homeostasis of microglial cells. In fact, the KCNN3/SK3/KCa2.3 subtype of these channels apparently controls increases in intracellular calcium, microglial activation and inflammatory cytokine release.
However, the association between microglial morphological changes, alterations of intracellular [Ca2+] and cytokine release has not been fully elucidated so far. Most of the previous reports from studies in sub-cultured microglia showed the effects of LPS on morphological parameters and on Ca2+ signals after 24 h, without showing data of the time window before the full microglial activation. Our impedance measurements revealed that LPS altered microglial morphological shape immediately following its application. The LPS-induced microglial impedance kinetic demonstrated that there are three phases of microglial activation, first phase includes a sharp, fast increase of cell impedance in the first 2-3 h, followed by a steady second phase (1-2 h) and a third phase represented by a further increase with higher values than those observed during the first phases (Figure 1B). These microglial impedance measurements confirmed the observations that 34% of cells exhibit an “amoeboid-shape” within the first 3 h of the LPS challenge, while within 48 h of LPS exposure 90% of the cells revealed this amoebic phenotype (Beck et al., 2008). However, the LPS-dependent Ca2+ alterations are in sharp contrast to the microglial morphological shapes. In sub-cultured microglia, LPS induced a strong elevation in [Ca2+]i after 2 h, followed by a transient undershoot lasting for at least 20 h, before returning to basic levels detected before LPS application. Our findings are consistent with the data on LPS-induced [Ca2+]i alterations previously reported by Beck and colleagues (Beck et al., 2008). They reported that LPS mediated drastic calcium increases within first 2 h, although with a delay of 40-50 min, while the potassium currents were altered only after 3-6 h LPS exposure. These studies corroborate well with our finding that KCNN/SK3/KCa2.3 channel activation can elicit effects on microglial activation (Figure 1G) after at least 6-8 h following LPS application. The remaining question of how calcium dysregulation was involved in microglial activation processes prompted us to investigate calcium signals in response to LPS challenge in the absence of extracellular calcium. The first increase of [Ca2+]i in response to LPS is essential to promote an increase in cell impedance, since removal of extracellular calcium abolishes both the [Ca2+]i increases and the second elevation of cell index (Figure 1B). KCNN/SK/KCa2 channel activation attenuated the initial calcium increase following 2 h of LPS treatment and also reduces the LPS-induced microglial activation after 8-30 h. Although the calcium signals are below basal levels following 4h LPS challenge, TNF-α cytokine release is initiated in response to LPS. Cytokine release is gradually augmented during 20 h LPS treatment, while the intracellular calcium was found below basal levels. The second rise in intracellular calcium levels detected following 30 h LPS challenge might be due to LPS-mediated sustained cytokine release, which in turn, can trigger calcium increases, acting as a positive feed-back loop mechanism. These findings imply that the initial LPS-mediated increase in [Ca2+]i signals is essential for triggering delayed cytokine production (20-30h following LPS challenge), since activation of KCNN/SK/KCa2 channels suppressed the initial [Ca2+]i increase and also the delayed cytokine and NO release. The reduction of basal [Ca2+]i signals following 4 h of LPS application might be due to the decline in amplitude of IDRK and IIRK currents, which would favour a more depolarized membrane potential and decreased driving force for Ca2+ into the cell (Beck et al., 2008). How KCNN/SK/KCa2 current activity is altered upon LPS challenge remains to be investigated. One hypothesis involves close association between KCa2 channels and purinergic receptors, since LPS injection into striatum markedly increased the expression of ionotropic ATP-gated purinergic P2X(7) receptors in microglia (Choi et al., 2007), and P2X(7)R receptors potentiated intracellular [Ca2+]i mobilization which in turn activated KCNN3/SK3/KCa2.3 channels (Jelassi et al., 2011). Thus, activation of KCNN3/SK3/KCa2.3 channels might act in a feedback loop manner to reduce the ongoing microglial proliferation induced by ATP-sensitive receptors. In a recent study, contribution of KCNN3/SK3/KCa2.3 channels to microglial activation processes was discriminated using subtractive pharmacological approach based on affinities of apamin and tamapin for cloned KCNN/SK/KCa2 channels (Pedarzani and Stocker, 2008). The IC50 values for apamin are 0.7-12 nM in recombinant human KCNN1/SK1/KCa2.1 channels, 27-140 pM for KCNN2/SK2/KCa2.2 channels, and 0.6-4.0 nM for KCNN3/SK3/KCa2.3 channels. The Kd values for tamapin are 24 pM for KCNN2/SK2/KCa2.2 channels and 1.7 nM for KCNN3/SK3/KCa2.3 channels (Pedarzani et al., 2002). A role for KCNN3/SK3/KCa2.3 channels was deduced when the cellular microglial functions were inhibited by 100 nM apamin and 5 nM tamapin, but not by 250 pM tamapin (Schlichter et al., 2010). Thus, using this subtractive pharmacological approach, the authors suggested that inhibition of KCNN3/SK3/KCa2.3 channels reduced the neurotoxic effects of activated microglia (Schlichter et al., 2010). However, the authors did not investigate the effects of toxins on cytokine production in microglial cells. In sharp contrast with these findings, it was very recently demonstrated that riluzole activated KCNN3/4/KCa2.3/KCa3.1 channels thereby inducing anti-inflammatory effects in a microglial cell line (Schlichter et al., 2012). In this recent study, riluzole induced an increase in KCNN3/4/KCa2.3/KCa3.1 activity and it reduced LPS-induced proliferation and cytokine release in primary rat microglia. These findings are clearly in line with our current results showing that KCa2.3 channel activation reduces LPS-dependent microglial activation. In addition, we show here in primary microglia that apamin mitigated the effect of CyPPA on cytokine suppression, and it also reduced the effect of CyPPA on microglial proliferation as assessed by impedance measurements. To overcome the possible limitations attributed to subtractive pharmacology and to unspecific pharmacological inhibition of all KCNN/SK/KCa2 subtypes by apamin, we applied specific inhibitory peptides for the different KCNN/SK/KCa2 channel subtypes (Tuteja et al., 2010). Using these inhibitory peptides, we revealed a differential regulation of cytokine release activities only through KCNN3/SK3/KCa2.3 channel activation. In fact, only inhibition of KCNN3/SK3/KCa2.3 channel activity delayed CyPPA-dependent cell index decrease for at least 15-20 h, demonstrating that in microglial cells activation of KCNN3/SK3/KCa2.3 channels inhibits microglial proliferation. Further, CyPPA-mediated suppression of LPS-induced IL-6 release was completely abolished by specific inhibitory peptides for KCNN3/SK3/KCa2.3 channels. Major executive features of microglial activation processes, such as production and release of cytokines and chemokines, depend on de novo synthesis of these proteins. Since intracellular Ca2+ mobilization and increased [Ca2+]i levels are just permissive and not initiating for cytokine production (Hoffmann et al., 2003), our study now implies that KCNN3/SK3/KCa2.3 channels regulate microglial [Ca2+]i, and, in addition, exert a differential control over cytokine production and release activities. In LPS-stimulated microglia, activation of KCNN3/SK3/KCa2.3 channels attenuated IL-6 release in a similar fashion as EDTA suggesting that IL-6 production and release dependence on extracellular calcium was sensitive to inhibitory modulation by KCNN3/SK3/KCa2.3 channels. In stimulated microglia, TNF-α release is not affected by extracellular calcium chelation, which is in sharp contrast to KCNN3/SK3/KCa2.3 channel activation by CyPPA that attenuated microglial activated-dependent TNF-α release. Indeed, such differential cytokine induction and kinetics were also reported in murine peritoneal macrophages or in human skeletal myocytes in response to various stimuli such as LPS, interferon (IFN)-gamma, platelet activating factor, or calcineurin (Marriott et al., 1998; Keller et al., 2006). Thus, regulation of cytokine induction and release apparently involves more than one single calcium-dependent pathway (Marriott et al., 1998).
Several studies showed that potassium channels other than KCNN/SK/KCa2 channels can be involved in microglial activation. KCNN4/KCa3.1 channels are highly expressed in microglial cells (Khanna et al., 2001) and are involved in the production of reactive oxygen species, nitric oxide and protein tyrosine nitration (Skaper, 2011). Beneficial effects of KCNN4/KCa3.1 channel inhibition are mainly attributed to the selective blocker triarylmethane-34 (TRAM-34) (Wulff et al., 2000) which reduces the neurotoxicity mediated by LPS-activated microglia by reducing the expression of inducible nitric oxide synthase and caspase 3 (Kaushal et al., 2007). However, the functional difference between KCNN4/KCa3.1 and KCNN3/SK3/KCa2.3 channels remains to be further evaluated. On the contrary, diazoxide, an activator of ATP-sensitive potassium (KATP) channels, restored microglial activation in the corpus callosum after permanent bilateral occlusion of the common carotid arteries in rats (Farkas et al., 2005). Our data demonstrate that activation of KCNN3/SK3/KCa2.3 channels prevents characteristic features of microglial activation, such transformation into macrophages, NO production and cytokine release activities. Activation of KCNN2/3/KCa2.2/KCa2.3 channels by CyPPA did not alter cytokine production under control conditions, but clearly reduced LPS-induced cytokine release, which indicated a potential for CyPPA to provide protective functions by counteracting LPS-related inflammatory responses.
Our study demonstrates that extracellular calcium contributes to LPS-induced microglial proliferation and IL-6 release and by activation of KCNN3/SK3/KCa2.3 channels the microglial proliferation and cytokine release is strongly attenuated. Our data further suggest that KCNN3/SK3/KCa2.3 channels regulate microglial-dependent acute inflammatory processes, since our treatment protocol spanned over a period of 24 hours. Interestingly, CyPPA applied following the onset of microglial activation at the point of LPS-induced maximum proliferation still led to a decrease of the cell index, suggesting that KCNN3/SK3/KCa2.3 channel activation can modulate ongoing microglial-dependent activation pathways. Moreover, activation of KCNN/SK/KCa2 channels elicits a dual action in the nervous system, by counteracting the effects of microglial activation as shown in this study, and by maintaining calcium homeostasis after NMDAR activation, thus preventing in vitro excitotoxic neuronal death and in vivo middle cerebral artery occlusion (MCAo) acute brain damage as shown in earlier studies (Dolga et al., 2008; 2011, Allen et al., 2011)
In conclusion, our data demonstrate that modulation of KCNN3/SK3/KCa2.3 channels may serve as a therapeutic target for reducing microglial activity and related detrimental inflammatory effects in the nervous system.
Acknowledgments
We thank Alexander Sailer for kindly providing the xCELLigence support, Sassan Rafizadeh for the specific inhibitory peptides of KCa2 channels, Florian Wilhelmy for some ELISA measurements, and Emma Jane Esser for careful reading and corrections of the manuscript. This work was partly supported by a grant of the Alzheimer Forschung Initiative e.V. to CC.
Abbreviations
- KCNN/SK/IK/KCa2 channels
Small/intermediate-conductance Ca2+-activated potassium channels
- NMDA
N-Methyl-D-aspartate
- LPS
lipopolysaccharide
- TNF-α
tumor necrosis factor
- IL-6
interleukin 6
- NO
nitric oxide
- [Ca2+]i
intracellular calcium
- BKCa channels
large conductance Ca2+-activated potassium channels
- CyPPA
N-Cyclohexyl-N-[2-(3,5-dimethyl-pyrazol-1-yl)-6-methyl-4-pyrimidinamine
- DMEM
Dulbecco’s modified Eagle containing-calcium medium
- FCS
fetal calf serum
- OD
optical density
- MTT
3-(4,5-Dimethylthiazol-2-yl)-2,5-diphenyltetrazolium bromide
- DMSO
Dimethyl sulfoxide
- CI
index values
- NCIti
normalized cell index
- PFA
Paraformaldehyde
- MAPK
mitogen-activated protein kinase protein
- IIRK currents
inward rectifying potassium currents
- IDRK currents
voltage-gated and delayed rectifying potassium currents
- ICRAC currents
Ca2+-activated Ca2+ current
- TRPM4 channel
Transient receptor potential cation channel subfamily M member 4
- P2X(7) receptor
ATP-gated purinergic receptors
- TRAM-34
triarylmethane-34
- KATP channels
ATP-sensitive potassium channels
- MCAo
middle cerebral artery occlusion
Footnotes
Competing financial interests
The authors declare no competing financial interests.
References
- Allen D, Nakayama S, Kuroiwa M, Nakano T, Palmateer J, Kosaka Y, Ballesteros C, Watanabe M, Bond CT, Luján R, Maylie J, Adelman JP, Herson PS. SK2 channels are neuroprotective for ischemia-induced neuronal cell death. J Cereb Blood Flow Metab. 2011;31:2302–2312. doi: 10.1038/jcbfm.2011.90. [DOI] [PMC free article] [PubMed] [Google Scholar]
- Beck A, Penner R, Fleig A. Lipopolysaccharide-induced down-regulation of Ca2+ release-activated Ca2+ currents (I CRAC) but not Ca2+-activated TRPM4-like currents (I CAN) in cultured mouse microglial cells. J Physiol. 2008;586:427–439. doi: 10.1113/jphysiol.2007.145151. [DOI] [PMC free article] [PubMed] [Google Scholar]
- Bordey A, Spencer DD. Chemokine modulation of high-conductance Ca2+-sensitive K+ currents in microglia from human hippocampi. Eur J Neurosci. 2003;18:2893–2898. doi: 10.1111/j.1460-9568.2003.03021.x. [DOI] [PubMed] [Google Scholar]
- Boucsein C, Kettenmann H, Nolte C. Electrophysiological properties of microglial cells in normal and pathologic rat brain slices. Eur J Neurosci. 2000;12:2049–2058. doi: 10.1046/j.1460-9568.2000.00100.x. [DOI] [PubMed] [Google Scholar]
- Chan WY, Kohsaka S, Rezaie P. The origin and cell lineage of microglia—New concepts. Brain Res Rev. 2007;53:344–354. doi: 10.1016/j.brainresrev.2006.11.002. [DOI] [PubMed] [Google Scholar]
- Choi HB, Ryu JK, Kim SU, McLarnon JG. Modulation of the purinergic P2X7 receptor attenuates lipopolysaccharide-mediated microglial activation and neuronal damage in inflamed brain. J Neurosci. 2007;27:4957–4968. doi: 10.1523/JNEUROSCI.5417-06.2007. [DOI] [PMC free article] [PubMed] [Google Scholar]
- Diemert S, Dolga AM, Tobaben S, Grohm J, Pfeifer S, Oexler E, Culmsee C. Impedance measurement for real time detection of neuronal cell death. J Neurosci Methods. 2012;203:69–77. doi: 10.1016/j.jneumeth.2011.09.012. [DOI] [PubMed] [Google Scholar]
- Dolga AM, Granic I, Blank T, Knaus HG, Spiess J, Luiten PG, Eisel UL, Nijholt IM. TNF-alpha mediates neuroprotection against glutamate-induced excitotoxicity via NF-kappaB-dependent up-regulation of KCa2 channels. J Neurochem. 2008;107:1158–1167. doi: 10.1111/j.1471-4159.2008.05701.x. [DOI] [PubMed] [Google Scholar]
- Dolga AM, Terpolilli N, Kepura F, Nijholt IM, Knaus HG, D’Orsi B, Prehn JH, Eisel UL, Plant T, Plesnila N, Culmsee C. KCa2 channels activation prevents [Ca2+]i deregulation and reduces neuronal death following glutamate toxicity and cerebral ischemia. Cell Death Dis. 2011;2:e147. doi: 10.1038/cddis.2011.30. [DOI] [PMC free article] [PubMed] [Google Scholar]
- Farkas E, Annaházi A, Institóris A, Mihály A, Luiten PG, Bari F. Diazoxide and dimethyl sulphoxide alleviate experimental cerebral hypoperfusion-induced white matter injury in the rat brain. Neurosci Lett. 2005;373:195–199. doi: 10.1016/j.neulet.2004.10.007. [DOI] [PubMed] [Google Scholar]
- Goghari V, Franciosi S, Kim SU, Lee YB, McLarnon JG. Acute application of interleukin-1beta induces Ca2+ responses in human microglia. Neurosci Lett. 2000;281:83–86. doi: 10.1016/s0304-3940(00)00824-7. [DOI] [PubMed] [Google Scholar]
- Hanisch UK, Prinz M, Angstwurm K, Häusler KG, Kann O, Kettenmann H, Weber JR. The protein tyrosine kinase inhibitor AG126 prevents the massive microglial cytokine induction by pneumococcal cell walls. Eur J Immunol. 2001;31:2104–2115. doi: 10.1002/1521-4141(200107)31:7<2104::aid-immu2104>3.0.co;2-3. [DOI] [PubMed] [Google Scholar]
- Hoffmann A, Kann O, Ohlemeyer C, Hanisch UK, Kettenmann H. Elevation of basal intracellular calcium as a central element in the activation of brain macrophages (microglia): suppression of receptor-evoked calcium signaling and control of release function. J Neurosci. 2003;23:4410–4419. doi: 10.1523/JNEUROSCI.23-11-04410.2003. [DOI] [PMC free article] [PubMed] [Google Scholar]
- Hougaard C, Eriksen BL, Jørgensen S, Johansen TH, Dyhring T, Madsen LS, Strøbaek D, Christophersen P. Selective positive modulation of the SK3 and SK2 subtypes of small conductance Ca2+-activated K+ channels. Br J Pharmacol. 2007;151:655–665. doi: 10.1038/sj.bjp.0707281. [DOI] [PMC free article] [PubMed] [Google Scholar]
- Kaushal V, Koeberle PD, Wang Y, Schlichter LC. The Ca2+-activated K+ channel KCNN4/KCa3.1 contributes to microglia activation and nitric oxide-dependent neurodegeneration. J Neurosci. 2007;27:234–244. doi: 10.1523/JNEUROSCI.3593-06.2007. [DOI] [PMC free article] [PubMed] [Google Scholar]
- Keller C, Hellsten Y, Steensberg A, Pedersen BK. Differential regulation of IL-6 and TNF-alpha via calcineurin in human skeletal muscle cells. Cytokine. 2006;36:141–147. doi: 10.1016/j.cyto.2006.10.014. [DOI] [PubMed] [Google Scholar]
- Kettenmann H, Hanisch UK, Noda M, Verkhratsky A. Physiology of microglia. Physiol Rev. 2011;91:461–553. doi: 10.1152/physrev.00011.2010. [DOI] [PubMed] [Google Scholar]
- Kettenmann H, Hoppe D, Gottmann K, Banati R, Kreutzberg G. Cultured microglial cells have a distinct pattern of membrane channels different from peritoneal macrophages. J Neurosci Res. 1990;26:278–287. doi: 10.1002/jnr.490260303. [DOI] [PubMed] [Google Scholar]
- Koistinaho Koistinaho. Role of p38 and p44/42 Mitogen- Activated Protein Kinases in Microglia. Glia. 2002;40:175–183. doi: 10.1002/glia.10151. [DOI] [PubMed] [Google Scholar]
- Khanna R, Roy L, Zhu X, Schlichter LC. K+ channels and the microglial respiratory burst. Am J Physiol Cell Physiol. 2001;280:C796–C806. doi: 10.1152/ajpcell.2001.280.4.C796. [DOI] [PubMed] [Google Scholar]
- Launay P, Cheng H, Srivatsan S, Penner R, Fleig A, Kinet JP. TRPM4 regulates calcium oscillations after T cell activation. Science. 2004;306:1374–1377. doi: 10.1126/science.1098845. [DOI] [PubMed] [Google Scholar]
- Liva SM, Kahn MA, Dopp JM, de Vellis J. Signal transduction pathways induced by GM-CSF in microglia: significance in the control of proliferation. Glia. 1999;26:344–352. doi: 10.1002/(sici)1098-1136(199906)26:4<344::aid-glia8>3.0.co;2-l. [DOI] [PubMed] [Google Scholar]
- Marriott I, Bost KL, Mason MJ. Differential kinetics for induction of interleukin-6 mRNA expression in murine peritoneal macrophages: evidence for calcium-dependent and independent-signalling pathways. J Cell Physiol. 1998;177:232–240. doi: 10.1002/(SICI)1097-4652(199811)177:2<232::AID-JCP5>3.0.CO;2-O. [DOI] [PubMed] [Google Scholar]
- Möller T. Calcium signaling in microglial cells. Glia. 2002;40:184–194. doi: 10.1002/glia.10152. [DOI] [PubMed] [Google Scholar]
- Mott RT, Ait-Ghezala G, Town T, Mori T, Vendrame M, Zeng J, Ehrhart J, Mullen M, Tun J. Neuronal expression of CD22: Novel mechanism for inhibiting microglial proinflammatory cytokine production. Glia. 2004;46:369–379. doi: 10.1002/glia.20009. [DOI] [PubMed] [Google Scholar]
- Pedarzani P, D’hoedt D, Doorty KB, Wadsworth JD, Joseph JS, Jeyaseelan K, Kini RM, Gadre SV, Sapatnekar SM, Stocker M, Strong PN. Tamapin, a venom peptide from the Indian red scorpion (Mesobuthus tamulus) that targets small conductance Ca2+-activated K+ channels and afterhyperpolarization currents in central neurons. J Biol Chem. 2002;277:46101–46109. doi: 10.1074/jbc.M206465200. [DOI] [PubMed] [Google Scholar]
- Pedarzani P, Stocker M. Molecular and cellular basis of small- and intermediate-conductance, calcium-activated potassium channel function in the brain. Cell Mol Life Sci. 2008;65:3196–3217. doi: 10.1007/s00018-008-8216-x. [DOI] [PMC free article] [PubMed] [Google Scholar]
- Reynolds IJ, Hastings TG. Glutamate induces the production of reactive oxygen species in cultured forebrain neurons following NMDA receptor activation. J Neurosci. 1995;15:3318–3327. doi: 10.1523/JNEUROSCI.15-05-03318.1995. [DOI] [PMC free article] [PubMed] [Google Scholar]
- Rupalla K, Allegrini PR, Sauer D, Wiessner C. Time course of microglia activation and apoptosis in various brain regions after permanent focal cerebral ischemia in mice. Acta Neuropathol. 1998;96:172–178. doi: 10.1007/s004010050878. [DOI] [PubMed] [Google Scholar]
- Sailer CA, Kaufmann WA, Marksteiner J, Knaus HG. Comparative immunohistochemical distribution of three small-conductance Ca2+-activated potassium channel subunits, SK1, SK2, and SK3 in mouse brain. Mol Cell Neurosci. 2004;26:458–469. doi: 10.1016/j.mcn.2004.03.002. [DOI] [PubMed] [Google Scholar]
- Saura J, Tusell JM, Serratosa J. High-yield isolation of murine microglia by mild trypsinization. Glia. 2003;44:183–189. doi: 10.1002/glia.10274. [DOI] [PubMed] [Google Scholar]
- Schlichter LC, Kaushal V, Moxon-Emre I, Sivagnanam V, Vincent C. The Ca2+ activated SK3 channel is expressed in microglia in the rat striatum and contributes to microglia-mediated neurotoxicity in vitro. J Neuroinflammation. 2010;7:4. doi: 10.1186/1742-2094-7-4. [DOI] [PMC free article] [PubMed] [Google Scholar]
- Liu BS, Ferreira R, Lively S, Schlichter LC. Microglial SK3 and SK4 Currents and Activation State are Modulated by the Neuroprotective Drug, Riluzole. J Neuroimmune Pharmacol. 2012 doi: 10.1007/s11481-012-9365-0. Epub ahead of print. [DOI] [PubMed] [Google Scholar]
- Skaper SD. Ion channels on microglia: therapeutic targets for neuroprotection. CNS Neurol Disord Drug Targets. 2011;10:44–56. doi: 10.2174/187152711794488638. [DOI] [PubMed] [Google Scholar]
- Stocker M. Ca2+-activated K+ channels: molecular determinants and function of the SK family. Nat Rev Neurosci. 2004;10:758–770. doi: 10.1038/nrn1516. [DOI] [PubMed] [Google Scholar]
- Tuteja D, Rafizadeh S, Timofeyev V, Wang S, Zhang Z, Li N, Mateo RK, Singapuri A, Young JN, Knowlton AA, Chiamvimonvat N. Cardiac small conductance Ca2+-activated K+ channel subunits form heteromultimers via the coiled-coil domains in the C termini of the channels. Circ Res. 2010;107:851–859. doi: 10.1161/CIRCRESAHA.109.215269. [DOI] [PMC free article] [PubMed] [Google Scholar]
- Wulff H, Miller MJ, Hansel W, Grissmer S, Cahalan MD, Chandy KG. Design of a potent and selective inhibitor of the intermediate-conductance Ca2+-activated K+ channel, IKCa1: a potential immunosuppressant. Proc Natl Acad Sci U S A. 2000;97:8151–8156. doi: 10.1073/pnas.97.14.8151. [DOI] [PMC free article] [PubMed] [Google Scholar]