Abstract
Leishmania major peroxidase (LmP) exhibits both ascorbate and cytochrome c peroxidase activities. Our previous results illustrated that LmP has much higher activity against horse heart cytochrome c than ascorbate suggesting that cytochrome c may be the biologically important substrate. In order to elucidate the biological function of LmP, we have recombinantly expressed, purified and determined the 2.08Å crystal structure of Leishmania major cytochrome c (LmCytc). Like other cytochromes c LmCytc has an electropositive surface surrounding the exposed heme edge that serves as the docking site with redox partners. Kinetic assays performed with LmCytc and LmP show that LmCytc is a much better substrate for LmP than horse heart cytochrome c. Furthermore, unlike the well-studied yeast system, the reaction follows classic Michaelis-Menten kinetics and is sensitive to increasing ionic strength. Using the yeast co-crystal as a control, protein-protein docking was performed using Rosetta to develop a model for the binding of LmP and LmCytc. These results suggest that the biological function of LmP is to act as a cytochrome c peroxidase.
S. cervesiae cytochrome c peroxidase (abbreviated CCP) has long served as a paradigm for interprotein electron transfer (1). CCP and other heme peroxidases form distinct spectroscopically well defined intermediates called Compounds I and II in the following reaction cycle.
| (1) |
| (2) |
| (3) |
The intermediate Compound I forms once H2O2 is heterolytically cleaved, releasing a water molecule. The remaining O atom oxidizes the heme iron to Fe(IV) and an organic moiety, R, to a cation radical. For most heme peroxidases, R is the porphyrin ring (2). Upon two electron transfer events from two substrate molecules, S, the enzyme returns to the resting state with water occupying the active site. The types of substrates oxidized by various peroxidases include ascorbate, lignin, manganese and a variety of small aromatic organic molecules. CCP, however, uses another protein, cytochrome c, as its substrate. Moreover, CCP forms a unique Compound I radical on Trp191 which is adjacent to the proximal His ligand (3).
Not surprisingly, yeast is not unique in having a CCP but to date only one other CCP-like peroxidase, Leishmania major peroxidase (LmP), has been well characterized (4–6). Trp208 in LmP is analogous to Trp191 in CCP and Yadav et al showed that the Trp208Phe mutant exhibits dramatically decreased activity (6). We recently solved the crystal structure of LmP and found, using mutagenesis and EPR spectroscopy, that Trp208 does form a stable radical as does Trp191 in yeast CCP and that, like CCP, the local electrostatic environment stabilizes the cationic Trp208 radical (7–12).
Although LmP was initially characterized as a dual peroxidase with both ascorbate and cytochrome c peroxidase activities (4), the close similarity to yeast CCP and the location of LmP in L. major mitochondria (13) strongly suggests that the biological substrate for LmP is Cytc. Moreover, our highly purified LmP used for crystallization exhibits good activity toward horse heart Cytc although the activity is still well below that of yeast CCP. As might be expected, yeast Cytc is a better substrate for yeast CCP than other Cytcs and we can anticipate that L. major Cytc should be a better substrate for LmP. We therefore have purified and solved the crystal structure of L. major Cytc (LmCytc), characterized the reaction between LmP and LmCytc, and developed a model of the LmP-LmCytc complex.
EXPERIMENTAL PROCEDURES
Cloning
The sequence of cytochrome c from Leishmania major (strain Friedlin) was obtained from GenBank (14). LmCytc was synthesized by GenScript ®, with optimized codons for E. coli expression, into the construct pBPCYC1, replacing yeast cytochrome c (15).
Protein Expression and Purification
The LmCytc plasmid was transformed into E. coli BL21(DE3) cells and plated onto LB agar with ampicillin (100 μg/ml). One colony was picked and grown in LB Miller and ampicillin (100 μg/ml), overnight at 37°C and 220 rpm agitation. Expression cultures of TB media with ampicillin (100 μg/ml) were inoculated with the overnight culture (1:100). The cells were grown at 37°C with agitation of 220 rpm in a New Brunswick ® Scientific C25KC incubator. After 24 h, cells were harvested by centrifugation and stored at - 80°C. Cells were thawed overnight at 4°C and resuspended by stirring for 1 h at 4°C in 500 mM potassium phosphate pH 6.4, 0.5 mM PMSF, 2 mM MgCl2100 μg/mL lysozyme, 0.2 μg/mL DNAse and 0.2 μg/mL leupeptin. Sonication on ice for 5 min at intervals of 1 min (sonicate 1 min - rest 1 min) insured efficient lysis. The soluble fraction was isolated by centrifugation at 37,500 g, 4°C for 1 h. The lysate (~100 mL) was then dialyzed against 4 L of 10 mM potassium phosphate pH 6.4 for 4 h, 4°C and placed into fresh buffer for an overnight dialysis at 4°C. Precipitated proteins were then separated from the lysate by centrifugation at 10,800 g, 4°C for 30 min. The supernatant was pooled and the heme iron was oxidized with ~70 mg of potassium ferricyanide. The ionic strength was reduced to 5 mM by addition of autoclaved water. The lysate was then loaded onto a 25 ml CM Sepharose gravity column at a rate of 3 ml/min at 4°C, that had been pre-equilibrated with 10 mM sodium phosphate pH 6.4. The column was washed with 20 column volumes (CV) of 10 mM potassium phosphate pH 6.4. The protein was eluted with a gradient of 10 mM – 250 mM potassium phosphate pH 6.4. The fractions with Rz (A414/A280) values between 3.2–4.5 were pooled and loaded onto a Superdex 75 26/60 column that had been pre-equilibrated with 50 mM potassium phosphate pH 7.0, 5% glycerol at a flow rate of 0.5 ml/min at 4°C. The resulting fractions were analyzed by a 15% SDS-PAGE and the most pure fractions were pooled. The resulting sample had an Rz (A414/A280) of 4.2. The protein concentration of LmCytc was calculated with the molar extinction coefficient, ε280 = 27.1 mM−1cm−1, determined using the Pierce® Modified Lowry Protein Assay Kit with horse heart cytochrome c (Sigma-Aldrich ®) used as the sample for the standard curve. The heme content of LmCytc was 97%, as determined with the hemochromagen assay used previously (12, 16). It is worth mentioning that LmCytc has a non-standard c-type heme group because it conserves only one Cys residue and can only form one thioether linkage between the heme vinyl group and Cys. This resulted in a different spectrum for the hemochromagen assay and the maximum used to calculate LmCytc heme content was at 552 nm as opposed to 550 nm, which is the value for horse heart cytochrome c or any standard c-type heme groups (16, 17). The Soret molar extinction coefficient of oxidized LmCytc was determined to be ε414=115.6 mM−1cm−1. The molar extinction coefficient of reduced LmCytc was determined to be ε558red= 29 mM−1cm−1 by complete reduction of LmCytc with excess sodium dithionite. LmP was expressed and purified as previously described (12).
Determination of Reduced LmCytc Extinction Coefficient Enzymatically
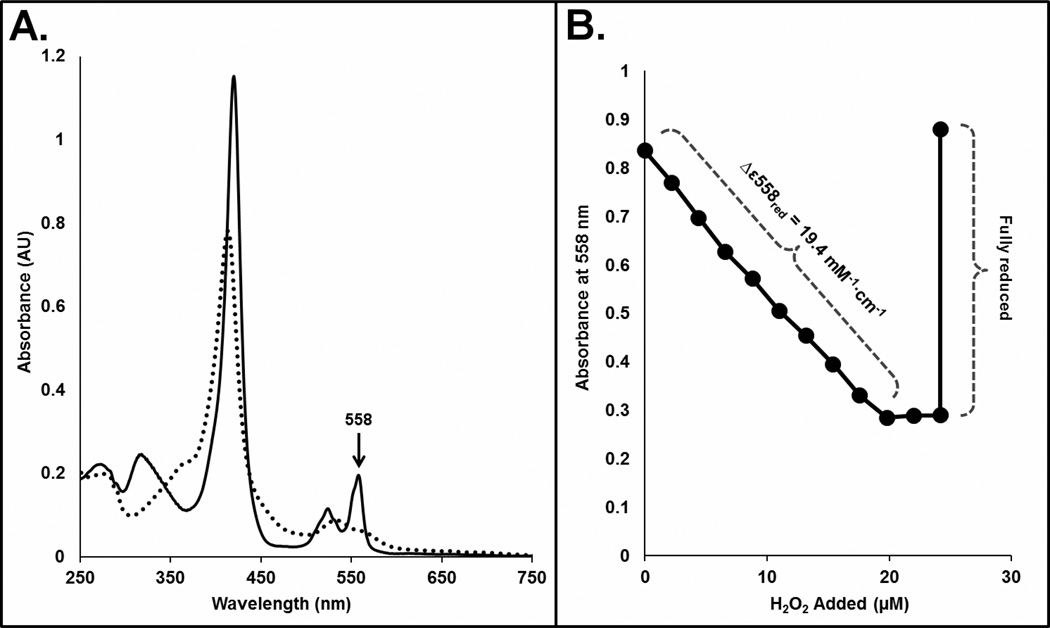
The reduced spectrum of LmCytc exhibits a unique maximum at 558 nm (Figure 1A). In order to ensure this maximum was the best one for use in enzyme kinetics, a simple dithionite titration was first completed by addition of 2 nmoles of sodium dithionite to 10.5 nmoles of LmCytc (data not shown). As expected the 558 nm peak increased with increasing sodium dithionite. The molar extinction coefficient for oxidation of LmCytc was determined enzymatically to be Δε558=19.4 mM−1cm−1using the same protocol used for horse heart and yeast cytochrome c (18). Briefly, in a cuvette containing 30 μM of reduced LmCytc and 50 nM LmP, 2.2 μM H2O2 was titrated until LmCytc was fully oxidized (Figure 1B).
Figure 1.
A, Oxidized (dashed line) and reduced (solid line) UV-Vis spectra of LmCytc. The maxima used to follow oxidation of reduced LmCytc by LmP is at 558 nm. B, Determination of Δε558red enzymatically. Aliquots of 2.2 μM H2O2 was added until LmCytc could no longer be oxidized by LmP. The ε558 of the enzymatically oxidized sample was determined to be 9.6 mM−1•cm−1 so that Δε558red was calculated to be 19.4 mM−1•cm−1. The sample was then fully reduced by addition of granules of sodium dithionite.
Steady-State Activity Assays
Spectrophotometric steady-state activity assays using reduced LmCytc were performed at room temperature using a Cary 3E UV-visible spectrophotometer. LmCytc was reduced by adding granules of sodium dithionite and incubated on ice for 30 minutes. Dithionite was removed by gel filtration over a G10 Sephadex column pre-equilibrated with 50 mM potassium phosphate pH 7.0. After dithionite removal LmCytc was then concentrated in a 10K MWCO centricon at 4°C so that a smaller volume could be used without altering the reaction conditions in the cuvette. The concentration of reduced LmCytc was determined using the molar extinction coefficient, ε558red = 29 mM−1cm−1 and the steady-state oxidation of reduced LmCytc was calculated using Δε558 = 19.4 mM−1cm−1. Over the course of a 4–5 hour enzyme assay experiment, approximately 9% of the LmCytc spontaneously oxidized.
LmP concentration was determined using the Soret molar extinction coefficient, ε408 = 113.6 mM−1cm−1 (12). Hydrogen peroxide was standardized as outlined by Fowler and Bright (19). For ionic strength and pH dependencies, LmP was freshly diluted to a working concentration of 5 nM in the appropriate reaction buffer for each condition. The final reaction was carried out in 1 ml of buffer with the following concentrations: 50 pM LmP, 30 μM of reduced LmCytc and 0.180 mM hydrogen peroxide. For the determination of KMthe assays were completed in 25 mM potassium phosphate pH 6.5, 50 pM LmP and 0.180 mM hydrogen peroxide. The reaction was initiated by addition of hydrogen peroxide and monitored for 1 min.
Crystallization of LmCytc
The Pre-Crystallization Test (Hampton ®) was used to determine the most promising range of protein concentrations, 450 μM, for the initial screenings of LmCytc. Using a high throughput nanoliter dispensing robot, the Mosquito®, an initial crystallization condition was identified: 1.6 M Tri-sodium Citrate pH 6.5 at room temperature. These crystals were long, delicate needle clusters that shattered and disappeared upon any attempt to harvest. Various attempts to optimize this condition proved unsuccessful. Optimization was completed by changing the buffer from 50 mM potassium phosphate pH 7.0 to 50 mM potassium phosphate pH 6.4 and rescreening various commercial crystallization kits. Larger crystal rods were found in 30% PEG 2K MME, 0.1 M potassium bromide, using hanging drop vapor diffusion at room temperature. These crystals had a two-dimensional rod morphology and were often not single crystals. Even crystals that appeared single resulted in un-useable data sets owing to high mosaicity. Optimizations between 35–40% PEG 2K MME and 0.15–0.3 M potassium bromide led to one crystal from ~150 drops with a clear three-dimensional triangular morphology. For cryo, 1 μl of 35% PEG 2K MME, 25 mM potassium phosphate pH 6.4, 0.17 potassium bromide, 5% glycerol and 2.5% PEG 200 was added to the crystal drop. This was allowed to sit for 5 min. and the crystal was then transferred to washes of the same conditions except increasing PEG 200, from 5%, 10% and finally to 16%.
Structural Determination and Refinement
A 2.08Å resolution data set was collected using an in-house Rigaku micro-max 007 rotating anode with a Saturn 944 detector and belong to space group P212121 with one molecule per asymmetric unit. The LmCytc structure was solved by molecular replacement with yeast cytochrome c used as the search model (PDB: 1YCC). Data were indexed, integrated and scaled using HKL2000 (20). Molecular replacement calculations were carried out with Phaser (21) through the CCP4i graphic interface (22, 23). COOT was used to manually replace the appropriate residues (24, 25). Refinement was completed with phenix refine (26, 27). Coordinate and structure factor files were deposited in the Protein Data Bank (PDB: 4DY9). Crystallographic data collection and refinement statistics are provided in Table 1 where all Rfree values are calculated with 5% of the data excluded from refinements.
Table I.
Crystallographic Data Collection and Refinement Statistics.
| Data Set | LmCytc |
|---|---|
| Space Group | P212121 |
| Unit Cell Dimensions (a, b, c in Å) | 35.280, 44.000, 64.3798 |
| Resolution Range (Å) | 36.3 – 2.08 |
| Radiation Source | Rigaku ® MicroMax- 007HF |
| Wavelength (Å) | 1.54 |
| Total Observations | 63,083 |
| Unique Reflections (Highest Shell) | 11,498 (534) |
| Completeness, % (Highest Shell) | 99.1 (97.8) |
| Rsym (Highest Shell) | 0.043 (0.068) |
| <I/σ> (Highest Shell) | 64.3 (38.6) |
| Wilson B Factor | 17 |
| Reflections Used in Refinement | 6,330 |
| Resolution Range (Å) in Refinement | 22.0 – 2.08 |
| Rwork | 0.1611 |
| Rfree | 0.2117 |
| r.m.s. bonds | 0.007 |
| r.m.s. angles | 1.214 |
Rosetta Docking
For global docking, LmP and LmCytc were aligned over the yeast co-crystal structure (PDB: 2PCC) in PyMOL with RMS deviations of 0.7 and 0.8, respectively (28). The resulting coordinates were then prepacked using Rosetta 3.2.1 with the following flags: - use_input_sc -ex1 -ex2aro -partners A_B (where LmCytc is rotated around LmP) and – unboundrot (where the single unbound coordinates were defined). LmP and LmCytc were then globally docked and locally refined. The heme and cations were included in the prepacking and docking process. The yeast system was prepacked, globally docked and locally refined in the same manner. The crystal structure of E. caballus (horse heart, hh) cytochrome c with yeast CCP (PDB: 2PCB) was globally docked and locally refined in the same manner as the entire yeast and L. major system, except that prepacking resulted in bad contacts so the starting structure was the native crystal structure for each docking attempt. The unbound structures were defined using the following structures: yeast CCP (PDB: 2CYP), yeast Cytc (PDB: 1YCC), horse heart (hh) Cytc (PDB: 1HRC), LmP (PDB: 3RIV) and LmCtyc (PDB: 4DY9). The details of the various docking protocols are outlined in Table 2.
Table II.
Rosetta docking parameters
| System | Docking Type |
Flags | Structures Generated |
Input Structure | Plot (Figure 4) |
Lowest Energy |
RMSD |
|---|---|---|---|---|---|---|---|
| 2PCC, CCP & Cytc |
Global | use_input_sc, ex1, ex2aro, unboundrot |
1,000 | Prepacked | A. | −318.2 | 10.2 |
| 2PCC, CCP & Cytc |
Local Refinement |
use_input_sc, ex1, ex2aro, unboundrot, docking_local_refine |
1,000 | Prepacked | B. | −455.8 | 4.2 |
|
L. major, LmP & LmCytc |
Global | use_input_sc, ex1, ex2aro, unboundrot |
10,000 | Aligned over 2PCC & Prepacked |
C. | −433.9 | 11.6 |
|
L. major, LmP & LmCytc |
Local Refinement |
use_input_sc, ex1, ex2aro, unboundrot, docking_local_refine |
10,000 | Aligned over 2PCC & Prepacked |
D. | −438.3 | 2.5 |
Results and Discussion
Crystal Structure of LmCytc
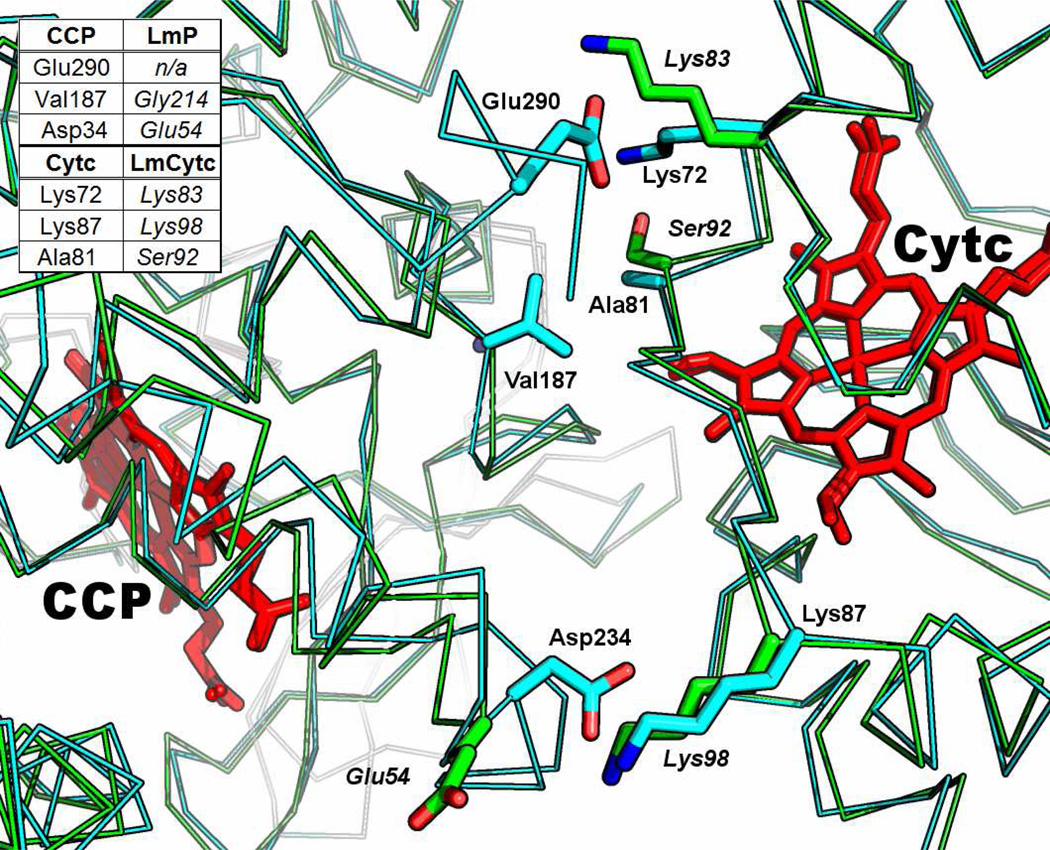
The structure of LmCytc is very similar to that of yeast Cytc, with a RMSD of 0.70Å for 94 common Cα ?atoms, as determined in PyMOL. LmCytc has a unique Nterminal sequence with an extra 10 residues than horse heart and yeast Cytc but there is no electron density for the first five residues. LmCytc also differs from most other Cytcs by having only one thioether bond formed between a Cys residue and one heme vinyl group rather than two. This difference probably accounts for the slight spectral differences between LmCytc and yeast Cytc. Most important for docking to redox partners is the distribution of charges surrounding the exposed heme edge. Here LmCytc closely resembles yeast Cytc showing that that binding interface of the Cytcs are highly conserved (Figure 2). However, the binding interfaces of CCP and LmP are noticeably different. For example, Glu290 in CCP is not present in LmP because it lacks this entire C-terminal region. The hydrophobic interaction between Val187 in CCP and Ala81 in Cytc is not present in the Lm system, which has Gly214 and Ser92 at the analogous positions. This indicates that the LmP-LmCytc complex may differ in both structure and dependence on other environment parameters such as ionic strength. We therefore characterized the steady state activity of LmP using LmCytc as a substrate.
Figure 2.
Alignment of LmP and LmCytc (green) over the co-crystal coordinates of the yeast system (PDB: 2PCC) (cyan). ITC studies illustrated that these residues in the yeast system affect CCP and Cytc complex formation (33). Italicized labels correspond to the Lm system. Figs 2, 5 & 7 were generated with the PyMOL molecular graphics system, Schrödinger, LLC.
Steady State Activity Assays
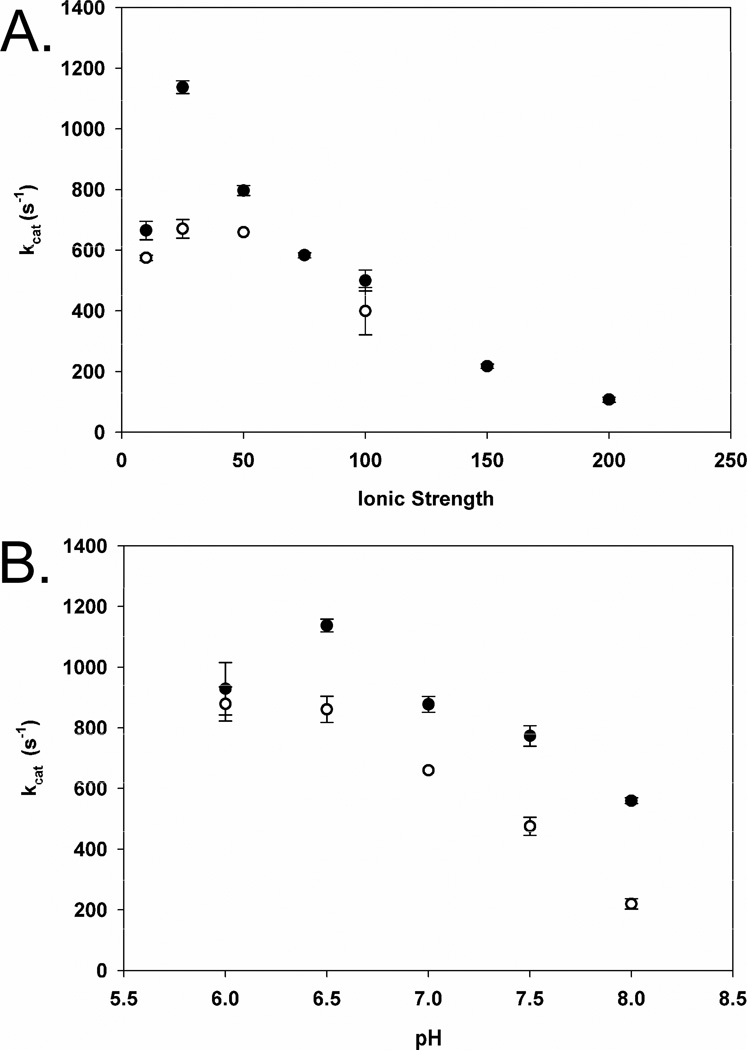
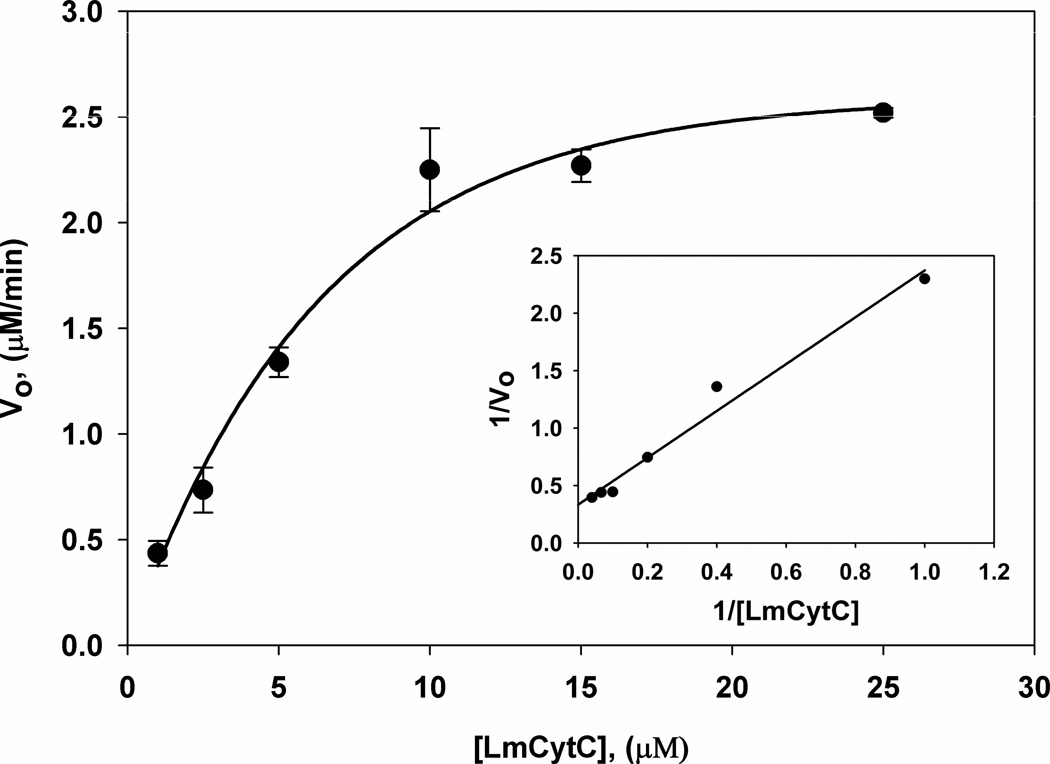
LmP exhibits ~2-fold increase in cytochrome c activity with its endogenous substrate, LmCytc, versus previous kinetics with horse heart Cytc (12). Optimal activity occurs at 25 mM potassium phosphate pH 6.5 (Figure 3). LmP activity also is very sensitive to ionic strength. Increasing the ionic strength, above 25 mM, results in a steady decrease of activity and at 200 mM potassium phosphate pH 6.5 nearly 90% activity is lost. This sharply contrasts with yeast CCP where the activity increases with increasing ionic strength up to about 100 mM and then decreases with increasing ionic strength (30). KM and kcat were determined by using the equation from the best fit line of the Lineweaver-Burk plot (Figure 4). KM is 6 μM and the efficiency (kcat/KM) is 1.6×10⁸ M−1s−1 which is the same order of magnitude as the yeast system (30). LmP also obeys simple Michaelis-Menten kinetics. This is quite different than the yeast CCP where Eadie-Hofstee plots show a break which has been attributed to a second binding site for Cytc (30).
Figure 3.
A, Ionic strength dependency of LmP oxidation of LmCytc. Closed circles represent potassium phosphate pH 6.5 while open circles are potassium phosphate 7.0. B, LmP oxidation of LmCytc versus pH. Closed circles are 25 mM potassium phosphate and open circles are 50 mM potassium phosphate. The highest turnover was achieved at 25 mM potassium phosphate pH 6.5 in both the ionic strength assays and the pH dependency assay.
Figure 4.
Michealis-Menten curve of LmP oxidation of LmCytc. KM and kcat used to determine efficiency (kcat/KM) were calculated using the equation obtained from the Lineweaver-Burk plot (inset). The reaction conditions were: 25 mM potassium phosphate pH 6.5, 50 pM LmP and 0.180 mM hydrogen peroxide.
That LmCytc is a better substrate than horse heart Cytc can be partially rationalized based on subtle differences between the structures of the various Cytcs. Using the yeast CCPCytc complex as a guide (28), the location of Lys and Arg residues are the same in Lm, yeast, and horse heart (29) (1HRC) at the binding interface. Towards the periphery of the complex where both yeast and horse heart Cytc have Lys27, LmCytC has Gly38 and where LmCytc has Ser36, horse heart has Lys25 and yeast has Pro25. The main difference directly at the interface is that Ser92 in LmCytc is Ala82 in yeast and Ile81 in horse heart. Therefore, horse heart Cytc has a much bulkier amino acid, Ile vs Ala, at the interface. This may be one reason horse heart Cytc is not as good a substrate as LmCytc.
Computer Docking
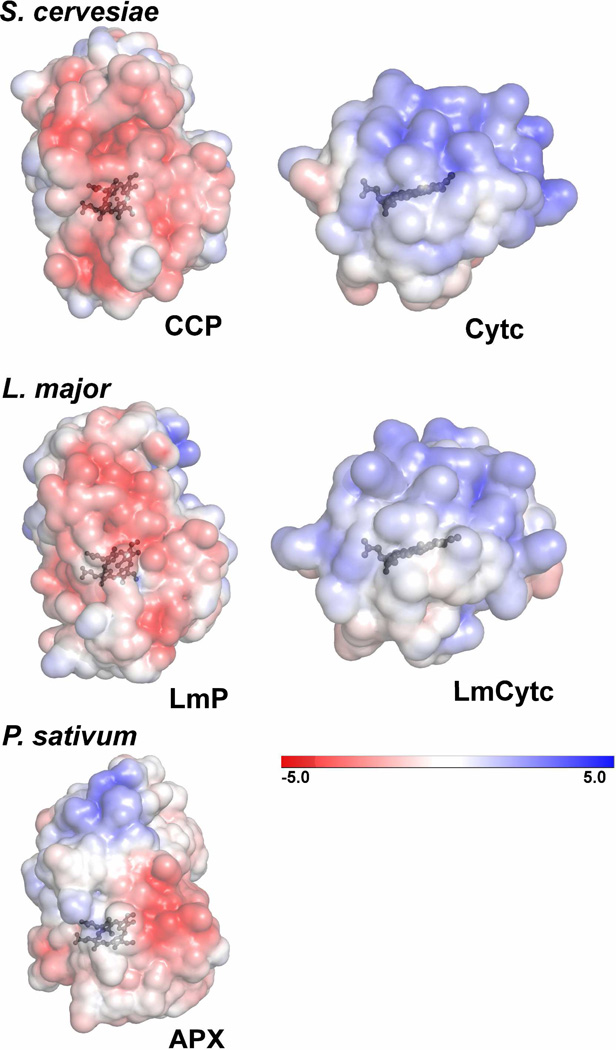
The electrostatic surface potential of S. cervesiae CCP and Cytc illustrates why the binding of these partners is electrostatically driven (Figure 5). LmP and LmCytc have the same complementary electrostatic binding surfaces as their yeast counterparts, although not as intense. LmP and CCP both have a blanket distribution of negative electrostatic potential on the Cytc binding surface while both yeast Cytc and LmCytc have strong positive potentials on the corresponding interface. Since LmP and LmCytc are electrostatically so similar to yeast CCP and Cytc, we had high confidence in using the yeast co-crystal coordinates as the template for LmP and LmCytc docking. To develop a model of the LmP-LmCytc complex we start by simply sumperimposing the two Lm proteins on to their yeast counterparts. The resulting model shows significant steric clashes at the inter-protein interface and simple side chain torsion angle adjustments will not relieve these clashes although minor translations of LmCytc over the surface of LmP will relieve close contacts. To obtain a more objective model of the complex we employed computer docking as implemented in the Rosetta package of programs (31– 33).
Figure 5.
Electrostatic surface representations (±5kT) of S. cervesiae CCP and Cytc, L. major LmP and LmCytc and as a control, cytosolic pea ascorbate peroxidase (APX). These surfaces are the same that would be involved in substrate binding as determined by the co-crystal structure of the S. cervesiae system (PDB: 2PCC). Both the S. cervesiae and L. major heme peroxidases have an overall distribution of negative charge at the Cytc binding interface while the respective Cytc substrates have a clearly positive distribution. P. sativum APX does not have a strong distribution of negative charge on the same surface. These figures were generated with the Adaptive Poisson-Boltzmann Solver (APBS) plug-in using PyMOL (34).
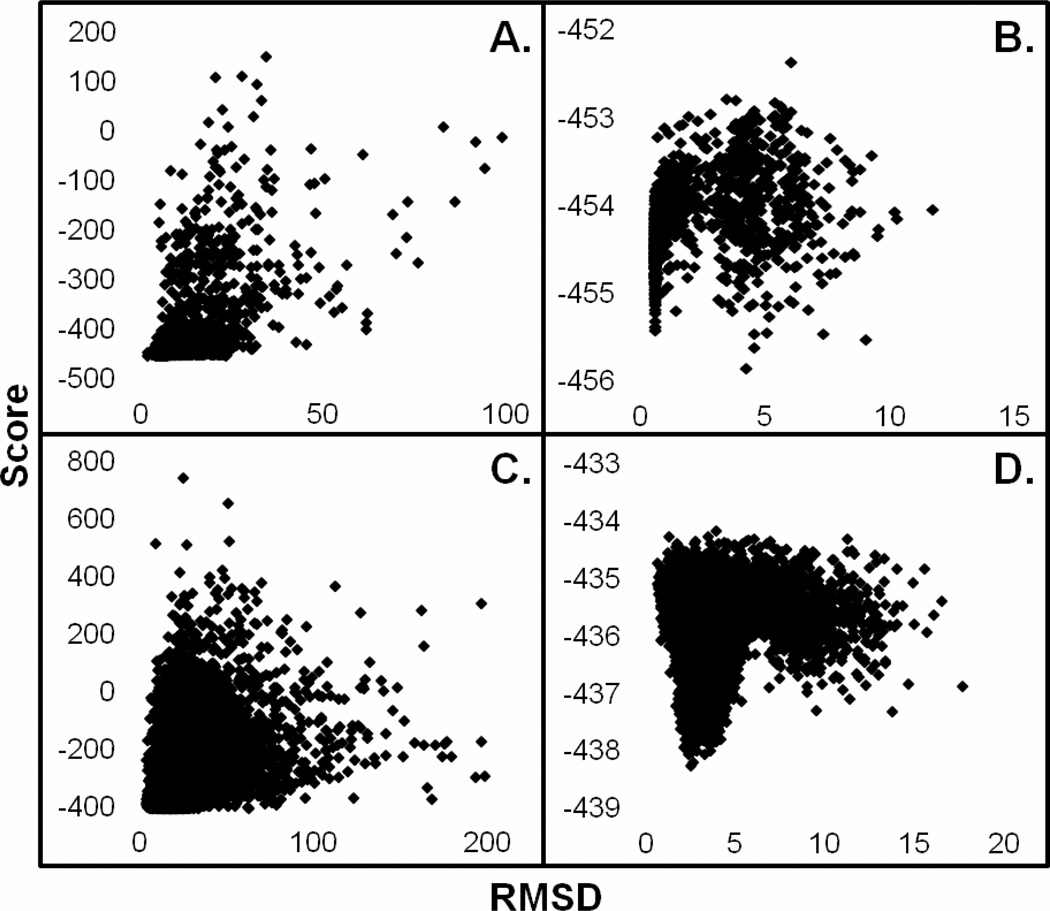
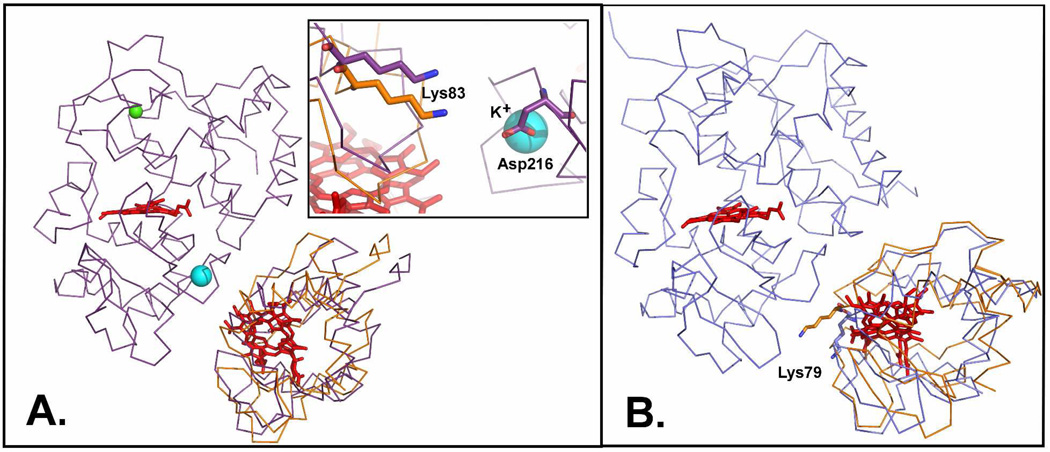
We began by using the yeast CCP system as a control which also was used by Gray et al in testing Rosetta (32). One approach in using Rosetta is to optimize side chain torsion angles on the individual redox partners first which is called prepacking. The docking run then is initiated starting with the CCP-Cytc complex as observed in the crystal structure. The docking run is either global where the entire surface of CCP is sampled by Cytc or local refinement where Cytc is allowed only small perturbations from the initial complex. Docking results of high confidence from Rosetta are typically identified at the bottom of a characteristic “funnel” obtained by plotting the RMSD from the starting complex versus an energy score of the resulting structures. As shown in Fig. 6 reasonable funnels are obtained for local searches but not global. In other systems good funnels are observed where the correct docked complex is unique and tight as in antibody-antigen interactions. Electron transfer complexes like CCP-Cytc, however, are not in this class of "hand-in-glove" fit but can be thought of as two oppositely charged surfaces forming a complex where the differences in interaction energy between the electron transfer active complex and other less productive complexes is small. In other words, such complexes are "dynamic" as evidenced by recent NMR studies (34). Therefore, it is not too surprising that the funnel is not very well defined for a global search while the funnel is better defined during the local refinement searches, when the Cytc is restricted to sample the surface within of the starting model. The best (lowest energy) Rosetta model exhibits a RMSD of 4.2Å from the starting structure. Fig. 7 shows the Rosetta model superimposed on the crystal structure. A close examination of the structures suggests that in the Rosetta model Cytc rotates from its starting position to enable Lys79 in Cytc to form more optimal interactions with CCP but in the crystal structure Lys79 does not interact with CCP at all. In the crystal structure ordered solvent is situated between CCP and Cytc and this is not taken into account in Rosetta so direct inter-protein electrostatic interactions dominate in Rosetta. Even so the Rosetta model is a close approximation to the crystal structure and the 4.2Å RMSD from the starting crystal structure provides an estimate of error for docking LmCytc to LmP.
Figure 6.
Rosetta docking results of RMSD versus score for the S. cervesiae (PDB: 2PCC) and L. major systems. Global searches for the yeast (A) and the Lm (C) system exhibit similar trends. The local refinement of the yeast system (B) illustrates a pseudo-funnel. The presence of a high confidence funnel is visible in the local refinement search of LmP (D).
Figure 7.
Input and output structures from Rosetta docking. A, LmP prepacked input structure is colored purple. The lowest RMSD output of LmCytc is orange. Rosetta optimized ionic interactions, such as Asp216 and Lys83 (inset). The large cyan sphere is a potassium ion bound in LmP which is not present in yeast CCP. B, CCP and Cytc co-crystal coordinates (PDB: 2PCC); the input structure is colored blue. The lowest RMSD output of cytc is orange. Lys79 is shifted to more favorably interact with CCP.
The lowest energy Rosetta model for the LmP-LmCytc local docking using the same prepacking protocol used for the yeast system exhibits a RMSD of only 2.5Å from the starting model (Fig, 7) and indicates that the LmP-LmCytc complex is very similar to the yeast complex. The Rosetta model also predicts some distinct differences between the yeast and Lm redox pairs. In the LmP-LmCytc complex Lys83 of LmCytc is about 4Å from Asp216 in LmP. The residue corresponding to Asp216 in yeast CCP is Thr199 so the Lm system has the potential of making at least one strong inter-protein ion pairing not possible in the yeast system. It also should be noted that Asp216 is within 3.9Å of the K+ ion in LmP. A monovalent cation is also found at this position in APX and is Ca2+ in many other peroxidases while yeast CCP has water at this location rather than a cation.
We ran one additional control using horse heart Cytc. It is well known that, compared to yeast Cytc, horse heart Cytc is a poorer substrate for yeast CCP (30). In addition, the crystal structure of the yeast CCP-horse heart Cytc also exhibits subtle but distinct differences from the CCP-yeast Cytc complex (28). Rosetta docking using horse heart Cytc (data not shown) shows no well defined funnel for either global or local docking. Thus the non-physiological complex gives the poorest docking results.
Conclusions
In this study we have shown that LmCytc is a much better substrate for LmP than horse heart Cytc and that the activity approaches that of yeast CCP. Given the location of LmP in the mitochondria (13) and a much higher level of activity toward LmCytc, we conclude that the biological function of LmP is to oxidize LmCytc. The crystal structure of LmCytc has enabled us to develop a model of the LmP-LmCytc complex using the yeast system as a guide. The computer docked model is very close to the yeast CCP-Cytc crystal structure although there are some distinct differences. The crystal structure shows that there are no direct ion pairs in the yeast CCP-Cytc complex but Rosetta attempts to optimize ion pairing by rotating Cytc in such a way as to enable Lys79 to come within 4.1Å of Glu201 in CCP. This movement of Cytc requires disruption of non-bonded contacts involving Ala194 and Val197 in CCP with Ala81 in Cytc. It thus appears that Rosetta favored charge-charge interactions at the expense of nonpolar interactions. LmP cannot form the same nonpolar interactions as in CCP. The residues corresponding to CCP Ala194 and Val197 in LmP are Asp211 and Gly241 so nonpolar interactions may be less important in the LmP-LmCytc complex. Moreover, LmP-LmCytc can form one ion pair not possible in the yeast redox partners. These differences correlate well with differences in ionic strength dependence. In yeast CCP, activity increases with increasing ionic strength which will promote nonpolar interactions. As the ionic strength increases above 100mM, activity decreases owing to electrostatic masking. Thus the yeast CCP system is a balance between nonpolar and electrostatic interactions. However, the LmP-LmCytc system exhibits a steady decrease in activity with increasing ionic strength suggesting that nonpolar interactions are less important and that electrostatic interactions dominate. As noted, these experimental differences correlate well with distinct difference at the docking interfaces, adding a level of confidence that our model of LmP-LmCytc complex is a very good approximation of the physiologically relevant complex.
Acknowledgments
We thank Dr. Yergalem T. Meharenna for designing and ordering the LmCytc expression construct from GenScript ® and Taylor R. Page (Northwestern University) for his streamlined Cytc expression and purification protocols which expedited purification of LmCytc. We also thank Prof. Grant A. Mauk (University of British Columbia) for the pBTR1 yeast iso-1- cytochrome c expression system.
Abbreviations
- RMSD
root square mean deviation
- LmP
Leishmania major peroxidase
- LmCytc
Leishmania major cytochrome c
- CCP
S. cervesiae cytochrome c peroxidase
- Cytc
cytochrome c
- LB
Luria broth
- TB
Terrific broth
- CV
column volume
- Rz
Reinheits Zahl
References
- 1.Volkov AN, Nicholls P, Worrall JA. The complex of cytochrome c and cytochrome c peroxidase: the end of the road? Biochim. Biophys. Acta. 2011;1807:1482–1503. doi: 10.1016/j.bbabio.2011.07.010. [DOI] [PubMed] [Google Scholar]
- 2.Dolphin D, Forman A, Borg DC, Fajer J, Felton RH. Compounds I of catalase and horse radish peroxidase: pi-cation radicals. Proc. Natl. Acad. Sci. U S A. 1971;68:614–618. doi: 10.1073/pnas.68.3.614. [DOI] [PMC free article] [PubMed] [Google Scholar]
- 3.Sivaraja M, Goodin DB, Smith M, Hoffman BM. Identification by ENDOR of Trp191 as the free-radical site in cytochrome c peroxidase compound ES. Science. 1989;245:738–740. doi: 10.1126/science.2549632. [DOI] [PubMed] [Google Scholar]
- 4.Adak S, Datta AK. Leishmania major encodes an unusual peroxidase that is a close homologue of plant ascorbate peroxidase: a novel role of the transmembrane domain. Biochem. J. 2005;390:465–474. doi: 10.1042/BJ20050311. [DOI] [PMC free article] [PubMed] [Google Scholar]
- 5.Dolai S, Yadav RK, Datta AK, Adak S. Effect of thiocyanate on the peroxidase and pseudocatalase activities of Leishmania major ascorbate peroxidase. Biochim. Biophys. Acta. 2007;1770:247–256. doi: 10.1016/j.bbagen.2006.10.001. [DOI] [PubMed] [Google Scholar]
- 6.Yadav RK, Dolai S, Pal S, Adak S. Role of tryptophan-208 residue in cytochrome c oxidation by ascorbate peroxidase from Leishmania major-kinetic studies on Trp208Phe mutant and wild type enzyme. Biochim. Biophys. Acta. 2008;1784:863–871. doi: 10.1016/j.bbapap.2008.02.006. [DOI] [PubMed] [Google Scholar]
- 7.Barrows TP, Bhaskar B, Poulos TL. Electrostatic control of the tryptophan radical in cytochrome c peroxidase. Biochemistry. 2004;43:8826–8834. doi: 10.1021/bi049531g. [DOI] [PubMed] [Google Scholar]
- 8.Bhaskar B, Bonagura CA, Li H, Poulos TL. Cation-induced stabilization of the engineered cation-binding loop in cytochrome c peroxidase (CcP) Biochemistry. 2002;41:2684–2693. doi: 10.1021/bi011599y. [DOI] [PubMed] [Google Scholar]
- 9.Bonagura CA, Bhaskar B, Sundaramoorthy M, Poulos TL. Conversion of an engineered potassium-binding site into a calcium-selective site in cytochrome c peroxidase. Biochemistry. 1999;274:37827–37833. doi: 10.1074/jbc.274.53.37827. [DOI] [PubMed] [Google Scholar]
- 10.Bonagura CA, Sundaramoorthy M, Bhaskar B, Poulos TL. The effects of an engineered cation site on the structure, activity, and EPR properties of cytochrome c peroxidase. Biochemistry. 1999;38:5528–5545. doi: 10.1021/bi982996k. [DOI] [PubMed] [Google Scholar]
- 11.Bonagura CA, Sundaramoorthy M, Pappa HS, Patterson WR, Poulos TL. An engineered cation site in cytochrome c peroxidase alters the reactivity of the redox active tryptophan. Biochemistry. 1996;35:6107–6115. doi: 10.1021/bi960122x. [DOI] [PubMed] [Google Scholar]
- 12.Jasion VS, Polanco JA, Meharenna YT, Li H, Poulos TL. Crystal structure of Leishmania major peroxidase and characterization of the compound i tryptophan radical. J. Biol. Chem. 2011;286:24608–24615. doi: 10.1074/jbc.M111.230524. [DOI] [PMC free article] [PubMed] [Google Scholar]
- 13.Dolai S, Yadav RK, Pal S, Adak S. Leishmania major ascorbate peroxidase overexpression protects cells against reactive oxygen species-mediated cardiolipin oxidation. Free Radic. Biol. Med. 2008;45:1520–1529. doi: 10.1016/j.freeradbiomed.2008.08.029. [DOI] [PubMed] [Google Scholar]
- 14.Ivens AC, Peacock CS, Worthey EA, Murphy L, Aggarwal G, Berriman M, Sisk E, Rajandream MA, Adlem E, Aert R, Anupama A, Apostolou Z, Attipoe P, Bason N, Bauser C, Beck A, Beverley SM, Bianchettin G, Borzym K, Bothe G, Bruschi CV, Collins M, Cadag E, Ciarloni L, Clayton C, Coulson RM, Cronin A, Cruz AK, Davies RM, De Gaudenzi J, Dobson DE, Duesterhoeft A, Fazelina G, Fosker N, Frasch AC, Fraser A, Fuchs M, Gabel C, Goble A, Goffeau A, Harris D, Hertz-Fowler C, Hilbert H, Horn D, Huang Y, Klages S, Knights A, Kube M, Larke N, Litvin L, Lord A, Louie T, Marra M, Masuy D, Matthews K, Michaeli S, Mottram JC, Muller-Auer S, Munden H, Nelson S, Norbertczak H, Oliver K, O'Neil S, Pentony M, Pohl TM, Price C, Purnelle B, Quail MA, Rabbinowitsch E, Reinhardt R, Rieger M, Rinta J, Robben J, Robertson L, Ruiz JC, Rutter S, Saunders D, Schafer M, Schein J, Schwartz DC, Seeger K, Seyler A, Sharp S, Shin H, Sivam D, Squares R, Squares S, Tosato V, Vogt C, Volckaert G, Wambutt R, Warren T, Wedler H, Woodward J, Zhou S, Zimmermann W, Smith DF, Blackwell JM, Stuart KD, Barrell B, et al. The genome of the kinetoplastid parasite, Leishmania major. Science. 2005;309:436–442. doi: 10.1126/science.1112680. [DOI] [PMC free article] [PubMed] [Google Scholar]
- 15.Pollock WB, Rosell FI, Twitchett MB, Dumont ME, Mauk AG. Bacterial expression of a mitochondrial cytochrome c. Trimethylation of Lys72 in yeast iso-1-cytochrome c and the alkaline conformational transition. Biochemistry. 1998;37:6124–6131. doi: 10.1021/bi972188d. [DOI] [PubMed] [Google Scholar]
- 16.Berry EA, Trumpower BL. Simultaneous determination of hemes a, b, and c from pyridine hemochrome spectra. Anal. Biochem. 1987;161:1–15. doi: 10.1016/0003-2697(87)90643-9. [DOI] [PubMed] [Google Scholar]
- 17.Dus K, de Klerk H, Bartsch RG, Horio T, Kamen MD. ON THE MONOHEME NATURE OF CYTOCHROME c' (Rhodopseudomonas palustris) Proc. Natl. Acad. Sci. U S A. 1967;57:367–370. doi: 10.1073/pnas.57.2.367. [DOI] [PMC free article] [PubMed] [Google Scholar]
- 18.Yonetani T. Studies on cytochrome c peroxidase. II. Stoichiometry between enzyme, H2O2, and ferrocytochrome c and enzymic determination of extinction coefficients of cytochrome c. J. Biol. Chem. 1965;240:4509–4514. [PubMed] [Google Scholar]
- 19.Fowler RM, Bright HA. Standardization of permanganate solutions with sodium oxalate. J. Res. Natl. Bur. Standards. 1935;15:493–575. [Google Scholar]
- 20.Otwinowski Z, Minor W. Processing of X-ray diffraction data collected in oscillation mode. Methods Enzymol. 1997;276:307–326. doi: 10.1016/S0076-6879(97)76066-X. [DOI] [PubMed] [Google Scholar]
- 21.McCoy AJ. Solving structures of protein complexes by molecular replacement with Phaser. Acta Crystallogr. D Biol. Crystallogr. 2007;63:32–41. doi: 10.1107/S0907444906045975. [DOI] [PMC free article] [PubMed] [Google Scholar]
- 22.Winn MD, Ballard CC, Cowtan KD, Dodson EJ, Emsley P, Evans PR, Keegan RM, Krissinel EB, Leslie AG, McCoy A, McNicholas SJ, Murshudov GN, Pannu NS, Potterton EA, Powell HR, Read RJ, Vagin A, Wilson KS. Overview of the CCP4 suite and current developments. Acta Crystallogr. D Biol. Crystallogr. 2011;67:235–242. doi: 10.1107/S0907444910045749. [DOI] [PMC free article] [PubMed] [Google Scholar]
- 23.Potterton L, McNicholas S, Krissinel E, Gruber J, Cowtan K, Emsley P, Murshudov GN, Cohen S, Perrakis A, Noble M. Developments in the CCP4 molecular-graphics project. Acta Crystallogr. D Biol. Crystallogr. 2004;60:2288–2294. doi: 10.1107/S0907444904023716. [DOI] [PubMed] [Google Scholar]
- 24.Emsley P, Cowtan K. Coot: model-building tools for molecular graphics. Acta Crystallogr. D Biol. Crystallogr. 2004;60:2126–2132. doi: 10.1107/S0907444904019158. [DOI] [PubMed] [Google Scholar]
- 25.Emsley P, Lohkamp B, Scott WG, Cowtan K. Features and development of Coot. Acta Crystallogr. D Biol. Crystallogr. 2010;66:486–501. doi: 10.1107/S0907444910007493. [DOI] [PMC free article] [PubMed] [Google Scholar]
- 26.Adams PD, Grosse-Kunstleve RW, Hung LW, Ioerger TR, McCoy AJ, Moriarty NW, Read RJ, Sacchettini JC, Sauter NK, Terwilliger TC. PHENIX: building new software for automated crystallographic structure determination. Acta Crystallogr. D Biol. Crystallogr. 2002;58:1948–1954. doi: 10.1107/s0907444902016657. [DOI] [PubMed] [Google Scholar]
- 27.Afonine PV, Grosse-Kunstleve RW, Adams PD. A robust bulk-solvent correction and anisotropic scaling procedure. Acta Crystallogr. D Biol. Crystallogr. 2005;61:850–855. doi: 10.1107/S0907444905007894. [DOI] [PMC free article] [PubMed] [Google Scholar]
- 28.Pelletier H, Kraut J. Crystal structure of a complex between electron transfer partners, cytochrome c peroxidase and cytochrome c. Science. 1992;258:1748–1755. doi: 10.1126/science.1334573. [DOI] [PubMed] [Google Scholar]
- 29.Bushnell GW, Louie GV, Brayer GD. High-resolution three-dimensional structure of horse heart cytochrome c. J. Mol. Biol. 1990;214:585–595. doi: 10.1016/0022-2836(90)90200-6. [DOI] [PubMed] [Google Scholar]
- 30.Kang CH, Ferguson-Miller S, Margoliash E. Steady state kinetics and binding of eukaryotic cytochromes c with yeast cytochrome c peroxidase. J. Biol. Chem. 1977;252:919–926. [PubMed] [Google Scholar]
- 31.Chaudhury S, Berrondo M, Weitzner BD, Muthu P, Bergman H, Gray JJ. Benchmarking and analysis of protein docking performance in Rosetta v3.2. PLoS One. 2011;6:e22477. doi: 10.1371/journal.pone.0022477. [DOI] [PMC free article] [PubMed] [Google Scholar]
- 32.Gray JJ, Moughon S, Wang C, Schueler-Furman O, Kuhlman B, Rohl CA, Baker D. Protein-protein docking with simultaneous optimization of rigid-body displacement and side-chain conformations. J. Mol. Biol. 2003;331:281–299. doi: 10.1016/s0022-2836(03)00670-3. [DOI] [PubMed] [Google Scholar]
- 33.Wang C, Bradley P, Baker D. Protein-protein docking with backbone flexibility. J. Mol. Biol. 2007;373:503–519. doi: 10.1016/j.jmb.2007.07.050. [DOI] [PubMed] [Google Scholar]
- 34.Bashir Q, Volkov AN, Ullmann GM, Ubbink M. Visualization of the encounter ensemble of the transient electron transfer complex of cytochrome c and cytochrome c peroxidase. J. Am. Chem. Soc. 2010;132:241–247. doi: 10.1021/ja9064574. [DOI] [PubMed] [Google Scholar]


