

Abstract
Introduction
Preeclampsia and other placental pathologies are characterized by a lack of spiral artery remodeling associated with insufficient invasion by extravillous trophoblast cells (EVT). Because trophoblast invasion occurs in early pregnancy when access to human placental tissue is limited, there is a need for model systems for the study of trophoblast differentiation and invasion. Human embryonic stem cells (hESC) treated with BMP4- differentiate to trophoblast, and express HLA-G, a marker of EVT. The goals of the present study were to further characterize the HLA-G+ cells derived from BMP4-treated hESC, and determine their suitability as a model.
Methods
HESC were treated with BMP4 under 4% or 20% oxygen and tested in Matrigel invasion chambers. Both BMP4-treated hESC and primary human placental cells were separated into HLA-G+ and HLA-G−/TACSTD2+ populations with immunomagnetic beads and expression profiles analyzed by microarray.
Results
There was a 10-fold increase in invasion when hESC were BMP4-treated. There was also an independent, stimulatory effect of oxygen on this process. Invasive cells expressed trophoblast marker KRT7, and the majority were also HLA-G+. Gene expression profiles revealed that HLA-G+, BMP4-treated hESC were similar to, but distinct from, HLA-G+ cells isolated from first trimester placentas. Whereas HLA-G+ and HLA-G− cells from first trimester placentas had highly divergent gene expression profiles, HLA-G+ and HLA-G− cells from BMP4-treated hESC had somewhat similar profiles, and both expressed genes characteristic of early trophoblast development.
Conclusions
We conclude that hESC treated with BMP4 provide a model for studying transition to the EVT lineage.
Keywords: Extravillous trophoblast, Human embryonic stem cell, BMP4, Trophoblast, Pre-eclampsia
1. Introduction
In humans, the outer layer of the blastocyst, the trophectoderm, mediates initial attachment and subsequent invasion of embryo into maternal endometrium and then gives rise to the more advanced and specialized trophoblast cell types of the mature placenta: the cytotrophoblast, syncytiotrophoblast, and extravillous trophoblast (EVT) [1,2]. As cytotrophoblast grow through the syncytiotrophoblast, they form columns of cells and subsequently chorionic villi. The tips of chorionic villi harbor EVT, which invade the deciduum. While some EVT remain in the interstitium, others penetrate uterine spiral arteries, replacing the endothelial lining and musculoelastic tissues and creating low-resistance vessels [3]. Beginning at 10–12 weeks of gestation, this modification of spiral arteries ensures uninterrupted flow of maternal blood to the placental bed [4]. As EVT approach maternal blood vessels, they are exposed to increasingly higher O2 tensions (∼14% O2), causing a gradual shift from proliferation to invasion [5]. By mid gestation, generation of EVT ends. If, by this stage, EVT has not adequately remodeled spiral arteries, placental insufficiency and pregnancy disorders such as preeclampsia may result [6]. It is evident in term placental sections from preeclampsia that interstitial EVT invasion does not extend as deeply as in normal pregnancies, and fewer EVT are found within spiral arteries [7–9]. The development of novel diagnostics or therapies for preeclampsia and other placental insufficiencies is hampered by the lack of suitable models to investigate EVT emergence and invasion during early placentation [10]. While human term placentas are easily obtained, they do not provide invasive EVT. In contrast, first trimester placental tissue will form EVT in vitro, but is not widely available, and cannot be maintained long term in culture [11,12]. Immortalized cell lines with EVT properties such as HTR8 (HTR-8/SVneo) [13], TEV-1 [14], Swan-71 [15], TCL1 [16] and SGHPL-4 [17] are widely used, but these cells are already committed to the EVT lineage and preclude investigation of their origins [18,19].
Human embryonic stem cells (hESC), as demonstrated first by Xu et al. [20] and later confirmed by others [12,21–26], differentiate efficiently into TB by the inclusion of BMP4, and mitigation of FGF2 signaling [27,28]. This differentiation is marked by down-regulation of POU5F1 and other pluripotency genes and up-regulation of markers consistent with EVT and syncytiotrophoblast [20–22]. We previously demonstrated that some areas of hESC colonies treated with BMP4 for 6–9 days in the absence of FGF2 are syncytiotrophoblast-like and characterized by continuous cytoplasm and expression of GATA2, KRT7, KRT8 and hCGB [22]. Additionally, regions of HLA-G+, putative EVT cells have been noted [22]. The goal of the present study was to characterize the putative EVT population further by comparing it with the analogous HLA-G+ population from first trimester primary placental samples and evaluate its potential as an in vitro model for investigating EVT invasion.
2. Materials/methods
2.1. Matrigel invasion assays
Human ES H1 (NIH code WA01) and human ES H9 (WA09) (WiCell Research Institute, Madison, WI) were maintained and passaged as per published methodologies [29]. Briefly, the hESC were cultured on irradiated mouse embryonic fibroblast (MEF) cells in 80% DMEM/F12 supplemented with 20% KnockOut serum replacement, 1 mM l-glutamine/0.1 mM 2-mercaptoethanol/1% nonessential amino acids (Life Technologies) and 4 ng/ml FGF2 (in house). H1 or H9 hESC were dispersed by using 1 mg/mL of collagenase Type IV (Life Technologies). For invasion assays, a small aliquot of the cell suspension was further dispersed into individual cells by using TrypLe (Life Technologies) and counted on a hemocytometer. Equivalent numbers of ESC from the collagenase suspension were transferred onto Matrigel invasion chambers with 8 μm pores (Becton–Dickinson) in a 6-well plate at a density of 7.2–7.5 × 10⁴ cells/chamber. Cells were cultured in irradiated MEF-conditioned medium supplemented with either 4 ng/ml FGF2 or 10 ng/ml BMP4 (R&D Systems) under a humidified atmosphere of 4% O2/5% CO2/91% N2 or under a standard gas atmosphere of humidified air/5% CO2 at 37 °C. After 5 days, cells and Matrigel on the upper side of the chambers were removed using a cotton swab, and membranes rinsed in PBS to remove any uninvaded cells. Invaded cells on the underside of the membrane were then fixed in 4% paraformaldehyde for 10 min, stained with DAPI, and five representative fields photographed. The manual counting feature of ImageJ was used to count the number of cells per field. Counts from duplicate chambers were averaged for each treatment group for each experiment. Invasion was analyzed statistically by two-way repeated measures ANOVA with oxygen concentration and growth factor (FGF2 or BMP4) as factors and number of invaded cells per frame as the outcome measure (SigmaPlot, Systat Software, Inc, San Jose, CA). Data were log-transformed to correct for non-normal distribution.
2.2. Immunocytochemistry
H1 hESC were maintained on Matrigel-coated plates in chemically defined mTeSR medium (STEMCELL Technologies Inc.). Cells were passaged to 6-well plates containing Matrigel-coated glass coverslips and cultured for 24 h in mTeSR (day–2). Cells were acclimated to MEF-conditioned medium containing 4 ng/ml FGF2 for a day (day–1) before treatment was begun in MEF-conditioned medium with either 4 ng/ml FGF2 or 10 ng/ml BMP4 (day 0). After 2, 4, 6 or 8 days of culture, cells were fixed in 4% paraformaldehyde for 10 min and stored in DPBS at 4 °C. Staining was carried out as previously described [22] with antibodies listed in Supplemental Table 1.
2.3. Magnetic bead separation
Placentas were collected from women undergoing surgery at 8–12 weeks of gestation by LMP (last menstrual period) due to fetal demise at University of Missouri Women's and Children's Hospital and isolated as previously described [30]. Briefly, villous tissue was minced with scissors and then incubated in dissociation solution (4.2 mM MgSO4, 0.25% trypsin, 100 kU/ml DNase I in DPBS) for 30 min at 37 °C. Cells were passed through a 100 μm cell filter, washed in Medium 199 and layered on a 40%/25% Percoll gradient. The trophoblast layer was collected at the interface then washed and resuspended in PBS/0.5% BSA/2 mM EDTA (PBS/BSA/EDTA).
For the contrasting study with cells derived from hESC, colonies were grown for 5 days as described above in presence of BMP4 and absence of FGF2. Cells were fully dispersed with Accutase (Millipore) and transferred to a conical tube containing PBS/BSA/EDTA. Cells expressing HLA-G, the most definitive EVT marker, were isolated from both the placental cells and the BMP4-treated hESC by using an antibody that had been validated for flow cytometric use, i.e. in intact, unfixed cells [31]. The remaining HLA-G negative cells from each source were selected with a monoclonal antibody also validated for flow cytometry [32] that specifically recognizes cytotrophoblast and syncytiotrophoblast in human placental sections [33,34]. The antigen was named TROP2 (for trophoblast 2) but the official gene name has now been changed to TACSTD2. Briefly, placental cells or BMP4-treated hESC were incubated with an anti-HLA-G antibody conjugated to phycoerythrin (PE) and an anti-TACSTD2 antibody conjugated to biotin for 10 min at 4C. Cells were washed in PBS/BSA/EDTA (×3) then incubated in a 1:5 dilution of anti-PE antibody conjugated to magnetic beads (Miltenyi Biotec, Auburn CA) at 4 °C for 10 min to tag HLA-G+ cells. Cells were then separated into HLA-G+ and – fractions by using MS columns and a MimiMACS Separator held by a Multistand (Miltenyi) to capture magnetic beads. HLA-G− cells that passed through the columns were incubated in a 1:5 dilution of streptavidin-conjugated magnetic beads (R&D Systems) at 4 °C for 10 min to tag HLA-G−/TACSTD2+ cells. A second MS column was used to collect the bead-bound (HLA-G−/TACSTD2+) cells. The abbreviations Placental/HLA-G+; Placental/TACSTD2; BMP-hESC/HLA-G+ and BMP-hESC/TACSTD2 are employed to refer to the separated cell populations for the remainder of the manuscript.
2.4. Microarray
Thirteen microarrays were run in total: n = 3 each from (1) Placental/HLA-G+; (2) Placental/TACSTD2; (3) BMP-hESC/HLA-G+; and (4) BMP-hESC/TACSTD2 groups and one sample of undifferentiated hESC was used as a control. Microarray analysis was performed by GenUs BioSystems (Northbrook, IL). RNA was purified using the Ribopure (Ambion) RNA isolation kit according to manufacturer's instructions. RNA quality was assessed with an Agilent Bioanalyzer. First and second strand cDNA was prepared from total RNA samples. The cRNA target was prepared from the DNA template and its quality verified on the Bioanalyzer. The cRNA was fragmented to uniform size and hybridized to Agilent Human GE 4 × 44K v2 arrays. Slides were washed and scanned on an Agilent G2565 Microarray Scanner. Data were analyzed with Agilent Feature Extraction and GeneSpring GX v7.3.1 software packages.
3. Results
3.1. Temporal and spatial pattern of trophoblast differentiation in BMP4-treated hESC
Expression of stem cell marker POU5F1 declined gradually over time in hESC treated with BMP4. On day 2 of treatment, colonies remained largely positive for POU5F1, although there was some loss at the periphery (Fig. 1A). By day 4, POU5F1 signals were absent from small colonies (Fig. 1) but expression persisted in a small central “core” in larger colonies (not shown).
Fig. 1.
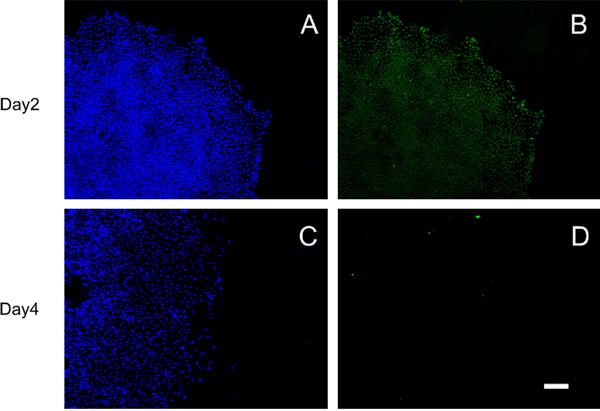
H1 hESC were immunostained for POU5F1 (Oct4) (Green B,D) on days 2 (A–B) and 4 (C–D) of BMP4 treatment. No POU5F1 signals were detected on days 6 or 8 (not shown). Nuclei are counterstained with DAPI (Blue A,B). Scale Bar (D): 200 μm. Negative controls are shown in Supplemental Fig. 2.
In contrast, expression of trophoblast proteins HLA-G and CGA increased gradually over time. On day 2 of BMP4 treatment, a few cells in scattered locations throughout the colonies showed punctuate staining for HLA-G, a canonical EVT marker at the cell surface (Fig. 2). HLA-G expression became progressively more widespread throughout the colony on days 4–8 (Fig. 2B,C,D). On days 6 and 8 of BMP4, some HLA-G+ cells were clustered and HLA-G staining was continuous across multiple cells within clusters (Fig. 2D). Immunostaining for chorionic gonadotropin subunit CGA appeared later than that for HLA-G, with a few positive cells on day 6 and many more by day 8 (Fig. 2G,H). CGA+ cells appeared first near the periphery of colonies. Many CGA+ cells were clustered and appeared to be syncytialized. Neither HLA-G nor CGA was detected in cells maintained under pluripotency conditions (+FGF2) (Supplemental Fig. 2).
Fig. 2.
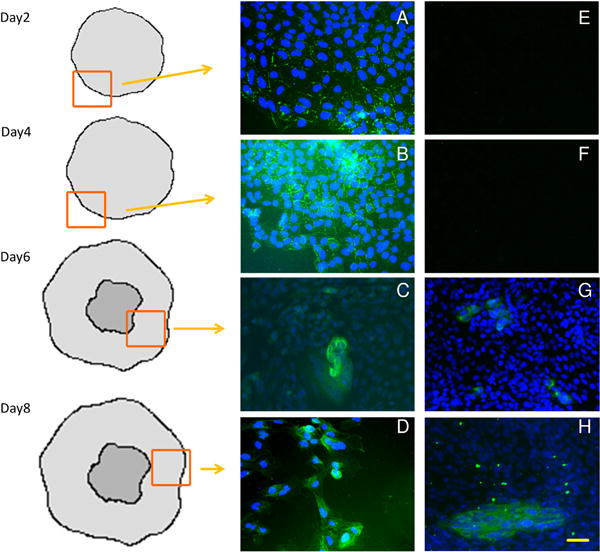
Acquisition of trophoblast lineage markers by hESC over 8 days of culture in BMP4. H1 hESC were immunostained for HLA-G (Green, A,B,C,D), and CGA (Green, E,F,G,H) on d2, 4, 6 and 8 of treatment with BMP4. Nuclei were counterstained with DAPI (blue) Drawings indicate position of image within an hESC colony relative to the colony edge and central core of less differentiated cells. Scale bar (H): 50 μm. Negative controls are shown in Supplemental Fig. 1.
3.2. Matrigel invasion assay
To test whether BMP4-treated hESC contain a population of mobile, potentially invasive trophoblast, hESC were plated on Matrigel invasion chambers and either treated with BMP4 or maintained in an undifferentiated state (+FGF2). Additionally, the effect of oxygen on invasion was tested at concentrations that we have previously found to alter differentiation of BMP4-treated hESC, ambient (20%) O2 and low (4%) O2 [22] (Fig. 3). BMP4 had a significant, independent effect on invasion in H9 (p = 0.038) and H1 (p = 0.016), whereas the effect of oxygen reached statistical significance only in H1 (p = 0.025, H9 p = 0.07). In BMP4-treated hESC maintained under 20% O2, 40–100 times more invasive cells were observed as compared to hESC maintained on FGF2 and 4% O2 (Fig. 3). In BMP4-treated cultures, cells on the underside of chamber membranes on day 5 were almost uniformly positive for trophoblast marker KRT7, and roughly 70% of cells were HLA-G+, although there was some variation from experiment to experiment (Fig. 3). In contrast, the small number of cells penetrating the Matrigel layer under FGF2 failed to stain for either KRT7 or HLA-G (Supplemental Fig. 2). Additionally, some invaded BMP4-treated hESC express CDH5, which is found in trophoblast from anchoring, but not floating villi [35]. ITGA1, which is found on EVT within the deciduum, but not within the anchoring villi [36], was not expressed (Fig. 3).
Fig. 3.
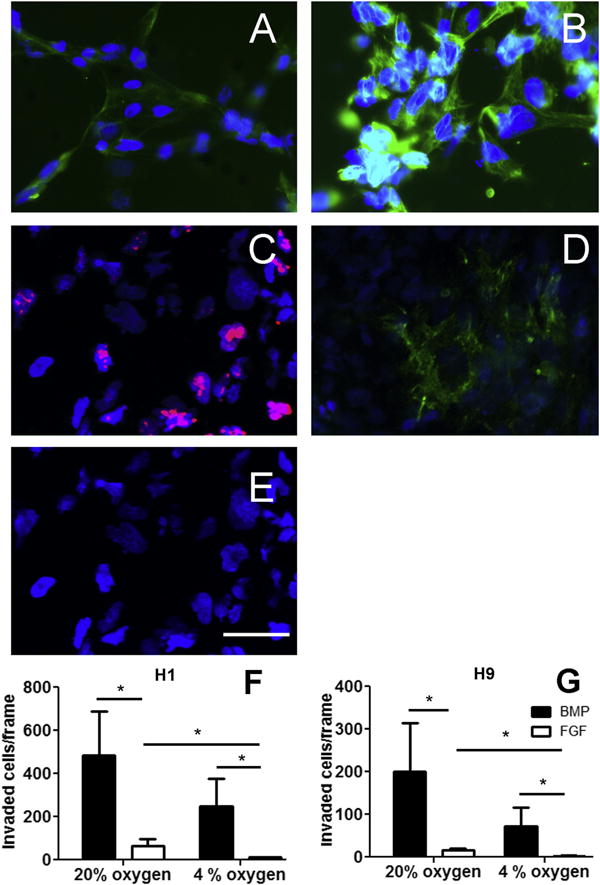
H1 and H9 hESC were plated on matrigel invasion chambers and treated with BMP4 for 5 days. (A) Approximately 70% of cells that passed through the matrigel and adhered to the underside of the chamber membrane were positive for extravillous trophoblast marker HLA-G (green). (B) Nearly 100% of these invaded cells were positive for trophoblast marker KRT7 (green). (C) Proliferation marker Ki67 (red). (D) CDH5 (VE-cadherin), green. (E) ITGA1 (integrin alpha 1), green. Nuclei are counterstained with DAPI (blue). Scale bar (E): 50 μm. Positive and negative controls are shown in Supplemental Fig. 2. The number of invaded cells on the membrane was averaged across five randomly selected fields of view in three trials each in H1 (F) and H9 (G) hESC. *p < 0.05, Holm-Sidak pairwise comparisons.
A time course was conducted to determine when the invasive process began and when it was maximal. A small number of invaded cells were apparent on the underside of chamber membranes by day three and the number of these cells markedly increased through day five (Supplemental Fig. 3).
3.3. Comparison of gene expression in HLA-G+, BMP4-treated hESC and HLA-G+ placental cells
Primary first trimester human placental cells were separated with magnetic beads into HLA-G+ (EVT) and HLA-G−/TACSTD2+ (cytotrophoblast) populations (Supplemental Fig. 4). Microarray analysis identified 4579 genes that were differentially expressed (p < 0.05, >2-fold) between these cell types (Supplemental Table 2). DAVID analysis was used to identify meaningful functional clusters among the differentially expressed genes. For those up-regulated in Placental/HLA-G+ EVT relative to Placental/TACSTD2+, the most overrepresented categories were related to cell invasion (Table 1). Among genes up-regulated in cytotrophoblast relative to EVT, the most overrepresented categories were related to immune function, including cytokine production, immune cell activation and antigen presentation (Table 1).
Table 1.
Genes that were up-regulated in HLA-G+ cells and HLA-G−/TACSTD2+ cells from first trimester human placentas or in HLA-G+ and HLA-G−/TACSTD2+ cells from BMP4-treated hESC were analyzed using the functional annotation tool in DAVID. Enrichment scores are based on Fisher Exact Scores for all functional categories grouped within the annotation cluster. A higher enrichment score indicates the likelihood that the functional cluster is more represented among the differentially expressed genes than would be expected by chance alone.
| Annotation cluster | Enrichment score | Number genes | Selected genes |
|---|---|---|---|
| Functional clusters upregulated in primary HLAG+ vs. HLAG−/TACSTD2D+ cells | |||
| Extracellular matrix | 9.01 | 122 | COL4A1, FN1, LAMA1, MMP2, TGFB2 |
| Cytoskeletal protein binding | 6.35 | 81 | ACTA1, CFL2, DMD, MYL3, STMN1 |
| Cell cycle | 6.1 | 113 | AURKB, CDKN1C, CHEK1, MCM2, SMAD3 |
| Extracellular region | 5.92 | 353 | ADAM12, BMP4, CSH1, ITGA5, PAPPA |
| Cell junction | 5.61 | 86 | AQP3, CLDN19.GJA5, JAM2, LI MA1 |
| Glycoprotein/signal peptide | 5.11 | 487 | ADAM19, EPHB3, GPR98, PSG1, SLC6A19 |
| Contractile fiber part | 4.9 | 29 | ACTN1, CRYAB, PDLIM3, MYL4, TPM1 |
| Cell adhesion | 4.58 | 98 | DSCAM, CDH1, ESAM, ITGB1, LAMA4 |
| Immunoglobulin domain | 3.52 | 69 | CEACAM1, HAPLN1, ISGF3, PSG2, SEMA4B |
| Angiogenesis | 2.99 | 41 | KLF5, ANGPT1, CDH5, EPAS1, NOS2 |
| Functional clusters upregulated in primary HLAG−/TACSTD2+ vs. HLAG+ Cells | |||
| Inflammatory response/host defense | 31.6 | 207 | CCL2, CXCL1, C1QC, ILIA, TNF |
| Transmembrane | 18.37 | 972 | AGPAT3, ATP7A, CD36, CLEC2B, SLC38A6 |
| Lysosome | 13.25 | 76 | ATP6V0A1, CTSB, GLA, LI PA, VAMP4 |
| Immune cell activation/differentiation | 12.1 | 114 | CXCR4, MICA, CSF1, SOD1, TLR1 |
| Regulation of cytokine production | 11.02 | 80 | CD40, ILIA, IL1B, IL10, PTGS1 |
| Pleckstrin homology | 7.13 | 73 | AGAP2, ARHGAP9, DOCKIO, PHLDA1 RALGPS1, |
| Antigen processing and presentation | 6.98 | 118 | CD28, FCER1G, ICAM1, KIR3DL1, HLA-A |
| Immunoglobulin domain | 6.52 | 115 | CD300A, FCAR, ICAM1, SIGLEC1 SLAMF6 |
| Regulation of protein kinase activity | 5.47 | 171 | JUN, MAPK1, PRKCD, RPS6KA3, STAT5 |
| Apoptosis | 5.12 | 149 | BCL2, CASP1, FAS, NAIP, SRC |
| Functional clusters in genes differentially expressed between HLAG+ and HLAG−/TACSTD2+ BMP4-hESC | |||
| Upregulated in HLAG+ | |||
| Extracellular region | 1.6 | 9 | AREG, CCL2, DLK1, SPINK1, TTR |
| Upregulated in HLAG−/TACSTD2+ | |||
| Circulatory system | 1.3 | 5 | CORIN, PMCH, KEL, MYLK2, GCGR |
| Intracellular signaling | 1.09 | 10 | DOK3, RREB1, RAPGEF6, KSR1, RHOV |
| Regulation of protein localization | 1.09 | 6 | GATA2, SORBS1, P2RX2, NLRP12, NLRP2 |
| Chromatin organization | 1.07 | 10 | SHPRH, HIST1H2AI, H2AFJ, HDAC11, HIST3H2BB |
| SH3 domain | 1.02 | 5 | FYB, SORBS1, C10RF113, SH3TC1, NEBL |
| Tissue morphogenesis | 1.02 | 5 | FGF7, TBX3, MYLK2, KGFLP2, PTCH1 |
| Hormone activity | 1.01 | 4 | PPY, ERVFRDE1, PMCH, GAST |
| Contractile fiber | 0.99 | 4 | TNNT3, ITGB1BP2, MYLK2, TRIM63 |
The same separation procedure was used to select HLA-G+ and HLA-G−/TACSTD2+ cells from hESC cultured with BMP4 for five days. For genes differentially expressed between placental/HLA-G+ and placental/TACSTD2 cells, expression profiles were more similar between placental/HLA-G+ and BMP-hESC/HLA-G+ cells than between placental/HLA-G+ and placental/TACSTD2 cells (Fig. 4A). Thus, HLA-G+ cells derived from hESC have some characteristic features of EVT. However, HLA-G+ cells from placentas and BMP4-treated hESC clustered separately and were clearly distinct (Fig. 4A,B).
Fig. 4.
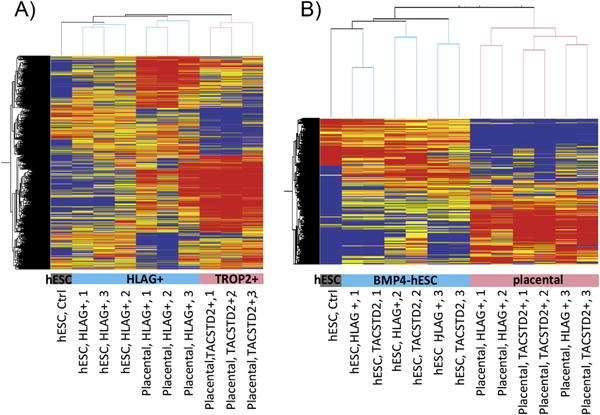
Microarray analysis of gene expression profiles in trophoblast derived from first trimester placental tissues and hESC. (A) Clustering of primary and hESC-derived trophoblast expression profiles for genes that are differentially expressed between primary (placental) HLA-G+ and HLA-G+/TACSTD2- cells (4579 probes >2-fold, paired T-test < 0.05 in placental samples). (B) Clustering of primary and hESC-derived trophoblast expression profiles for genes differentially expressed between undifferentiated hESC and all six trophoblast samples from BMP4-hESC or all six trophoblast samples from first trimester placentas (>6 fold in 6/6 comparisons, 3212 probes). The condition trees were generated using values normalized to the 75th percentile intensity of each array. Red/Orange = up-regulated relative to median. Blue/Grey = down-regulated relative to median of 10 samples.
Expression of well-established lineage markers supported similarities between BMP-hESC/HLA-G+ and placental/HLA-G+ cells but also emphasized their distinctiveness (Fig. 5). GATA6, a marker of primitive endoderm, also widely expressed in endocrine tissues [37], was robustly expressed in placental/HLA-G+ cells (Fig. 5). Otherwise, placental/HLA-G+, placental/TACSTD2 cells and BMP-hESC/HLA-G+ cells all expressed differentiated trophoblast markers at levels far exceeding the weak expression of mesendoderm markers in these cells (Fig. 5). However, of the mature trophoblast marker genes, only KRT7 and -8 were expressed in BMP-hESC/HLA-G+ cells at levels comparable to primary placental cells (Fig. 5C).
Fig. 5.
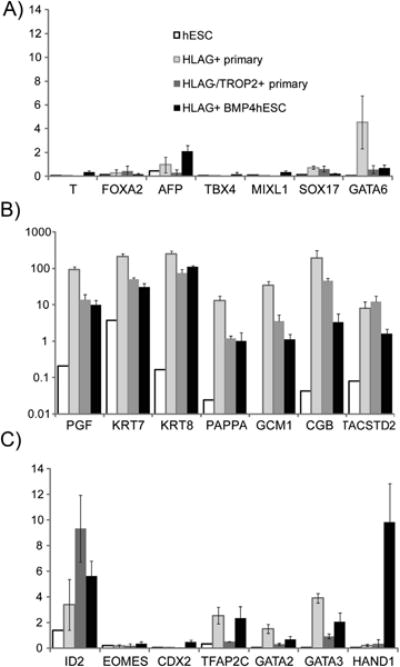
Expression of lineage marker genes by microarray analysis. Expression was normalized to the 75th percentile (=1.0) of fluorescence intensity on the array. This normalized value is shown on the y-axis. Error bars represent standard errors. (A) Endoderm and Mesoderm – expressed genes. (B) Genes expressed in mature trophoblast (log scale). (C) Transcription factor genes expressed in early trophoblast development.
In contrast, three transcription factors characteristic of early mouse trophoblast development (CDX2, HAND1 and EOMES) were more highly expressed in the HLA-G+, BMP4-treated hESC than in either primary placental cell type, while other transcription factors characteristic of early trophoblast development were expressed at similar levels in BMP-hESC/HLA-G+ and placental cells (Fig. 5B).
BMP-hESC/HLA-G+ also displayed continued expression of stemness genes that are normally down-regulated during differentiation. For example, POU5F1 expression was only about one-fifth of that in undifferentiated hESC, whereas in placental cells its expression was barely above background (GEO GSE42112). Among genes characteristic of undifferentiated hESC, expression profiles in BMP-hESC/HLA-G+ cells clustered more closely to undifferentiated hESC than to placental cells (Fig. 4).
Gene expression profiles in BMP-hESC/HLA-G+ and BMP-hESC/TACSTD2 were highly similar, in contrast to placental/HLA-G+ and placental/TACSTD2 cell profiles, which were clearly distinct from each other (Supplemental Fig. 4). Of the few genes up-regulated in BMP-hESC/HLA-G+ relative to BMP-hESC/TACSTD2 cells, only one, the uncharacterized C8ORF47, was also up-regulated in placental/HLA-G+ vs. placental/TACSTD2 cells. In contrast, there were 21 genes significantly down-regulated in HLA-G+ vs. HLA-G− cells in both the BMP4-treated hESC and placentas (Supplemental Table 3). We additionally identified 1215 genes that were differentially expressed across all six pairs of HLA-G+ vs HLA-G−/TACSTD2+ cells, regardless of source (p < 0.05, fold change >1.5). These generally reflected large, consistent differences in primary placental cells coupled with small changes in the BMP4-hESC. One of the most consistent was LHX2, which encodes a transcription factor that regulates CGA transcription in pituitary and thyroid ([38,39], but which has not been studied in trophoblast.
4. Discussion
The genes that we found to be up- or down-regulated specifically in primary placental EVT largely overlapped with those noted in a previous study. Apps et al. [40] compared global gene expression profiles in EGFR+ and HLA-G+ cells from first trimester placentas. Among the twenty genes we found most up-regulated in placental/HLA-G+ cells relative to placental/TACSTD2 cells, several had also been noted in the App et al. study (KCNK12, AQPEP, ADAM19, JAM2, LAIR2, MCAM, ESAM). Other genes Apps et al. cited as being most enriched in EVT (SLC02A1, PAPPA, SERPINE2, TIMP2) were also highly up-regulated in placental HLA-G+ cells in our study (2–18 fold), just not to the extent noted in theirs. There was also concordance between our TACSTD2+ cytotrophoblast cells and the EGFR+ cytotrophoblast cells analyzed by Apps et al. For example, SLC40A1, SLC22A11, ITGB5, MPP1, CNTNAP, NRP1, PAGE4 and COLEC12 were significantly up-regulated relative to HLA-G+ cells in both studies. On the other hand, the twenty genes most enriched in our analyses of TACSTD2+ cells did not appear on the Apps et al. list of most enriched genes in EGFR+ cells. The explanation for these conflicting data probably relates in part to stage differences in starting material and also to differences in cell-sorting methods. Whereas both studies utilized HLA-G to select EVT, different antigens (EGFR versus TACSTD2) were used for cytotrophoblast selection, likely leading to collection of different populations of cytotrophoblast. TACSTD2 (TROP2) was first identified through generation of monoclonal antibodies to BeWo cells that react specifically with syncytiotrophoblast and cytotrophoblast in human placental sections [33], but the antigen is not unique to trophoblast. It is also expressed, like EGFR, in tumors and in epithelial cells from multiple normal tissues [41].
We cannot rule out the possibility that placental cells isolated from spontaneous fetal demises are abnormal in some way, particularly as placental abnormalities can contribute to fetal losses. Attempts were made to minimize this possibility by collecting tissue only within 2 weeks of previous fetal heart rate detection and within 48 h of diagnosis of demise and by utilizing only placental tissue with normal gross morphology, particularly appropriately branched fine villi. The high concordance in gene expression in HLA-G+ cells in this study and that of cells from elective terminations from Apps et al. suggests that our cells were generally normal.
Among the genes identified in both studies as being highly up-regulated in HLA-G+ cells, several have not previously been identified as enriched in, and therefore potential markers of, EVT. Although AQPEP, MCAM, PAPPA [42], SERPINE2 and ADAM19 [42–46] have been noted in EVT and implicated in invasion, KCNK12, JAM2, SLC0A2 and ESAM have not. These are opportune targets for further investigation. Similarly, of the 20 genes most down-regulated in both placental/HLA-G+ and BMP-hESC/HLA-G+ cells, only ERN1 [47], MXD1 [48], CYP3A7 [49], SLC22A11 [50] and CD70 [51] have been previously identified in placenta. Also intriguing was the gene, C8orf47, which was up-regulated in both placental/HLA-G+ and BMP-hESC/HLA-G+. This gene encodes two variants, both completely uncharacterized.
Unexpectedly, there were relatively few gene expression changes that distinguished BMP-hESC/HLA-G+ from BMP-hESC/TACSTD2 cells. At day 5, colonies are comprised of a uniform population of cells with a “cobblestone” (i.e. epithelial) phenotype, except in the central region of larger colonies. No syncytial regions can be observed at d5 but a substantial fraction of cells are HLA-G+. The high degree of similarity between HLA-G+ and HLA-G− cells on this day suggests that HLA-G does not mark a distinct cell type but rather may be expressed stochastically in cells that are poised to differentiate along more than one trophoblast lineage.
Indeed, even among the cells that passed through the Matrigel-coated invasion membrane, HLA-G expression was not universal but KRT7 expression was. These cells may therefore represent EVT at the earliest stages of differentiation and not homologs of EVT isolated from 8 to 12 week placenta. This conclusion is supported by the continued low levels of POU5F1 mRNA in HLA-G+ cells that yet expressed multiple genes characteristic of early trophoblast differentiation and the continuing presence of Ki67, indicating cells that have not terminally differentiated. Thus, BMP4-treated hESC provide a powerful tool for the investigation of factors controlling early trophoblast lineage decisions.
Multiple subtypes of EVT, including endovascular EVT in spiral arteries, interstitial EVT in decidua and EVT of anchoring villi have been identified immunohistologically in human placenta [52]. Whether these represent different differentiated cell types and the extent to which they can interconvert remains unknown. It is also not clear whether EVT and syncytiotrophoblast can emerge from the same or separate populations of cytotrophoblast. Cytotrophoblast cells isolated from late gestation spontaneously differentiate only to syncytiotrophoblast [53], whereas cultures of first trimester cytotrophoblast can form both syncytiotrophoblast and EVT depending on culture conditions [30], suggesting that there is a bipotential cytotrophoblast population at this stage. However, others reported that explants from the tips of first trimester anchoring villi lose the ability to generate syncytiotrophoblast after several days in culture but continue to produce EVT for weeks, and proposed that a cytotrophoblast population capable of giving rise only to EVT is found at the anchoring villus tips [1,54]. That such cells have only been identified in explants and not in dispersed cytotrophoblast cultures indicates that the anchoring villus niche may be necessary for its extended survival in culture. The HLA-G+ BMP-hESC that we have identified may represent this population, as they have both stemness characteristics and EVT characteristics, and express markers consistent with cells of the anchoring villus. Specifically, they express HLAG [55] and CDH5 [35], which are found in anchoring but not floating villi, but do not express ITGA1, which is found in the interstitial and endovascular EVT only [35,36]. Further tracking will be necessary to determine the differentiation potential of HLA-G+ BMP-hESC and to identify key features of a potential EVT stem cell niche. These questions are important to our understanding of placental pathologies such as preeclampsia, in which inadequate trophoblast remodeling of spiral arteries may result from deficiencies in a specific subtype of trophoblast or EVT.
In rodents, a combination of histochemistry on pre-and post-implantation conceptuses, in vitro trophoblast stem cell studies and in vivo genetic manipulations have enabled characterization of several key transcription factors, such as HAND1, that regulate trophoblast differentiation and provide for emergence of a functional placenta [56]. HAND1 is also expressed in human placental cells and choriocarcinoma cells [57] but presently there are no direct means to elucidate its role in early cell fate decisions of human trophoblast. Our observation that HAND1 expression in BMP4-treated hESC is an order of magnitude higher than in 8–12 week placental cells encourages us to believe that the BMP4-hESC model will provide one additional tool to study the function of HAND1 and other transcription factors in the emergence of sub-lineages of human placental cells.
Supplementary Material
Acknowledgments
This work is partially supported by funds from the Preeclampsia Foundation “Vision Grant” Award, and Institute for Clinical and Translational Science “Pilot Grant” to BT, and NIH R01HD067759 to RMR, TE, LCS, & DJS. We thank Kim Livingston and Sunilima Sinha for technical assistance and Takeshi Nagamatsu and Mitsuyoshi Amita for helpful discussions.
Abbreviations
- EVT
extravillous trophoblast
- hESC
human embryonic stem cells
- BMP4
bone morphogenetic protein 4
- FGF2
firoblast growth factor 2
Footnotes
Appendix A. Supplementary data: Supplementary data related to this article can be found at http://dx.doi.org/10.1016/j.placenta.2013.03.016.
References
- 1.Aplin JD. Developmental cell biology of human villous trophoblast: current research problems. Int J Dev Biol. 2010;54(2–3):323–9. doi: 10.1387/ijdb.082759ja. [DOI] [PubMed] [Google Scholar]
- 2.Red-Horse K, Zhou Y, Genbacev O, Prakobphol A, Foulk R, McMaster M, et al. Trophoblast differentiation during embryo implantation and formation of the maternal-fetal interface. J Clin Invest. 2004;114(6):744–54. doi: 10.1172/JCI22991. [DOI] [PMC free article] [PubMed] [Google Scholar]
- 3.Aubuchon M, Schulz LC, Schust DJ. Preeclampsia: animal models for a human cure. Proc Natl Acad Sci U S A. 2011;108(4):1197–8. doi: 10.1073/pnas.1018164108. [DOI] [PMC free article] [PubMed] [Google Scholar]
- 4.Caniggia I, Winter J, Lye SJ, Post M. Oxygen and placental development during the first trimester: implications for the pathophysiology of pre-eclampsia. Placenta. 2000;21(Suppl A):S25–30. doi: 10.1053/plac.1999.0522. [DOI] [PubMed] [Google Scholar]
- 5.Kaufmann P, Black S, Huppertz B. Endovascular trophoblast invasion: implications for the pathogenesis of intrauterine growth retardation and pre-eclampsia. Biol Reprod. 2003;69(1):1–7. doi: 10.1095/biolreprod.102.014977. [DOI] [PubMed] [Google Scholar]
- 6.Redman CW, Sargent IL. Latest advances in understanding preeclampsia. Science. 2005;308(5728):1592–4. doi: 10.1126/science.1111726. [DOI] [PubMed] [Google Scholar]
- 7.Brosens IA, Robertson WB, Dixon HG. The role of the spiral arteries in the pathogenesis of preeclampsia. Obstetrics Gynecol Annu. 1972;1:177–91. [PubMed] [Google Scholar]
- 8.Khong TY, De Wolf F, Robertson WB, Brosens I. Inadequate maternal vascular response to placentation in pregnancies complicated by pre-eclampsia and by small-for-gestational age infants. Br J Obstet Gynaecol. 1986;93(10):1049–59. doi: 10.1111/j.1471-0528.1986.tb07830.x. [DOI] [PubMed] [Google Scholar]
- 9.Aquilina J, Harrington K. Pregnancy hypertension and uterine artery Doppler ultrasound. Curr Opin Obstetrics Gynecol. 1996;8(6):435–40. [PubMed] [Google Scholar]
- 10.Pennington KA, Schlitt JM, Jackson DL, Schulz LC, Schust DJ. Preeclampsia: multiple approaches for a multifactorial disease. Dis Models Mech. 2012;5(1):9–18. doi: 10.1242/dmm.008516. [DOI] [PMC free article] [PubMed] [Google Scholar]
- 11.Genbacev O, Miller RK. Post-implantation differentiation and proliferation of cytotrophoblast cells: in vitro models–a review. Placenta. 2000;21(Suppl A):S45–9. doi: 10.1053/plac.1999.0523. [DOI] [PubMed] [Google Scholar]
- 12.Douglas GC, VandeVoort CA, Kumar P, Chang TC, Golos TG. Trophoblast stem cells: models for investigating trophectoderm differentiation and placental development. Endocr Rev. 2009;30(3):228–40. doi: 10.1210/er.2009-0001. [DOI] [PMC free article] [PubMed] [Google Scholar]
- 13.Graham CH, Hawley TS, Hawley RG, MacDougall JR, Kerbel RS, Khoo N, et al. Establishment and characterization of first trimester human trophoblast cells with extended lifespan. Exp Cell Res. 1993;206(2):204–11. doi: 10.1006/excr.1993.1139. [DOI] [PubMed] [Google Scholar]
- 14.Feng HC, Choy MY, Deng W, Wong HL, Lau WM, Cheung AN, et al. Establishment and characterization of a human first-trimester extravillous trophoblast cell line (TEV-1) J Soc Gynecol Investig. 2005;12(4):e21–32. doi: 10.1016/j.jsgi.2005.02.008. [DOI] [PubMed] [Google Scholar]
- 15.Fest S, Brachwitz N, Schumacher A, Zenclussen ML, Khan F, Wafula PO, et al. Supporting the hypothesis of pregnancy as a tumor: survivin is up-regulated in normal pregnant mice and participates in human trophoblast proliferation. Am J Reprod Immunol. 2008;59(1):75–83. doi: 10.1111/j.1600-0897.2007.00557.x. [DOI] [PubMed] [Google Scholar]
- 16.Fukushima K, Miyamoto S, Komatsu H, Tsukimori K, Kobayashi H, Seki H, et al. TNFalpha-induced apoptosis and integrin switching in human extravillous trophoblast cell line. Biol Reprod. 2003;68(5):1771–8. doi: 10.1095/biolreprod.102.010314. [DOI] [PubMed] [Google Scholar]
- 17.Cartwright JE, Holden DP, Whitley GS. Hepatocyte growth factor regulates human trophoblast motility and invasion: a role for nitric oxide. Br J Pharmacol. 1999;128(1):181–9. doi: 10.1038/sj.bjp.0702757. [DOI] [PMC free article] [PubMed] [Google Scholar]
- 18.Kalkunte S, Lai Z, Tewari N, Chichester C, Romero R, Padbury J, et al. In vitro and in vivo evidence for lack of endovascular remodeling by third trimester trophoblasts. Placenta. 2008;29(10):871–8. doi: 10.1016/j.placenta.2008.07.009. [DOI] [PMC free article] [PubMed] [Google Scholar]
- 19.Cartwright JE, Tse WK, Whitley GS. Hepatocyte growth factor induced human trophoblast motility involves phosphatidylinositol-3-kinase, mitogen-activated protein kinase, and inducible nitric oxide synthase. Exp Cell Res. 2002;279(2):219–26. doi: 10.1006/excr.2002.5616. [DOI] [PubMed] [Google Scholar]
- 20.Xu RH, Chen X, Li DS, Li R, Addicks GC, Glennon C, et al. BMP4 initiates human embryonic stem cell differentiation to trophoblast. Nat Biotechnol. 2002;20(12):1261–4. doi: 10.1038/nbt761. [DOI] [PubMed] [Google Scholar]
- 21.Schulz LC, Ezashi T, Das P, Westfall SD, Livingston KA, Roberts RM. Human embryonic stem cells as models for trophoblast differentiation. Placenta. 2008;29S:10–6. doi: 10.1016/j.placenta.2007.10.009. [DOI] [PMC free article] [PubMed] [Google Scholar]
- 22.Das P, Ezashi T, Schulz LC, Westfall SD, Livingston KA, Roberts RM. Effects of FGF2 and oxygen in the BMP4-driven differentiation of trophoblast from human embryonic stem cells. Stem Cell Res. 2007;1(1):61–74. doi: 10.1016/j.scr.2007.09.004. [DOI] [PMC free article] [PubMed] [Google Scholar]
- 23.Gerami-Naini B, Dovzhenko OV, Durning M, Wegner FH, Thomson JA, Golos TG. Trophoblast differentiation in embryoid bodies derived from human embryonic stem cells. Endocrinology. 2004;145(4):1517–24. doi: 10.1210/en.2003-1241. [DOI] [PubMed] [Google Scholar]
- 24.Zhang P, Li J, Tan Z, Wang C, Liu T, Chen L, et al. Short-term BMP-4 treatment initiates mesoderm induction in human embryonic stem cells. Blood. 2007;111(4):1933–41. doi: 10.1182/blood-2007-02-074120. [DOI] [PubMed] [Google Scholar]
- 25.Wu Z, Zhang W, Chen G, Cheng L, Liao J, Jia N, et al. Combinatorial signals of activin/nodal and bone morphogenic protein regulate the early lineage segregation of human embryonic stem cells. J Biol Chem. 2008;283(36):24991–5002. doi: 10.1074/jbc.M803893200. [DOI] [PMC free article] [PubMed] [Google Scholar]
- 26.Marchand M, Horcajadas JA, Esteban FJ, McElroy SL, Fisher SJ, Giudice LC. Transcriptomic signature of trophoblast differentiation in a human embryonic stem cell model. Biol Reprod. 2011;84(6):1258–71. doi: 10.1095/biolreprod.110.086413. [DOI] [PubMed] [Google Scholar]
- 27.Ezashi T, Telugu BP, Roberts RM. Model systems for studying trophoblast differentiation from human pluripotent stem cells. Cell Tissue Res. 2012 doi: 10.1007/s00441-012-1371-2. [DOI] [PMC free article] [PubMed] [Google Scholar]
- 28.Sudheer S, Bhushan R, Fauler B, Lehrach H, Adjaye J. FGF inhibition directs bmp4-mediated differentiation of human embryonic stem cells to syncytiotrophoblast. Stem Cell Dev. 2012 doi: 10.1089/scd.2012.0099. [DOI] [PMC free article] [PubMed] [Google Scholar]
- 29.Ezashi T, Das P, Roberts RM. Low O2 tensions and the prevention of differentiation of hES cells. Proc Natl Acad Sci U S A. 2005;102(13):4783–8. doi: 10.1073/pnas.0501283102. [DOI] [PMC free article] [PubMed] [Google Scholar]
- 30.Nagamatsu T, Fujii T, Ishikawa T, Kanai T, Hyodo H, Yamashita T, et al. A primary cell culture system for human cytotrophoblasts of proximal cytotrophoblast cell columns enabling in vitro acquisition of the extra-villous phenotype. Placenta. 2004;25(2–3):153–65. doi: 10.1016/j.placenta.2003.08.015. [DOI] [PubMed] [Google Scholar]
- 31.Menier C, Saez B, Horejsi V, Martinozzi S, Krawice-Radanne I, Bruel S, et al. Characterization of monoclonal antibodies recognizing HLA-G or HLA-E: new tools to analyze the expression of nonclassical HLA class I molecules. Hum Immunol. 2003;64(3):315–26. doi: 10.1016/s0198-8859(02)00821-2. [DOI] [PubMed] [Google Scholar]
- 32.Goldstein AS, Lawson DA, Cheng D, Sun W, Garraway IP, Witte ON. Trop2 identifies a subpopulation of murine and human prostate basal cells with stem cell characteristics. Proc Natl Acad Sci U S A. 2008;105(52):20882–7. doi: 10.1073/pnas.0811411106. [DOI] [PMC free article] [PubMed] [Google Scholar]
- 33.Lipinski M, Parks DR, Rouse RV, Herzenberg LA. Human trophoblast cell-surface antigens defined by monoclonal antibodies. Proc Natl Acad Sci U S A. 1981;78(8):5147–50. doi: 10.1073/pnas.78.8.5147. [DOI] [PMC free article] [PubMed] [Google Scholar]
- 34.Yagel S, Casper RF, Powell W, Parhar RS, Lala PK. Characterization of pure human first-trimester cytotrophoblast cells in long-term culture: growth pattern, markers, and hormone production. Am J Obstet Gynecol. 1989;160(4):938–45. doi: 10.1016/0002-9378(89)90314-1. [DOI] [PubMed] [Google Scholar]
- 35.Zhou Y, Fisher SJ, Janatpour M, Genbacev O, Dejana E, Wheelock M, et al. Human cytotrophoblasts adopt a vascular phenotype as they differentiate. A strategy for successful endovascular invasion? J Clin Invest. 1997;99(9):2139–51. doi: 10.1172/JCI119387. [DOI] [PMC free article] [PubMed] [Google Scholar]
- 36.Damsky CH, Fitzgerald ML, Fisher SJ. Distribution patterns of extracellular matrix components and adhesion receptors are intricately modulated during first trimester cytotrophoblast differentiation along the invasive pathway, in vivo. J Clin Invest. 1992;89(1):210–22. doi: 10.1172/JCI115565. [DOI] [PMC free article] [PubMed] [Google Scholar]
- 37.Viger RS, Guittot SM, Anttonen M, Wilson DB, Heikinheimo M. Role of the GATA family of transcription factors in endocrine development, function, and disease. Mol Endocrinol. 2008;22(4):781–98. doi: 10.1210/me.2007-0513. [DOI] [PMC free article] [PubMed] [Google Scholar]
- 38.Glenn DJ, Maurer RA. MRG1 binds to the LIM domain of Lhx2 and may function as a coactivator to stimulate glycoprotein hormone alpha-subunit gene expression. J Biol Chem. 1999;274(51):36159–67. doi: 10.1074/jbc.274.51.36159. [DOI] [PubMed] [Google Scholar]
- 39.Kim KK, Song SB, Kang KI, Rhee M, Kim KE. Activation of the thyroid-stimulating hormone beta-subunit gene by LIM homeodomain transcription factor Lhx2. Endocrinology. 2007;148(7):3468–76. doi: 10.1210/en.2006-1088. [DOI] [PubMed] [Google Scholar]
- 40.Apps R, Sharkey A, Gardner L, Male V, Trotter M, Miller N, et al. Genome-wide expression profile of first trimester villous and extravillous human trophoblast cells. Placenta. 2011;32(1):33–43. doi: 10.1016/j.placenta.2010.10.010. [DOI] [PMC free article] [PubMed] [Google Scholar]
- 41.Stepan LP, Trueblood ES, Hale K, Babcook J, Borges L, Sutherland CL. Expression of Trop2 cell surface glycoprotein in normal and tumor tissues: potential implications as a cancer therapeutic target. J Histochem Cytochem. 2011;59(7):701–10. doi: 10.1369/0022155411410430. [DOI] [PMC free article] [PubMed] [Google Scholar]
- 42.Giudice LC, Conover CA, Bale L, Faessen GH, Ilg K, Sun I, et al. Identification and regulation of the IGFBP-4 protease and its physiological inhibitor in human trophoblasts and endometrial stroma: evidence for paracrine regulation of IGF-II bioavailability in the placental bed during human implantation. J Clin Endocrinol Metab. 2002;87(5):2359–66. doi: 10.1210/jcem.87.5.8448. [DOI] [PubMed] [Google Scholar]
- 43.Zhao M, Qiu W, Li Y, Sang QA, Wang Y. Dynamic change of Adamalysin 19 (ADAM19) in human placentas and its effects on cell invasion and adhesion in human trophoblastic cells. Sci China Ser C, Life Sci/Chin Acad Sci. 2009;52(8):710–8. doi: 10.1007/s11427-009-0102-8. [DOI] [PubMed] [Google Scholar]
- 44.Horie A, Fujiwara H, Sato Y, Suginami K, Matsumoto H, Maruyama M, et al. Laeverin/aminopeptidase Q induces trophoblast invasion during human early placentation. Hum Reprod. 2012;27(5):1267–76. doi: 10.1093/humrep/des068. [DOI] [PubMed] [Google Scholar]
- 45.Higuchi T, Fujiwara H, Egawa H, Sato Y, Yoshioka S, Tatsumi K, et al. Cyclic AMP enhances the expression of an extravillous trophoblast marker, mela-noma cell adhesion molecule, in choriocarcinoma cell JEG3 and human chorionic villous explant cultures. Mol Hum Reprod. 2003;9(6):359–66. doi: 10.1093/molehr/gag044. [DOI] [PubMed] [Google Scholar]
- 46.Chern SR, Li SH, Chiu CL, Chang HH, Chen CP, Tsuen Chen EI. Spatiotemporal expression of SERPINE2 in the human placenta and its role in extravillous trophoblast migration and invasion. Reprod Biol Endocrinol. 2011;9:106. doi: 10.1186/1477-7827-9-106. [DOI] [PMC free article] [PubMed] [Google Scholar]
- 47.Iwawaki T, Akai R, Yamanaka S, Kohno K. Function of IRE1 alpha in the placenta is essential for placental development and embryonic viability. Proc Natl Acad Sci U S A. 2009;106(39):16657–62. doi: 10.1073/pnas.0903775106. [DOI] [PMC free article] [PubMed] [Google Scholar]
- 48.Bai Q, Assou S, Haouzi D, Ramirez JM, Monzo C, Becker F, et al. Dissecting the first transcriptional divergence during human embryonic development. Stem Cell Rev. 2012;8(1):150–62. doi: 10.1007/s12015-011-9301-3. [DOI] [PMC free article] [PubMed] [Google Scholar]
- 49.Maezawa K, Matsunaga T, Takezawa T, Kanai M, Ohira S, Ohmori S. Cytochrome P450 3As gene expression and testosterone 6 beta-hydroxylase activity in human fetal membranes and placenta at full term. Biol Pharm Bull. 2010;33(2):249–54. doi: 10.1248/bpb.33.249. [DOI] [PubMed] [Google Scholar]
- 50.Ugele B, St-Pierre MV, Pihusch M, Bahn A, Hantschmann P. Characterization and identification of steroid sulfate transporters of human placenta. Am J Physiol Endocrinol Metab. 2003;284(2):E390–8. doi: 10.1152/ajpendo.00257.2002. [DOI] [PubMed] [Google Scholar]
- 51.Phillips TA, Ni J, Hunt JS. Cell-specific expression of B lymphocyte (APRIL, BLyS)- and Th2 (CD30L/CD153)-promoting tumor necrosis factor superfamily ligands in human placentas. J Leukoc Biol. 2003;74(1):81–7. doi: 10.1189/jlb.0103033. [DOI] [PubMed] [Google Scholar]
- 52.Pijnenborg R, Vercruysse L, Hanssens M. The uterine spiral arteries in human pregnancy: facts and controversies. Placenta. 2006;27(9–10):939–58. doi: 10.1016/j.placenta.2005.12.006. [DOI] [PubMed] [Google Scholar]
- 53.Kliman HJ, Nestler JE, Sermasi E, Sanger JM, Strauss JF., 3rd Purification, characterization, and in vitro differentiation of cytotrophoblasts from human term placentae. Endocrinology. 1986;118(4):1567–82. doi: 10.1210/endo-118-4-1567. [DOI] [PubMed] [Google Scholar]
- 54.James JL, Stone PR, Chamley LW. Cytotrophoblast differentiation in the first trimester of pregnancy: evidence for separate progenitors of extravillous trophoblasts and syncytiotrophoblast. Reproduction. 2005;130(1):95–103. doi: 10.1530/rep.1.00723. [DOI] [PubMed] [Google Scholar]
- 55.McMaster MT, Librach CL, Zhou Y, Lim KH, Janatpour MJ, DeMars R, et al. Human placental HLA-G expression is restricted to differentiated cytotrophoblasts. J Immunol. 1995;154(8):3771–8. [PubMed] [Google Scholar]
- 56.Cross JC, Anson-Cartwright L, Scott IC. Transcription factors underlying the development and endocrine functions of the placenta. Recent Prog Horm Res. 2002;57:221–34. doi: 10.1210/rp.57.1.221. [DOI] [PubMed] [Google Scholar]
- 57.Vasicek R, Meinhardt G, Haidweger E, Rotheneder H, Husslein P, Knofler M. Expression of the human Hand1 gene in trophoblastic cells is transcriptionally regulated by activating and repressing specificity protein (Sp)-elements. Gene. 2003;302(1–2):115–27. doi: 10.1016/s0378-1119(02)01096-x. [DOI] [PubMed] [Google Scholar]
Associated Data
This section collects any data citations, data availability statements, or supplementary materials included in this article.