Abstract
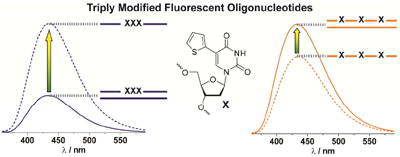
5-(Thien-2-yl)-2’-deoxyuridine, an isomorphic fluorescent nucleoside analog, was incorporated into multiple positions within single stranded oligodeoxynucleotides. With minimal impact on duplex stability and overall structure, oligonucleotides containing three identical isomorphic fluorescent nucleosides in alternating or neighboring positions display enhanced, sequence-dependent on-signals for either duplex formation or dissociation.
The biological roles of nucleic acids have been demonstrated to be highly dependent on transient secondary and tertiary structures. Although structural studies offer a window into local structural changes, only techniques with the appropriate time scales, such as fluorescence spectroscopy, offer a convenient real-time monitoring of such processes. Although the native nucleosides in DNA and RNA are virtually non-emissive,1 synthetic isomorphic fluorescent nucleoside analogs have enabled the monitoring of nucleic acid dynamics, conformational changes and recognition by diverse ligands.2,3 With little to no impact on native behavior, such minimally perturbing nucleoside analogs can enable the visualization of local structural changes.4-5
Isomorphic fluorescent nucleoside analogs have been successfully employed in biophysical assays to detect abasic and oxidized sites,6,7 as well as facilitate the detection of single nucleotide polymorphisms (SNPs),8 and nucleic acid–drug interactions.4,5,9,10 Typically a single fluorescent nucleoside analog is used. Even with an appreciable response to changes in their microenvironment, many of these small fluorophores suffer from a relatively low quantum yield or significantly diminished brightness upon incorporation into oligonucleotides. Since fluorescent probes may display sensitivity to other chromophores and fluorophores through ground-state and excited-state interactions, one can take advantage of multichromophoric systems to elicit an enhanced fluorescence signal response. In this contribution, we report the preparation as well as the biophysical and photophysical investigation of oligonucleotides in which multiple positions are replaced with isomorphic fluorescent nucleoside analogs.
Several studies have been reported with oligonucleotides that contain multiple fluorophores.11-13 Only a few have been designed to minimize significant structural perturbations. In one relevant study the isomorphic fluorescent nucleoside analog 2-aminopurine (2-AP) was used to probe the electronic properties of DNA duplexes.13 The emissive 2-AP was placed in several strategic positions throughout the duplex, and the resulting excitonic and exciplex states were analyzed, providing insight into the excited state electronic behavior of a duplex.
We have previously developed a series of nucleoside analogs based upon conjugating an aromatic residue to the 5-position of pyrimidines.14-16 This non-perturbing modification extends the π-system, rendering these modified nucleosides emissive. A single bond attaching a 5-membered ring, such as a thiophene or a furan, to the 5-position imparts molecular rotor behavior.17 In viscous media, free rotation about this single bond between the 5-membered ring and the pyrimidine residue is hampered, resulting in an enhanced fluorescence quantum yield. Oligonucleotides, singly modified with such 5-modified fluorescent nucleosides have been used in a number of biophysical assays.6,18 Here we evaluate the biophysical and photophysical features of oligonucleotides, which contain multiple incorporations of 5-(thien-2-yl)-2’-deoxyuridine (1, Scheme 1), an isomorphic fluorescent T analog, and compare the behavior of oligonucleotides with distinct nucleotide substitution patterns.
Scheme 1.
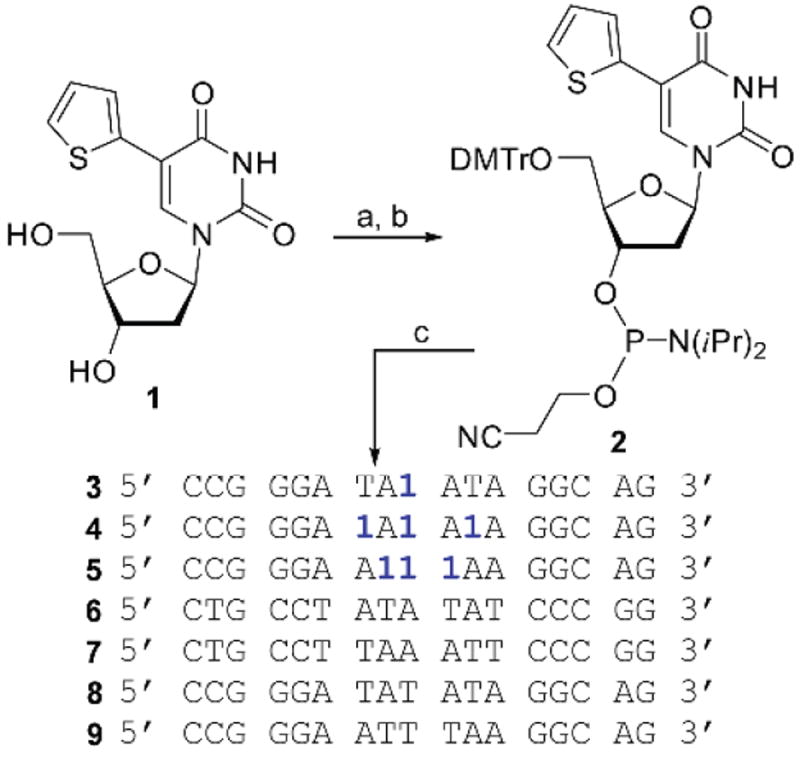
Synthesis of phosphoramidite 2 and oligonucleotides a
a Reagents and condition: a) 4,4’-dimthexoy-trityl chloride, TEA, pyridine, 85%; b) (iPr2N)2 POCH2CH2CN, 1H-tetrazole, MeCN, 63%; c) standard solid phase synthesis.
Nucleoside 1 was prepared through a standard palladium-mediated cross-coupling reaction between 5-iodo-2’-deoxyuridine and 2-(tributylstannyl)thiophene as reported.6,19 The 5’-OH was protected with 4,4’-dimethoxytrityl chloride (DMTrCl). Phosphitylation with 2-cyanoethyl N,N,N’,N’-tetraisopropylphospordiamidite in the presence of 1H-tetrazole afforded the 5’-DMT-protected phosphoramidite 2 (Scheme 1). Modified oligonucleotides 3–5 were prepared using started cycles following the design criteria articulated below, along the complementary oligonucleotides (6–7), which required only commercially available building blocks. The resulting oligonucleotides were cleaved, deprotected, gel-purified, de-salted and characterized by MALDI-TOF mass spectrometry and detailed photophysical analysis (Table 1 in Experimental)).
Table 1.
MALDI-TOF determined masses for all synthesized oligonucleotides
| Oligonucleotide | Calculated Mass | Found Mass |
|---|---|---|
| 3 | 5327.5 | 5327.8 |
| 4 | 5463.7 | 5464.3 |
| 5 | 5454.7 | 5453.4 |
| 6 | 5121.4 | 5121.7 |
| 7 | 5130.4 | 5130.3 |
| 8 | 5121.4 | 5121.7 |
| 9 | 5130.4 | 5130.3 |
Each 17mer sequence includes a single incorporation or three incorporations of the fluorescent nucleoside. The highest possible sequence homology was maintained across the oligonucleotide series. Oligonucleotide 3 contains a single incorporation of 1 in a central position and serves as a reference for emission intensity and behavior of a single fluorescent nucleotide within a medium length oligomer. Oligonucleotide 4 contains three incorporations of 1 in central positions, each alternating with dA residues. Finally, oligonucleotide 5 contains three incorporations of 1 in adjacent positions. All sequences contain short dG- and dC-rich stretches near their termini to maintain adequate thermodynamic stability of the duplexes formed with their perfect complements (6 and 7).
To investigate the basic photophysical characteristics of 1, its absorption and emission spectra were recorded in water, dioxane, and mixtures thereof (Figure 1). Both the absorption and emission spectra of 1 respond to changes in polarity. Going from dioxane to water the absorption maximum undergoes a hypsochromic shift from 320 nm to 314 nm, while the emission maximum shifts bathochromically from 416 nm to 439 nm. Close to linear relationship between sample ET(30) value, a microenvironmental polarity parameter,20 and the Stokes shift (νabs–νem) is obtained (Figure 2a).21 Interestingly, marked non-linear changes in intensity are observed in the emission spectra. Fluorophores like 1, consisting of a molecular rotor element, two π-systems separated by a single bond, are known to be responsive to solvent viscosity.17,22,23 Even though mixtures of dioxane and water are commonly used to control sample polarity,24,25 they also impart small non-linear changes in viscosity.26 Both changes in emission intensity of 1 and medium viscosity as a function of the water fraction in dioxane are plotted (Figure 2b). The two maxima almost concur, strongly indicating that the observed fluorescence intensity changes are indeed the result of viscosity changes.
Fig. 1.
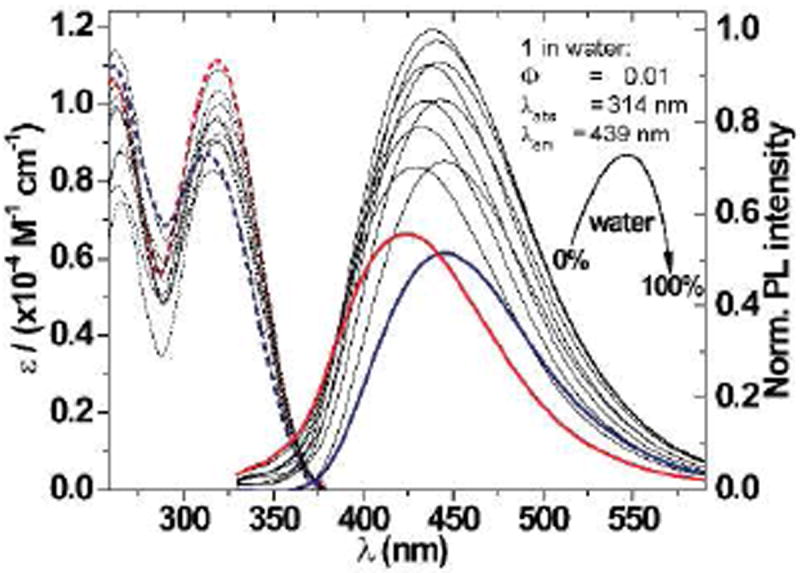
Absorption (dashed) and emission (solid) spectra of 1 in water (blue), dioxane (red), and mixtures thereof (grey).
Fig. 2.
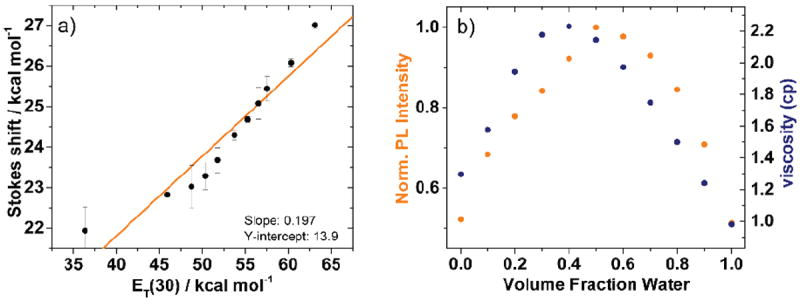
a) Stokes shift vs. sample ET(30) values with a linear fit (orange line, R2 = 0.899), and b) Fluorescence intensity at 440 nm (solid orange circles) and the change in sample viscosity (solid blue circles) as a function of the volume fraction of water in dioxane.
To assess the impact of replacing native residues with the thiophene-containing pyrimidine analog, the basic biophysical features of the modified oligonucleotides were evaluated. All oligonucleotides form stable DNA duplexes as determined by thermal denaturation studies (Figure 3a). The measured Tm values for 3•6, 4•6, and 5•7 (59 °C, 57 °C, and 61 °C, respectively) closely resemble the Tm values for the native strands 6•8 and 7•9 (59 °C and 62 °C, respectively). The adjacent modified nucleosides appear to impart an increase in duplex stability compared to the other modified oligonucleotides, likely due to favorable (albeit weak) interactions of the thiophene moieties.
Fig. 3.
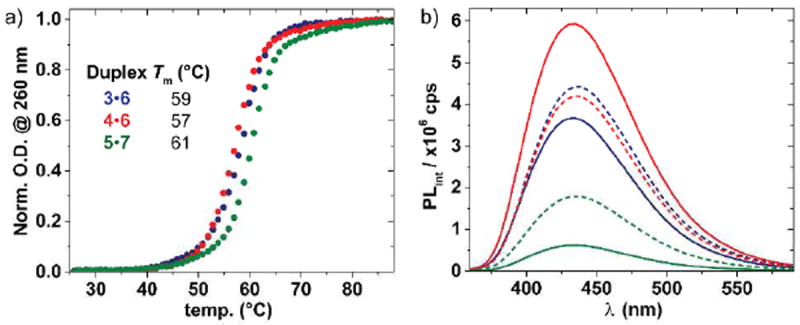
a) Thermal denaturation curves (solid circles) and b) fluorescence spectra (solid lines) of duplexes 3•6 (blue), 4•6 (red), and 5•7 (green) and single strands 3, 4, and 5 (dashed lines). Samples consist of 5 μM ssDNA or dsDNA in 10 mM phosphate buffer containing 100 mM NaCl at pH 7. Fluorimeter settings: λex = 332 nm and 5 nm excitation and emission slit widths.
To confirm proper double helix formation of modified oligonucleotides 3•6, 4•6, and 5•7, circular dichroism spectroscopy was used to examine their secondary structure. All modified oligonucleotides displayed spectral characteristics of a B-form DNA helix (Figure 4a). Of note is the additional Cotton effect seen in duplex 5•7 centered around 320 nm, near the red-shifted absorbance band in the absorption spectrum (Figure 4b). This feature, which is much less apparent in the spectrum of duplex 4•6 where the fluorescent nucleosides are separated, may further indicate an alignment of the adjacent thiophene moieties.
Fig. 4.
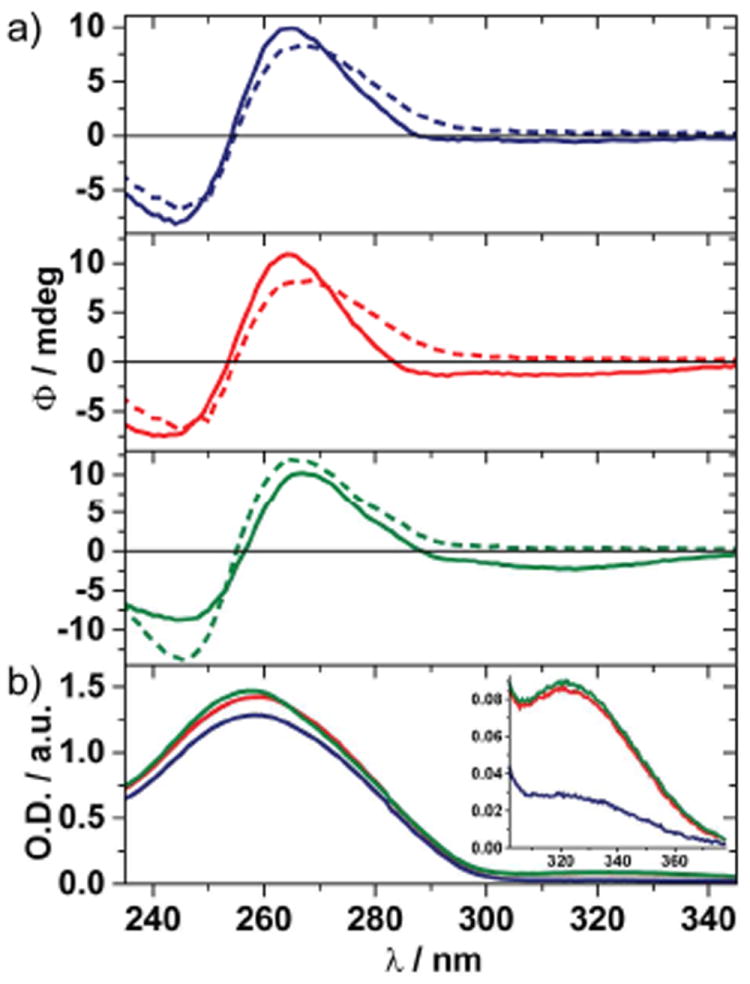
a) CD spectra, and b) absorption spectra of 3•6 (blue), 4•6 (red), 5•7 (green), and CD spectra of native control duplexes (dashed lines). Samples consist of 25 μM dsDNA in 10 mM phosphate buffer containing 100 mM NaCl at pH 7. Fluorimeter settings: λex = 332 nm and 5 nm excitation and emission slit widths.
The fluorescence emission spectra of each oligonucleotide as a single strand and when hybridized to its perfect complement show distinct photophysical behavior (Figure 3b). All oligonucleotides display an emission maximum near 438 nm, with no significant wavelength shift compared to the emission of nucleoside 1 in water. The fluorescence emission of singly modified oligonucleotide 3 is slightly quenched by duplex formation (3•6), a phenomenon commonly observed with fluorescent nucleoside analogs.2
Interestingly, as a single-strand, modified oligonucleotide 4, with three alternating incorporations of nucleoside 1, has nearly identical fluorescence intensity as the singly modified oligonucleotide 3. Upon hybridization with its native perfect complement (4•6), the fluorescence emission dramatically increases. Both sequences in 3 and 4 have adenine residues surrounding the modified nucleoside. However, upon hybridization, the fluorescence emission behaves in opposite fashion for each strand (3•6 vs. 4•6). This behavior suggests that chromophore–chromophore self-quenching interactions in the single strand 4, facilitated by the relatively high conformational flexibility of the single stranded oligomer, are disrupted upon formation of a highly ordered duplex, where the chromophores are forced to be spatially separated.
In stark contrast, oligonucleotide 5, with three adjacent incorporations of nucleoside 1, has significantly lower fluorescence emission in the single strand. This low intensity is diminished even further upon hybridization (5•7), which suggests an even more effective self-quenching mechanism between the adjacent modified nucleosides (and perhaps their neighbors). While the underlying mechanism responsible for the observed quenching in 4 and 5 is likely to be the same, their distinct behavior upon duplex formation reflects the effective chromophore–chromophore separation enforced by hybridization, which is apparent in 4•6.
Recognizing the sensitivity of nucleoside 1 to both environmental and local dynamic effects, we next investigated the impact of temperature on the photophysical features of the two distinctly behaving multichromophoric DNA duplexes: 4 vs. its duplex 4•6, and 5 vs. 5•7. Temperature dependent fluorescence spectra of the two systems were taken between 90°C and 18°C with 4 °C intervals (Figures 5a and 5b). Corroborating our room temperature findings (Figure 3b), annealing 4 to 6, by gradually lowering the temperature, results in an intensification of the fluorescence intensity. Likewise, annealing 5 to 7 results in an intensification, albeit more modest, of the fluorescence response. The latter finding challenges the observations made at room temperature and suggests temperature effects are partly responsible for the observed differences (Figure 3b).
Fig. 5.
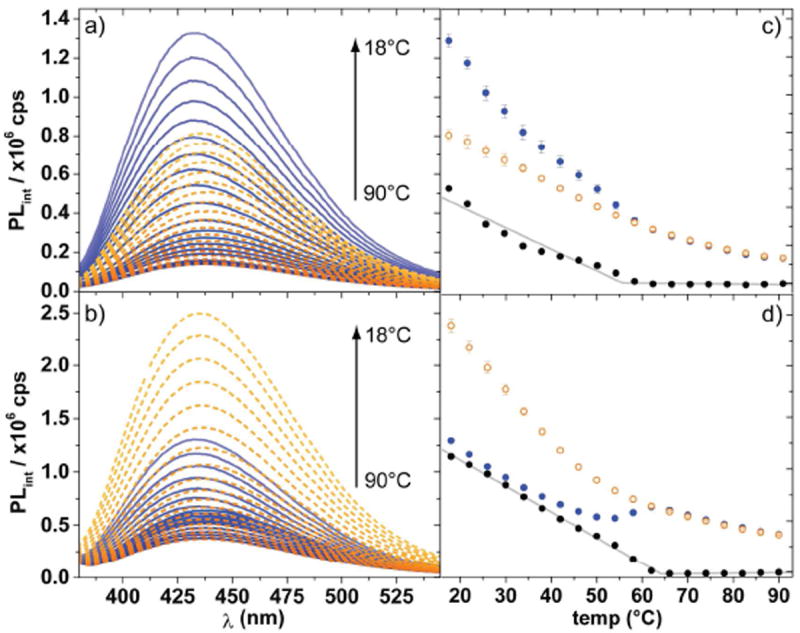
Temperature dependent fluorescence spectra of duplex (blue solid lines) and single strand (orange dashed lines) for a) 4•6, and 4, b) 5•7, and 5; and average fluorescence intensity at 433 nm vs. temperature for duplex (solid blue circles), single strand (orange circles), and the difference (solid black circles) with piecewise linear fits (grey lines) for c) 4•6, and 4, d) 5•7, and 5. Samples consist of 5 μM ssDNA or dsDNA in 10 mM phosphate buffer containing 100 mM NaCl at pH 7. Fluorimeter settings: λex = 332 nm and 3.6 nm excitation and emission slit widths.
The influence of temperature, in addition to the denaturation/annealing effect, on the fluorescence signal may be accounted for by measuring the modified single strand in a separate, simplified ‘control’ experiment. Single strand 4 fluoresces with higher efficiency upon lowering the temperature, but to a much smaller extent than duplex 4•6 (Figure 5a). Single strand 5, however, shows a significantly larger increase upon cooling than the intensification in fluorescence observed for the duplex 5•7 (Figure 5b). The fluorescence intensity at 433 nm was plotted as a function of temperature illustrating a stark contrast in the degree of fluorescence intensification upon annealing for each modified oligonucleotide (Figures 5c and 5d). Both graphs suggest that the inception of the growing deviation in fluorescence intensity of single strand and duplex corresponds closely to the melting transition temperature determined by monitoring absorbance at 260 nm (Figure 3a).
To correct, at least partially, for temperature effects on the chromophores’ emission, the difference between the fluorescence of the single strand and the corresponding duplex were plotted (Figures 5c and 5d). The inflection of this “difference plot” underlines that the stark changes in fluorescence signal coincide with the melting of the duplex. Recognizing the two possibly linear components in the difference plot, a piecewise linear fit analysis was performed (Figures 5c and 5d). The intersection of the two linear segments for the difference plot of duplex 4•6, and single strand 4 is 55.5°C, which approximates the 57°C melting transition temperature (Tm) observed (Figure 3a). The 5•7 duplex is characterized by a Tm of 61°C (Figure 3a), which correlates nicely to 64.1°C, the intersection of the two linear segments that make up the difference plot (Figure 5d).
To put these observations in perspective, one recognizes that both increases and decreases in fluorescence intensity may be effectively used as signals to monitor hybridization, conformational changes and ligand binding events.27 As systems become increasingly complex, however, diminished fluorescence signals are a less reliable outcome, since fluorescence quenching might be caused by any number of molecules and phenomena leading to incorrect interpretation. In contrast, increases in fluorescence emission, referred to as an “on-signal”, are rarely observed due to such unrelated phenomena.
As seen in Figure 5a, upon hybridization of 4, duplex 4•6 exhibits a large increase in fluorescence intensity. This increase in fluorescence can be used to follow duplex formation in real time. Additionally, at room temperature, the fluorescence intensity of the single strand 5 is significantly higher than duplex 5•7, allowing for monitoring of duplex denaturation (Figure 5b).28
We further note that determination of the melting transition temperature (Tm) of a duplex using the fluorescence signal of a singly incorporated fluorescent nucleoside has been previously reported.6 Therein the Tm curve obtained by fluorescence spectroscopy was, like the absorption derived curves, sigmoidal in shape with closely matching values for the Tm. Herein, using a far more complex system with triply incorporated fluorescent nucleosides analogs in two different contexts, we do not observe sigmoidal melting curves. Even with the greater complexity and multitude of effects that may impact the overall temperature-dependent fluorescence changes, careful data analysis allows for estimation of the melting temperature that correlates well with classically determined Tm values.
The studies illustrated above successfully demonstrate the utility of multiply-modified oligonucleotides in two model systems. The enhanced fluorescence signal obtained from these oligonucleotides may prove useful in biophysical assays. Instead of adding a large, structurally perturbing fluorophore to gain brightness, several modified isomorphic analogs may be employed. Not only do these nucleosides allow for more biologically accurate secondary structures, they can be easily prepared by standard solid-phase oligonucleotide synthesizers and, in certain cases, by enzymatic means.
Experimental Section
General procedures
Reagents were purchased and used without further purification unless otherwise specified. Anhydrous N,N-dimethylformamide was obtained using a two-column purification system. NMR solvents were purchased from Cambridge Isotope Laboratories (Andover, MA). Reactions were monitored with analytical thin-layer chromatography (TLC) performed on pre-coated silica gel aluminum-backed plates. All experiments involving air and/or moisture sensitive compounds were carried out under an argon atmosphere. Column chromatography was performed with silica gel particle size 40-63 μm. All absorption measurements were obtained at 21 °C using a quartz cuvette with a 1.0 cm path length. Steady state fluorescence measurements were obtained using a quartz fluorescence cell with a 1.0 cm path length. All CD spectra were recorded in a 350 μL quartz cell with a path length of 0.1 cm at 25 °C.
Synthetic procedures
5-(thien-2-yl)-3’-(2-cyanoethyldiisopropylphosphoramidite)-5’-O-(4,4’-dimethoxytrityl)-2’-deoxythymidine (2)
5-(thien-2-yl)-5’-O-(4,4’-dimethoxytrityl)-2’-deoxythymidine. This compound was synthesized and purified by reported procedures.6,19,29
5-(thien-2-yl)-3’-(2-cyanoethyldiisopropylphosphoramidite)-5’-O-(4,4’-dimethoxytrityl)-2’-deoxythymidine (2). DMT-protected 1 (727 mg, 1.19 mmol) was dissolved in anhydrous acetonitrile (21.2 mL) and stirred at room temperature. To this mixture, 2-cyanoethyl N,N,N’,N’-tetraisopropylphospordiamidite (415 μL, 1.31 mmol) was added via syringe and allowed to stir under argon. To this mixture, 1H-tetrazole (2.64 mL, 0.45 M in acetonitrile, 1.19 mmol) was added dropwise via syringe over thirty minutes. The reaction mixture was stirred at room temperature for 4 hours, monitoring closely by TLC (DCM/MeOH 9/1). The reaction was quenched with a few drops of methanol and dried to a white foam under reduced pressure. The product was purified by flash silica column chromatography (98/1/1 Chloroform/MeOH/triethylamine) to produce a mixture of diastereomers as a bright white foam (610 mg, 0.75 mmol, 63% yield). 1H NMR (CDCl3, 400 MHz): δ 7.88 (s, 1H), 7.40–7.38 (d, J=7.9 Hz, 2H), 7.28–7.18 (m, 7H), 7.15–7.13 (m, 1H), 6.85–6.84 (m, 1H), 6.77–6.75 (m, 1H), 6.77–6.75 (d, J=8.9, 4H), 6.71–6.69 (m, 1H), 6.41–6.38 (m, 1H), 4.63–4.58 (m, 1H), 4.25–4.21 (m, 1H), 3.86–3.79 (m, 1H), 3.74 (s, 6H), 3.61–3.52 (m, 2H), 3.43–3.40 (m, 1H), 3.34–3.30 (m, 1H), 2.80–2.75 (m, 1H), 2.64–2.61 (t, J=6.3, 2H), 2.32–2.25 (m, 1H), 1.28–1.25 (m, 1H), 1.18–1.16 (d, J=6.8 Hz, 6H), 1.08–1.06 (d, J=6.8 Hz, 6H); 13C NMR (CDCl3, 100 MHz): δ 161.5, 158.8, 149.7, 144.5, 135.6, 134.6, 133.2, 130.3, 128.4, 128.2, 127.3, 125.9, 124.6, 117.6, 113.4, 110.7, 94.5, 87.0, 86.0, 85.5, 63.3, 58.3, 55.4, 43.6, 40.4, 24.8, 20.4; 31P NMR (CDCl3, 162 MHz): δ 150.0, 149.6; HRMS: [M + Na]+ calculated for C43H49N4O8PSNa+, 835.2901; found, 835.2911.
Oligonucleotide synthesis and purification
All modified and native oligonucleotides were synthesized on a DNA synthesizer at 1.0 μmole scale (500 Å CPG). Phosphoramidite 2 was dissolved in anhydrous acetonitrile at a concentration of 100 mg/mL and placed directly onto a port on the DNA synthesizer. All standard phosphoramidites (5′-dimethoxytrityl-N-benzoyl-2′-deoxyadenosine-3′-[(2-cyanoethyl)-(N,N-diisopropyl)] phosphoramidite, 5′-dimethoxytrityl-N-benzoyl-2′-deoxycytidine-3′-[(2-cyanoethyl)-(N,N-diisopropyl)] phosphoramidite, 5′-dimethoxytrityl-N-isobutyryl-2′-deoxyguanosine-3′-[(2-cyanoethyl)-(N,N-diisopropyl)] phosphoramidite, and 5′-dimethoxytrityl-2′-deoxythymidine-3′-[(2-cyanoethyl)-(N,N-diisopropyl)] phosphoramidite) were purchased from Glen Research (Sterling, VA) and dissolved in anhydrous acetonitrile to prepare solutions at 25 mg/mL. The coupling time for phosphoramidite 2 was increased to 253 seconds, and all other couplings were performed via standard, trityl-off procedures, utilizing standard capping, coupling, oxidizing, and deprotection solutions.
Columns containing CPG-oligonucleotides were removed from the DNA synthesizer and residual solvent was removed under reduced pressure. The plastic columns containing the solid CPG support were cut open and the contents were placed into 5mL reaction vessels. To each vial, 3mL of 30% aqueous ammonium hydroxide was added, and the vessel was sealed at 55 °C overnight. After allowing the reaction vessels to cool to room temperature, excess ammonia was removed under a steady stream of argon gas. The remaining water was lyophilized and the samples were resuspended in 150 μL or less of 7 M urea in 1X TBE buffer. Samples were loaded onto a pre-heated 20% polyacrilamide gel and run at roughly 300 mM for 6 hr. Resulting UV-active bands were excised from the gel, and the oligonucleotides were extracted into 4.0 mL 0.5 NaOAc buffer (pH 7.4) at room temperature overnight. Samples were de-salted by loading oligonucleotides onto C-18 Sep-Pak columns, rinsing with water, and eluting with 40% acetonitrile in water. Samples containing oligonucleotides (determined by UV-vis profile) were lyophilized and dissolved in 1 mL deionized water. Oligonucleotides were quantified based on absorption at 260 nm and the calculated (nearest neighbor method) molar extinction coefficient (http://www.ambion.com/techlib/misc/oligo_calculator.html). MALDI-TOF spectra were obtained in 3-hydroxypiccolinic acid matrix with ammonium citrate buffer, after mixing with ion-exchange resin using a 25mer DNA standard for calibration. See table 1 for all calculated and found masses.
Oligonucleotide hybridizations
All oligonucleotide samples were prepared in 5 μM solutions of 100 mM NaCl in 10 mM sodium phosphate buffer (pH 7.0). Samples were heated to 95 °C for 5 minutes and cooled to room temperature over 2–3 hrs. Samples were then placed at 0 °C until spectroscopic measurements were obtained. UV-Vis spectra were obtained on an absorption spectrometer using a 125 μL quartz cuvette with a 1.0 cm path length at 21 °C. Steady-state fluorescence spectra were obtained on a using a 125 μL quartz fluorescence cell with a 1.0 cm path length at 21 °C with slit widths of 5 nm (unless otherwise noted). All samples were excited at a wavelength of 332 nm. Thermal denaturation curves were obtained with a high performance temperature controller and a micro auto six sample holder. Samples were heated from room temperature to 80 °C at a rate of 0.5 °C min-1 with optical monitoring every minute at 260 nm. Software provided on the spectrometer determined the first derivative from the melting profile to calculate the inflection point/Tm (estimated error ± 0.5 °C). For CD spectra, samples were prepared to contain 25 μM of the duplex in 100 mM NaCl, 10mM sodium phosphate buffer (pH 7).
Photophysics in water, dioxane, and mixtures thereof
Spectroscopic grade dimethylsulfoxide (DMSO) and dioxane were used. For all spectroscopic measurements a 1 cm four-sided quartz cuvette was used. Sample concentrations where used to arrive at an O.D. ~ 0.1 at λex. Spectroscopy samples were prepared from a concentrated DMSO stock-solution, hence, all sample solutions contain 0.4 v% DMSO. The polarity dependent steady state fluorescence studies were performed using an excitation wavelength of 314 nm (slit-widths: 6 nm), using sample concentrations of 10 mM. Both a Horiba Fluoromax 3 spectrofluorometer and a PTI luminescence spectrometer were used and parameters are listed in the figure captions. Stokes shifts, in cm−1, were calculated after correction of the emission intensity according the following equation: Intensity [ν] = λ2 × Intensity [λ].27 The cm−1 units were converted to kcal/mol by multiplication with 0.0028591 to plot the polarity sensitivity plot. The study was performed in duplicate, average values are plotted, and the error bars represent the standard error of mean as calculated by OriginPro.
Sample ET(30) values (in kcal/mol) were determined by dissolving a small amount of Reichardt’s dye in the solvent(mixture) used to prepare the sample.20 The observed long−wavelength absorption maximum in nm (λabsmax) was converted to the sample ET(30) value according the following equation:
Due to solubility limitations of Reichardt’s dye, the literature ET(30) value for pure water was used.20
Viscosity correlation
Viscosity values for mole fractions water in dioxane mixtures are reported in centipoise (cp).26 A total of 28 points were taken from the available dataset and graphed in a plot of viscosity as a function of mole fraction water in dioxane. A polynomial fit of the selected data was performed using OriginPro to establish a mathematical relationship that allows for calculated interpolation (Figure 6). Subsequently, the fit was used to calculate the viscosity of the sample after conversion of volume to mole fractions.
Fig. 6.
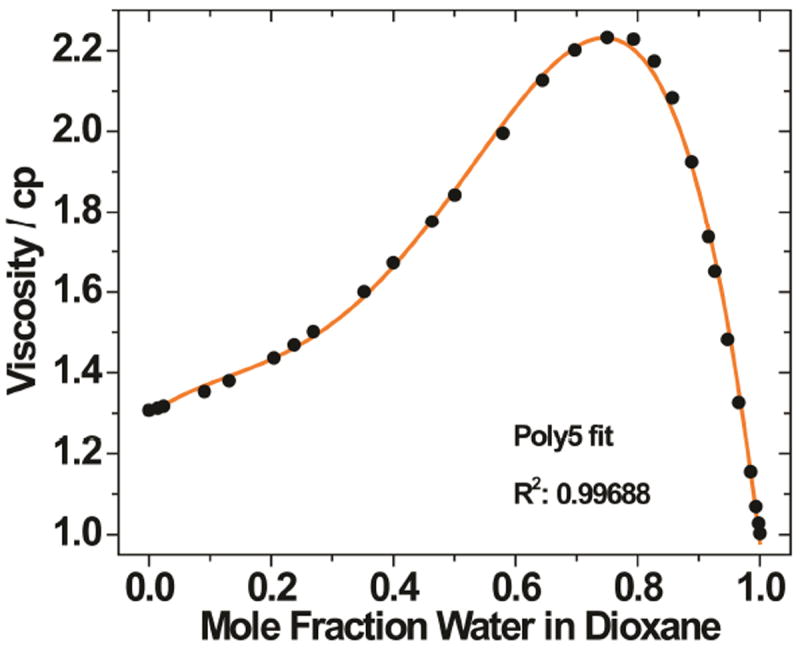
Viscosity as a function of mole fraction water in dioxane (black circles). A polynomial fit (orange line, R2 = 0.997) allows for interpolation.
Temperature dependent steady state fluorescence spectroscopy
Single strand and duplex samples were prepared as 5 mM solutions in 10 mM phosphate buffer containing 100 mM NaCl at pH 7. Aliquots of 500 mL were transferred to a 600 mL fluorescence cell and capped with a Teflon stopper. Prior to the temperature study, samples were heated for 5 minutes at 90°C in the cuvette holder followed by the recording of the fluorescence after excitation at 332 nm using slit widths of 3.6 nm (for 4•6 and 4) or 6.0 nm (for 5•7 and 5). Subsequently, the temperature was lowered to 18°C with 4°C intervals. The fluorescence was measured at every temperature after a 2 minute settle time. All samples are measured in triplicate. Averaged values for the fluorescence intensity at 433 nm and their standard error of mean are calculated using OriginPro 9.0. The difference plot is fit to two linear functions using the “Piecewise Linear” function in OriginPro.30 The intersection of the piecewise linear fits (grey lines) are 55.5°C (R2: 0.95647), and 64.1°C (R2: 0.99875) for Figure 5c) and 5d), respectively.
Supplementary Material
Acknowledgments
We thank the National Institutes of Health for their generous support (GM 069773) and the NSF (Instrumentation Grant CHE-0741968).
Footnotes
Supporting Information
Additional fluorescence data including thermal melting data and corresponding plots, and NMR spectra of compound 2. This material is available free of charge via the Internet at http://pubs.acs.org.
References
- 1.Daniels M, Hauswirth W. Science. 1971;171:675–677. doi: 10.1126/science.171.3972.675. [DOI] [PubMed] [Google Scholar]
- 2.Sinkeldam RW, Greco NJ, Tor Y. Chem Rev. 2010;110:2579–2619. doi: 10.1021/cr900301e. [DOI] [PMC free article] [PubMed] [Google Scholar]
- 3.Wilhelmsson LM. Q Rev Biophys. 2010;43:159–183. doi: 10.1017/S0033583510000090. [DOI] [PubMed] [Google Scholar]
- 4.Kaul M, Barbieri CM, Pilch DS. J Am Chem Soc. 2004;126:3447–3453. doi: 10.1021/ja030568i. [DOI] [PubMed] [Google Scholar]
- 5.Shandrick S, Zhao Q, Han Q, Ayida BK, Takahashi M, Winters GC, Simonsen KB, Vourloumis D, Hermann T. Angew Chem Int Ed. 2004;43:3177–3182. doi: 10.1002/anie.200454217. [DOI] [PubMed] [Google Scholar]
- 6.Greco NJ, Tor Y. J Am Chem Soc. 2005;127:10784–10785. doi: 10.1021/ja052000a. [DOI] [PubMed] [Google Scholar]
- 7.Greco NJ, Sinkeldam RW, Tor Y. Org Lett. 2009;11:1115–1118. doi: 10.1021/ol802656n. [DOI] [PMC free article] [PubMed] [Google Scholar]
- 8.Xie Y, Maxson T, Tor Y. Org Biomol Chem. 2010;8:5053–5055. doi: 10.1039/c0ob00413h. [DOI] [PMC free article] [PubMed] [Google Scholar]
- 9.Srivatsan SG, Tor Y. J Am Chem Soc. 2007;129:2044–2053. doi: 10.1021/ja066455r. [DOI] [PMC free article] [PubMed] [Google Scholar]
- 10.Xie Y, Dix AV, Tor Y. J Am Chem Soc. 2009;131:17605–17614. doi: 10.1021/ja905767g. [DOI] [PMC free article] [PubMed] [Google Scholar]
- 11.Teo YN, Wilson JN, Kool ET. J Am Chem Soc. 2009;131:3923–3933. doi: 10.1021/ja805502k. [DOI] [PMC free article] [PubMed] [Google Scholar]
- 12.Mayer-Enthart E, Wagenknecht HA. Angew Chem Int Ed. 2006;45:3372–3375. doi: 10.1002/anie.200504210. [DOI] [PubMed] [Google Scholar]
- 13.Rist M, Wagenknecht HA, Fiebig T. ChemPhysChem. 2002;3:704–707. doi: 10.1002/1439-7641(20020816)3:8<704::AID-CPHC704>3.0.CO;2-F. [DOI] [PubMed] [Google Scholar]
- 14.Srivatsan SG, Tor Y. J Am Chem Soc. 2007;129:2044–2053. doi: 10.1021/ja066455r. [DOI] [PMC free article] [PubMed] [Google Scholar]
- 15.Srivatsan SG, Greco NJ, Tor Y. Angew Chem. 2008;120:6763–6767. doi: 10.1002/anie.200802199. [DOI] [PMC free article] [PubMed] [Google Scholar]; Angew Chem, Int Ed. 2008;47:6661–6665. doi: 10.1002/anie.200802199. [DOI] [PMC free article] [PubMed] [Google Scholar]
- 16.Shin D, Sinkeldam RW, Tor Y. J Am Chem Soc. 2011;133:14912–14915. doi: 10.1021/ja206095a. [DOI] [PMC free article] [PubMed] [Google Scholar]
- 17.Sinkeldam RW, Wheat AJ, Boyaci H, Tor Y. Chemphyschem. 2011;12:567–570. doi: 10.1002/cphc.201001002. [DOI] [PMC free article] [PubMed] [Google Scholar]
- 18.Sinkeldam RW, Greco NJ, Tor Y. ChemBioChem. 2008;9:706–709. doi: 10.1002/cbic.200700714. [DOI] [PubMed] [Google Scholar]
- 19.(a) Wigerinck P, Pannecouque C, Snoeck R, Claes P, De Clercq E, Herdewijn P. J Med Chem. 1991;34:2383–2389. doi: 10.1021/jm00112a011. [DOI] [PubMed] [Google Scholar]; (b) Gutierrez AJ, Terhorst TJ, Matteucci MD, Froehler BC. J Am Chem Soc. 1994;116:5540–5544. [Google Scholar]
- 20.Reichardt C. Chem Rev. 1994;94:2319–2358. [Google Scholar]
- 21.Sinkeldam RW, Tor Y. Org Biomol Chem. 2007;5:2523–2528. doi: 10.1039/b707719j. [DOI] [PubMed] [Google Scholar]
- 22.Haidekker MA, Theodorakis EA. Org Biomol Chem. 2007;5:1669–1678. doi: 10.1039/b618415d. [DOI] [PubMed] [Google Scholar]
- 23.Foerster T, Hoffmann G. Z Phys Chem. 1971;75:63–76. [Google Scholar]
- 24.Critchfield FE, Gibson JA, Hall JL. J Am Chem Soc. 1953;75:1991–1992. [Google Scholar]
- 25.Wohlfahrt C, editor. Numerical Data and Functional Relationships in Science and Technology. Group IV. Static and Dielectric constants of Pure Liquids and Binary Liquid Mixtures. Vol. 6. Landolt-Bornstein, Springer-Verlag; Berlin, Heidelberg: 1991. [Google Scholar]
- 26.Ouerfelli N, Iulian O, Bouaziz M. Phys Chem Liq. 2010;48:488–513. [Google Scholar]
- 27.Lakowicz JR. Principles of Fluorescence Spectroscopy. 3. Springer; New York: 2006. [Google Scholar]
- 28.Multiple quenching mechanisms might be operative, depending on the specific oligonucleotide and its sequence context. A static quenching model can be envisioned, particularly for multiply-modified oligonucleotides and their duplexes, due to the close proximity of the chromophores. Note, however, that distinguishing between various quenching mechanisms in such oligonucleotides is complex, since they are intramolecular in nature. As a result, the photophysical behavior of the oligonucleotides is unlikely to depend on concentration (at least in relatively dilute solutions). An additional complicating factor is the susceptibility of the photphysical characteristics of these chromophores to multiple environmental effects (polarity, viscosity, temperature, etc.).
- 29.Emissive thiophene-modified purines have been reported; see: Kimoto M, Mitsui T, Harada Y, Sato A, Yokoyama S, Hirao I. Nucl Acids Res. 2007;35:5360–5369. doi: 10.1093/nar/gkm508.. Yamashige R, Kimoto M, Takezewa Y, Sato A, Mitsui T, Yokoyama S, Hirao I. Nucleic Acids Res. 2012;40:2793–2806. doi: 10.1093/nar/gkr1068.
- 30.http://wiki.originlab.com/~originla/howto/index.php?title=Tutorial:Fitting_with_a_Piecewise_Linear_Function
Associated Data
This section collects any data citations, data availability statements, or supplementary materials included in this article.


