Abstract
The thalamus sub-cortical gray matter structure consists of contiguous nuclei, each individually responsible for communication between various cerebral cortex and midbrain regions. These nuclei are differentially affected in neurodegenerative diseases such as multiple sclerosis and Alzheimer’s. However thalamic parcellation of the nuclei, manual or automatic, is difficult given the limited contrast in any particular magnetic resonance (MR) modality. Several groups have had qualitative success differentiating nuclei based on spatial location and fiber orientation information in diffusion tensor imaging (DTI). In this paper, we extend these principles by combining these discriminating dimensions with structural MR and derived information, and by building random forest learners on the resultant multi-modal features. In training, we form a multi-dimensional feature per voxel, which we associate with a nucleus classification from a manual rater. Learners are trained to differentiate thalamus from background and thalamic nuclei from other nuclei. These learners inform the external forces of a multiple object level set model. Our cross-validated quantitative results on a set of twenty subjects show the efficacy and reproducibility of our results.
Keywords: Diffusion tensor imaging, machine learning, deformable models, object segmentation, random forests
1. INTRODUCTION
The thalamus is a symmetric sub-cortical gray matter structure located between the cerebral cortex and midbrain. It plays a central role in the processing and relay of signals involving both higher cognitive functions and the regulation of consciousness and sleep [1]. The thalamus is composed of neuronal clusters called nuclei, each individually responsible for communication between various cerebral cortex and midbrain regions [2]. Thalamic nuclear changes have been associated with multiple human functional disorders, including Parkinson’s disease, multiple sclerosis [3], and Alzheimer’s disease [4], with the affected nuclei a target of surgical treatment [5]. Given the potential clinical applicability, automatic parcellation of the thalamic nuclei has become a common goal in the literature.
While thalamic nuclei present minimal contrast in conventional MRI (with few notable exceptions [6, 7]), diffusion tensor imaging (DTI) shows more potential. DTI measures the directional diffusivity of water molecules at each voxel, and records this information in the tensor matrix. With their distinct tract connectivities and cytoarchitectures [2], the nuclei may be distinguishable via inhomogeneity in this tensor field image or its derivatives.
Several groups have had qualitative success differentiating nuclei based on spatial location and fiber orientation information in DTI. Behrens et al.[8] used probabilistic tractography and manually labelled each thalamus voxel according to the most probable cortical or midbrain connection and an established histological atlas of the nuclei [2]. Apart from connectivity, others have shown qualitative results based on optimizing regional tensor homogeneity using level sets [9], mean-shift clustering [10], and watershed segmentation on the image of local inhomogeneity in the tensor [11].
Other articles have shown quantitative results. Wiegell et al.[12] combined spatial and tensor information per voxel, using a Mahalanobis distance for location and a Frobenius norm on tensor differences in k-means clustering. Ziyan et al.[13] used normalized graph cuts to divide the thalamus into putative nuclei, also showing that the principal eigenvector (PEV) of the tensor was a strong distinguishing feature. In both works however, the putative nuclei are manually labelled or inherit from a manual parcellation the label of the nucleus they are compared against. Ye et al.[14] recently proposed the use of a multiple object level set method called MGDM [15]. The external forces driving the optimization were derived from the Knutsson edge map, which measures the speed of change in orientation of the PEV (see Sec. 2). While they compared their nuclear parcellations against those of a manual rater, their initialization depended on the rater’s thalamus boundary and they had only a small number of cases.
In this paper, we propose automatic thalamus parcellation using random forest learners [16] trained on manually delineated cases. We integrate the many potentially discriminating features used in prior work, including spatial coordinates, the Knutsson map, and other DTI-based and structural MRI information. In training, we form a multi-dimensional feature per voxel, which we associate with a nucleus label from a manual rater. We then use random forest classification to discriminate thalamus from background and thalamic nuclei from each other, using all the multi-contrast data at our disposal. The resulting learners, when applied to a target case, inform the external forces of the MGDM parcellation method used in [14]. We perform a quantitative study with bagged crossvalidation of twenty cases, showing a generalizable method that, unlike [14], does not require prior information about the target image. We follow with details of our method, results, and discussion of strengths, weaknesses and future directions.
2. METHODS
In this section we describe three key components of our automatic thalamus parcellation scheme: the Knutsson mapping of the principal eigenmode, which informs both our classification and the manual parcellations we train from and test against; our training of random forest classifiers on multimodal data; and target thalamus parcellation using MGDM.
2.1. Mapping the PEV into Knutsson Space
The principal eigenvector is the unit vector associated with the largest eigenvalue of the diffusion tensor. Since opposing vectors in Cartesian coordinates should represent the same orientation, there is a sign ambiguity in defining a difference measure between PEV’s [13]. Fan et al.[17] recently addressed this ambiguity using the Knutsson [18] map, defined as M : ℝ3 → ℝ5 for the unit vector [x, y, z]:
| (1) |
In the Knutsson space, two opposing Cartesian vectors are the same. The Knutsson edge map ∥G∥F is the Frobenius norm (read: vector magnitude) of the 5 × 3 local gradient matrix, computed using finite differences. High intensities in the edge map, where the transformed PEV changes quickly, are considered to be boundaries between nuclei or nuclear groups.
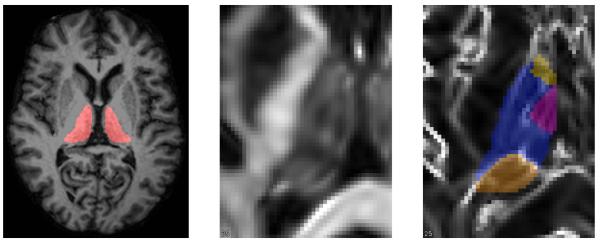
Manual raters first use the fractional anisotropy image (FA) to find the thalamus boundary, then use these Knutsson cues to delineate nuclear structures that we identify as the anterior, medialdorsal, and pulvinar nuclei [17]. A fourth structure we call the ventral group is the complement of these structures (see Fig. 1). The lateral and medial geniculate nuclei extend inferior from the pulvinar.
Fig. 1.

Left: axial brain slice with thalamus highlighted. Middle: closeup of left thalamus in fractional anisotropy (FA). Right: left thalamus nuclear delineation from the Knutsson edgemap image (Sec. 2.1): anterior nucleus [yellow], medialdorsal [red], ventral group [blue], and pulvinar [orange].
We use these reproducible manual delineations as a ground truth for our training and testing, and we use the 5D tuple of Eqn. 1 in addition to ∥G∥F as part of our random forest classification.
2.2. Random Forest Learning
Since its introduction by Breiman [16], random forest machine learning has become very popular due in part to its speed of convergence and generalizability, with a number of tools implementing variations [19]. The inputs to the random forest classifier are the set of observations and their associated class labels, where each observation consists of a multidimensional feature vector acquired at a single voxel, including the MRI, DTI, and derived spatial and orientation information. For the number of trees in the forest, a random selection of the observations is used to construct a decision tree, where the decision at each node of a tree—in this work—is based on minimizing the misclassification rate with respect to a subset of the features available. The output is a tree ensemble that, given a new observation, returns a putative class label for that observation and classification or membership scores for that and the other (less likely) class labels. There are of course numerous parameters that affect tree and forest construction (see [20] for a rich tutorial).
With co-registered modalities available, we sample 12 features at every voxel: the normalized MP-RAGE value, FA, mean diffusivity (MD), the spatial location (separately, x, y, and z), the five Knutsson dimensions M(PEV), and the Knutsson edge map ∥G∥F. Fig. 2 shows an example vector-valued image. At each voxel, the sampled feature vector is associated with the thalamic nuclear label for that voxel (or background) provided by the manual rater. After random forest learning on one subject, the resulting tree ensemble can then be applied to another subject, with the classification scores per voxel driving the MGDM parcellation.
Fig. 2.

An example vector-valued image, showing MP-RAGE, FA, MD, ∥G∥F, and the five Knutsson dimensions. Spatial location modalities not shown.
2.3. Nuclear Parcellation with MGDM
MGDM is a multiple object level-set segmentation framework that guarantees object relationships and prevents overlaps and gaps [15]. MGDM is thus applicable to thalamus parcellation, where nuclei are contiguous with one another without gaps (see Fig. 1). MGDM also enables the use of boundary-specific forces, where a particular force might apply only on the boundaries between designated objects (e.g., the boundary shared by the ventral nucleus and background). Within the level-set framework, this allows for regional appearance modeling, which has proven successful relative to global-scale appearance [21]. In this work, we are the first to take advantage of MGDM’s expressiveness in defining specific nucleus-nucleus and nucleus-background boundary forces.
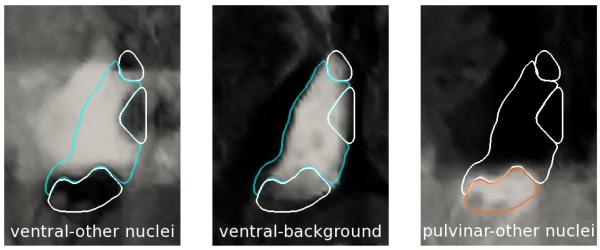
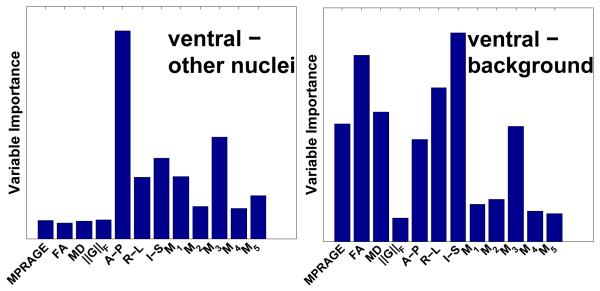
For each training subject, we generate seven random forest tree ensembles using subsets of the vector-valued image and manual delineation. First, the nucleus-nucleus tree ensemble is constructed using only the nucleus voxels (and therefore not background). In the target case, this ensemble produces a membership image for each nucleus, and these images inform the respective nucleus-nucleus boundaries (see Fig. 4). Then a separate tree ensemble is constructed for each of the six nucleus-background boundaries. The voxels sampled for such an ensemble include those identified with the particular nucleus and those background voxels nearest to that nucleus, leading to a two class ensemble. Fig. 3 shows the relative importance of the features in example ensembles.
Fig. 4.

Target nucleus-nucleus and nucleus-background membership images with manual contours overlaid. From left: ventral-other nuclei, ventral-background, pulvinar-other.
Fig. 3.
Variable importance for example nucleus-nucleus (left) and nucleus-background tree ensembles. Note the associated target membership images in Fig. 4.
In testing a particular subject, we apply the ensemble classifiers from the training cases to that subject’s data, combining the associated membership scores. Since we do not know the manual rater’s thalamus boundary, we do not mask the resulting score images, nor do we register these images as in [14]. Fig. 4 shows example resulting score images with the manual boundary overlaid, showing agreement at the relevant boundaries. The initialization of MGDM consists of a labelling of the image that is essentially the mode of the labels at each voxel coordinate across the training cases.
3. RESULTS
We processed 22 image sets from an ongoing ataxia study. The MP-RAGE and DTI images were obtained on a 3T MR scanner (Intera, Philips Medical Systems, Netherlands) and co-registered. The DTI were acquired using a multi-slice, single shot EPI sequence. Each sequence had one B0 image and used 30 gradient directions. The data were resampled to 0.828125 mm isotropic [14].
We trained nucleus-nucleus and nucleus-background ensemble classifiers for each subject as in Sec. 2.3. As shown in Fig. 3, the spatial and Knutsson dimensions are most discriminative among nuclei, as is expected from the literature. For example, note in Fig. 1 that the pulvinar, ventral/medialdorsal, and anterior are broadly separated along the anterior-posterior direction. However, also note how other modalities, such as the MP-RAGE and FA, are relatively more important in distinguishing nuclei from background.
It should be noted here that all images were cropped to within ten voxels of the manually delineated thalamus. While this amounts to limited prior information about the target in this study, there are atlas-based registration schemes that can provide this modest accuracy [22].
We then performed ten splits each with five training and the remaining test. In that each case was in training for between one and three of those splits, each of the images was parcellated seven to nine times. We computed the common Dice volume overlap coefficient over all nuclei and all splits, with the pooled statistics reported in Table 1.
Table 1.
Dice results for the six defined nuclei.
| Nucleus | Mean Dice | Median Dice |
|---|---|---|
|
| ||
| Anterior | 0.576 ± 0.146 | 0.593 |
| MedialDorsal | 0.641 ± 0.142 | 0.664 |
| Ventral Group | 0.833 ± 0.074 | 0.838 |
| Pulvinar | 0.711 ± 0.102 | 0.725 |
| Lateral Gen | 0.394 ± 0.202 | 0.405 |
| Medial Gen | 0.489 ± 0.244 | 0.515 |
Results on all the groups were much better than the inter-rater variability reported for a limited study in [17]. For example, while the automatic result on the anterior nucleus agrees with the manual parcellation at .576, manual raters’ agreement with themselves is reported at .324. Also note that while the results on the lateral and medial geniculates are poor, those nuclei are also exceedingly small, potentially only two or three voxels in the original DTI resolution, and thus difficult to resolve. In fact, the pulvinar and ventral group are often ~80% of the delineated thalamus volume in this study. Finally, we note that on these larger nuclei our results are comparable to those of [14], but without requiring extensive prior knowledge of the target’s thalamic boundary.
4. DISCUSSION
Our long-term goal is the large scale study of thalamic neuropathology using automated methods. In this paper we have extended thalamic parcellation in important ways that place us closer to that goal. We have used random forests classification to integrate multiple sources of potentially discriminating information (as reported in the literature) into an established thalamic parcellation scheme using MGDM. We have also limited prior knowledge of the target in computing our automatic results. Finally, this has allowed us to conduct a true validation experiment testing an automated method’s ability to reproduce a manual rater’s result. However, there are several concerns to address as we move forward.
We will first look to improve our accuracy and precision on the smaller structures, by training more specific (nucleus-everything) random forest learners and pooling results over a larger number of training cases. We will also integrate other discriminating contexual features in addition to spatial coordinate, like connectivity information at each voxel, as in [8].
Second, in addition to the Knutsson space of [17], there are several other tensor and PEV dissimilarity measures [13, 11]. We will compare these measures on synthetic and real data to determine if they imply related image structures.
Continuing in this line, we must understand how true to reality our nuclei are, whether manual or automatic. We use manual parcellations in training that we assume are correct, despite high inter-rater variability in the only study. We must further evaluate the reproducibility of these Knutsson-implied image structures and their underlying physiology, potentially through the use of 7T images or registered histological data.
Acknowledgments
Work performed at Johns Hopkins with support from Washington and Lee, NIH/NINDS 2R01NS056307-06A1.
REFERENCES
- [1].Herrero MT, et al. Functional anatomy of thalamus and basal ganglia. Childs Nerv. Sys. 2002;18(8):386–404. doi: 10.1007/s00381-002-0604-1. [DOI] [PubMed] [Google Scholar]
- [2].Morel A, et al. Multiarchitectonic and stereotactic atlas of the human thalamus. J. Comparative Neurology. 1997;387:588–630. doi: 10.1002/(sici)1096-9861(19971103)387:4<588::aid-cne8>3.0.co;2-z. [DOI] [PubMed] [Google Scholar]
- [3].Cifelli A, et al. Thalamic neurodegeneration in multiple sclerosis. Annals of Neurology. 2002;52(5):650–653. doi: 10.1002/ana.10326. [DOI] [PubMed] [Google Scholar]
- [4].Braak H, Braak E. Alzheimer’s disease affects limbic nuclei of the thalamus. Acta Neuropathologica. 1991;81:261–268. doi: 10.1007/BF00305867. [DOI] [PubMed] [Google Scholar]
- [5].Tornqvist AL. Neurosurgery for movement disorders. J. Neurosci. Nurs. 2001;33:79–82. doi: 10.1097/01376517-200104000-00003. [DOI] [PubMed] [Google Scholar]
- [6].Fujita N, et al. Lateral geniculate nucleus: Anatomic and functional identification by use of mr imaging. Am J Neuroradiol. 2001;22:1719–1726. [PMC free article] [PubMed] [Google Scholar]
- [7].Magnotta VA, et al. Visualization of subthalamic nuclei with cortex attenuated inversion recovery mr imaging. NeuroImage. 2000;11(4):341–346. doi: 10.1006/nimg.2000.0552. [DOI] [PubMed] [Google Scholar]
- [8].Behrens EJ, et al. Non-invasive mapping of connections between human thalamus and cortex using diffusion imaging. Nature Neuroscience. 2003;6(7):750–757. doi: 10.1038/nn1075. [DOI] [PubMed] [Google Scholar]
- [9].Jonasson L, et al. A level set method for segmentation of the thalamus and its nuclei in dt-mri. Signal Processing. 2007;87:309–321. [Google Scholar]
- [10].Duan Y, et al. Thalamus segmentation from diffusion tensor magnetic resonance imaging. International Journal of Biomedical Imaging. 2007;5:1–5. doi: 10.1155/2007/90216. [DOI] [PMC free article] [PubMed] [Google Scholar]
- [11].Rittner L, et al. Segmentation of thalamic nuclei based on tensorial morphological gradient of diffusion tensor fields. IEEE Int. Symp. Biomed. Imag. (ISBI) 2010:1173–1176. [Google Scholar]
- [12].Wiegell MR, et al. Automatic segmentation of thalamic nuclei from diffusion tensor magnetic resonance imaging. NeuroImage. 2003;19:391–401. doi: 10.1016/s1053-8119(03)00044-2. [DOI] [PubMed] [Google Scholar]
- [13].Ziyan U, et al. Segmentation of thalamic nuclei from dti using spectral clustering. Med. Im. Comp. and Computer-Assisted Intervention (MICCAI) 2006;4191:807–814. doi: 10.1007/11866763_99. [DOI] [PubMed] [Google Scholar]
- [14].Ye C, et al. Parcellation of the thalamus using diffusion tensor images and a multi-object geometric deformable model. SPIE Medical Imaging. 2013 doi: 10.1117/12.2006119. [DOI] [PMC free article] [PubMed] [Google Scholar]
- [15].Bogovic JA, et al. A multiple object geometric deformable model for image segmentation,” Computer Vision and Image Understanding. 2012 doi: 10.1016/j.cviu.2012.10.006. vol. ISSN 1077-3142, 10.1016/j.cviu.2012.10.006. [DOI] [PMC free article] [PubMed] [Google Scholar]
- [16].Breiman L. Random forests. Machine Learning. 2001;45:5–32. [Google Scholar]
- [17].Fan X, et al. A novel contrast for dti visualization for thalamus delineation. SPIE Medical Imaging. 2010;7625 doi: 10.1117/12.844473. [DOI] [PMC free article] [PubMed] [Google Scholar]
- [18].Knutsson H. Producing a continuous and distance preserving 5-d vector representation of 3-d orientation. IEEE CAPAIDM. 1985 [Google Scholar]
- [19].MATLAB . version 7.14.0 (R2012a) The MathWorks Inc.; Natick, Massachusetts: 2012. [Google Scholar]
- [20].Criminisi A, et al. Decision forests: A unified framework for classification, regression, density estimation, manifold learning and semi-supervised learning. Found. Trends in Comp. Graph. Vis. 2011;7(2-3):81–227. [Google Scholar]
- [21].Stough JV, et al. Regional appearance in deformable model segmentation. IPMI. 2007;4584:532–543. doi: 10.1007/978-3-540-73273-0_44. LNCS. [DOI] [PubMed] [Google Scholar]
- [22].Bazin PL, Pham DL. Homeomorphic brain image segmentation with topological and statistical atlases. Med. Image Anal. 2008;12(5):616–625. doi: 10.1016/j.media.2008.06.008. [DOI] [PMC free article] [PubMed] [Google Scholar]


