Abstract
The objective of this study is to assess the sensitivity of intracranial aneurysm geometry to the modality of imaging. Four imaging modalities—3D rotational angiography (3DRA), computed tomography angiography (CTA), contrast enhanced magnetic resonance angiography (CE-MRA), and time-of-flight magnetic resonance angiography (TOF-MRA)—were assessed using data from a flow phantom and human subjects. A silicone flow phantom of the head and neck arteries with a 10 mm ACOM aneurysm was imaged using all four modalities under steady flow conditions. Three human subjects with mid to large sized intracranial aneurysm who had a 3DRA scan and one of CTA, CE-MRA, or TOF-MRA performed within a day were also studied. The aneurysm and contiguous vasculature were segmented for all available scans and geometric measures of their size (5 indices) and shape (6 indices) were estimated and compared. Visually, the size and shape of segmented 3D models of the aneurysms were similar across scan modalities for both the human subjects and the flow phantom. Consequently, the computed indices were consistent across modalities in the key morphometric indices. In conclusion, quantified indices of 3D geometry of the mid to large sized intracranial aneurysms investigated in this small study population are not sensitive to scanning modality.
Keywords: Cerebral vasculature phantom, 3D reconstruction, Multimodality imaging, Aneurysm size and shape indices
INTRODUCTION
In the diagnosis and clinical management of cerebral aneurysms, patients are routinely subjected to volumetric scans, but these can be one of four three-dimensional (3D) modalities—3D rotational angiography (3DRA), computed tomography angiography (CTA), contrast enhanced magnetic resonance angiography (CE-MRA), and time-of-flight MRA (TOF-MRA). The choice of the imaging modality, for a particular situation, is dictated by various considerations such as invasiveness, spatial, and temporal resolution, radiation exposure, contrast medium, need for depicting surrounding tissue or blood flow, and capability for retrospective manipulation.12 These differing merits and demerits of modalities are often leveraged for a given clinical case. However, it is worthwhile to wonder if the morphology of the aneurysm—its size and shape—is specifically sensitive to the modality. Addressing this issue can have important implications at the clinic and in the research lab. It is not uncommon for patients who are followed with unruptured intracranial aneurysms to be imaged by one modality in one year and a different modality in a subsequent year. If changes are noted in aneurysm morphology (say, a new lobulation), can image modality be confidently eliminated as a factor? Sensitivity to modality may also have important implications for many ongoing longitudinal research studies on whether computational modeling may be effective in predicting rupture or growth risk. For these studies to have a large enough patient population, data from multiple modalities may need to be lumped together. Here too, the issue of whether aneurysm morphology measurements are sensitive to imaging modality becomes critical.
Rigorous studies on whether or to what extent the aneurysm’s shape and size will be different between the four imaging modalities is lacking in the literature. To our knowledge, there is no study, in existing literature that compares even aneurysm size in human subjects scanned using all the four imaging modalities. The studies that do exist on this topic are confined to the sensitivity of basic manual measurements of aneurysm sizes—often in comparison to 2D—digital subtraction angiography (DSA).3,4,6,7,9,12-14,17,19 In a study of elastase-induced aneurysm models in rabbits, Doerfler et al.7 reported that CTA, TOF-MRA, and CE-MRA were well correlated with DSA for measuring aneurysm size—height, width, and neck. Fahrig et al.8 constructed rigid-walled phantom models of the circle of Willis with a spherical basilar aneurysm in a simulated flow loop and imaged the phantom using TOF-MRA, DSA, and CTA. They measured vessel diameter on CTA and TOF-MRA images and found that the measurements were within 4% error compared to prescribed vessel diameters. They did not report measurements on the aneurysm. Piotin et al.,15 compared volume measurements of a rigid-walled phantom of an anterior communicating (ACOM) artery aneurysm in a pulsatile flow loop, imaged using CTA, TOF-MRA, and 3DRA. They found that both CTA and 3DRA were more accurate than TOF-MRA (with statistical significance) and 3DRA was more accurate than CTA (without statistical significance). Data from human subjects were however not assessed. Kouskouras et al.13 compared aneurysm size (maximum diameter and neck diameter) measure from TOF-MRA, CTA, and DSA to those measurements made surgically with the focus on evaluating CTA in the pre-surgical planning of cerebral aneurysm. They also noted shape characteristics (irregularities and lobulations) but these shape characteristics were not clearly defined in the study. In summary, these studies are confined to basic aneurysm size measurements made on a phantom,15 an animal model7 and only one study on human subjects.13 Moreover, these studies do not address all the four imaging modalities. All of these three studies make measurements on planar slices rather than accommodating the 3D nature of imaging.
With recent advances in the use of computational tools for assessing 3D aneurysm size and shape, it is imperative that the sensitivity of the 3D morphology of the aneurysm to image modality be assessed with rigor. The objective of our study is to assess whether and by how much size and shape measurements of 3D models of intracranial aneurysms differ among image modalities. We use two independent approaches: (1) using a flow phantom of the cerebral vasculature with an ACOM aneurysm that is scanned by all three modalities; and (2) patients who have all been scanned by one common modality and at least one another as well. 3D segmentation was performed on all datasets and their morphometric indices were compared to assess sensitivity to image modality.
METHODS
Imaging of Aneurysm Flow Phantom Using Multiple Scan Modalities
A silicone flow phantom consisting of the complete circle of Willis with a saccular aneurysm at the ACOM was used (Shelley Medical Imaging Technologies, Canada). The model is anatomically realistic and was built by the lost wax technique, using cadaver molds (Fig. 1). The phantom has four inlets—two common carotids and two vertebral arteries. The two common carotids then split into external and internal carotids. The six outlets of the phantom are two branches from the middle cerebral arteries (MCAs), both on the left side and right side—M1, M2, and two anterior cerebral arteries (ACAs). The phantom contains a saccular aneurysm at the anterior communicating artery with about 3.5 mm neck diameter and height of 13 mm (as specified by manufacturer). Dimensions for all other arteries are shown in Fig. 2. In order to simulate blood flow through the phantom, a flow loop was set up (Fig. 3). In the flow loop, the inlet/outlet tank was filled with 6 L of 0.9% saline. Saline from the tank was passed through the pump to the four inlets of the phantom. In the flow loop, the external carotids were occluded to confine the flow domain to the relevant vessels and therefore the flow rate at the common carotid inlets was made equal to that of the internal carotids. A peristaltic pump maintained steady flow at the inlet of 800 cc/min. The flow rates at the inlets were controlled using pinch valve flow resistors to ensure that they are roughly physiological: 275 cc/min at the left and right ICAs, 100 and 80 cc/min at the left and right vertebral arteries.8,10 Scans were performed on the phantom by four imaging modalities at the University of Iowa Hospital and Clinics following to the extent possible, scanning protocols used for aneurysm patients. Time delays for scanning were based on the discretion of radiology personnel, as would be the case during patient scans. Table 1 shows the parameters used for the four modalities. Contrast was added to the reservoir tank for all of the four modalities. While adding contrast uniformly in the reservoir tank helps maintain consistency in flow-dynamics across imaging techniques, it could cause an unrealistic environment in the 3DRA where it might be more appropriate for the contrast to be injected into the ICA.
FIGURE 1.
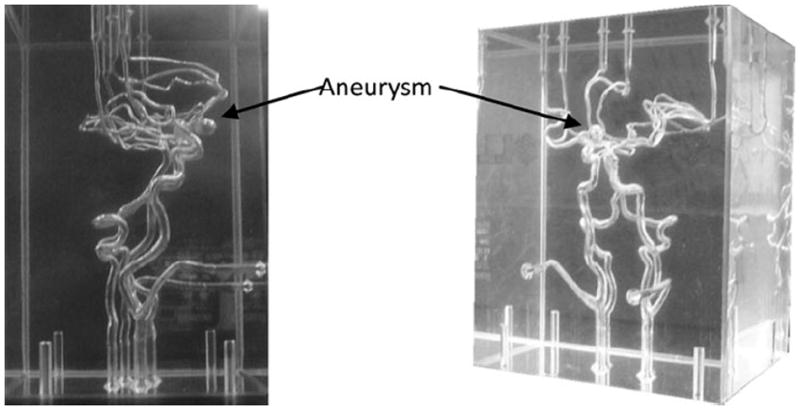
Phantom of circle of Willis with an ACOM aneurysm.
FIGURE 2.
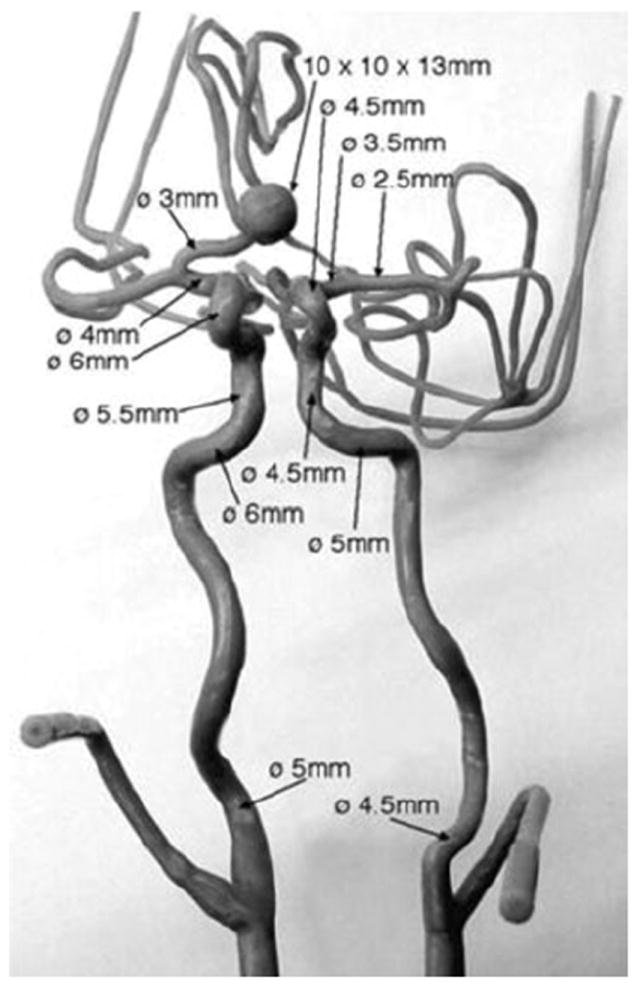
Frontal view of the mold used for making in vitro phantom, along with dimensions of arteries and the aneurysm (provided by vendor).
FIGURE 3.
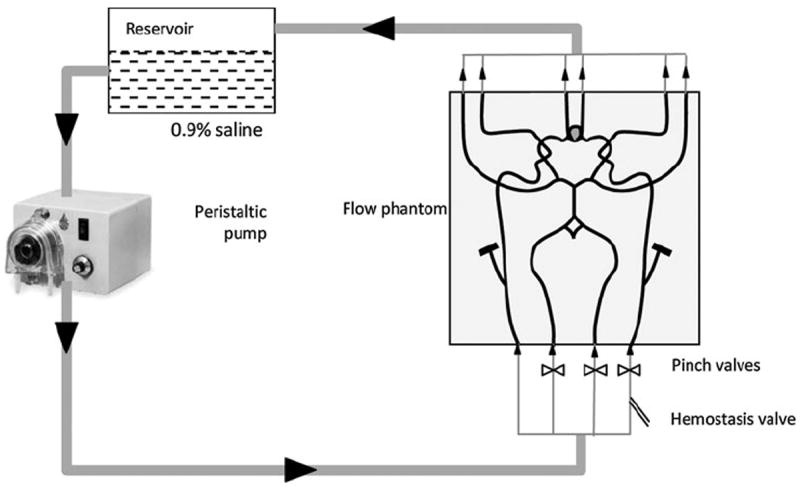
Schematic diagram of flow loop consisting of phantom, pump, inlet/outlet tank, valve.
TABLE 1.
Parameters for scanning flow phantom in four modalities.
| Modality | Scanner type | Voxel size | Contrast medium added to inlet/outlet tank | Miscellaneous parameters |
|---|---|---|---|---|
| CE-MRA | Siemens 1.5T Avanto MRI | 0.625 × 0.625 × 1 | 20 mL Gadolinium | Repetition time 3.17 s, flip angle 30°, echo time 1.12 s |
| TOF-MRA | Siemens 1.5T Avanto MRI | 0.429 × 0.429 × 0.8 | N/A | A repetition time 39 s, flip angle 25°, echo time 7.2 s |
| CTA | Siemens Sensation 64 | 0.309 × 0.309 × 1 | 150 mL Iohexol | N/A |
| 3DRA | Siemens Axiom Artis | 0.468 × 0.468 × 0.499 | 34.5 mL Iopamidol | N/A |
Collection of Multiple Modality Scans from Aneurysm Patients
Scans from three patients with aneurysms at the AComm, MCA, and Basilar arteries at the University of Iowa Hospitals were retrieved. Institutional IRB approval was obtained for this study (IRB# 200912759). Each of these patients was scanned using 3DRA and one of the following modalities: CTA, CE-MRA, and TOF-MRA. Therefore, 3DRA—the common modality among all three subjects—was compared to: CE-MRA in patient 1 (interval between scans: 1 day), TOF-MRA in patient 2 (0 days) and CTA in patient 3 (0 days). Specifications of the scans are listed in Table 2. It is important to note that patient scans in multiple modalities, say CTA and CE-MRA, are rarely performed within a short interval (less than a month) and therefore is quite difficult to obtain for comparative research. Of the several research studies discussed in the introduction, all but one of them used only phantom data and no patient data. This attests to the difficulty in obtaining data from multiple modalities for study.
TABLE 2.
Parameters used for patient scans of four modalities.
| Modality | Voxel size | Miscellaneous parameters |
|---|---|---|
| CE-MRA | 0.625 × 0.625 × 0.8 | Repetition time 3.17 s, flip angle 30°, echo time 1.12 s |
| TOF-MRA | 0.429 × 0.429 × 1 | A repetition time 39 s, flip angle 25°, echo time 7.2 s |
| CTA | 0.390 × 0.390 × 1 | N/A |
| 3DRA | 0.218 × 0.218 × 0.218 | N/A |
3DRA is typically used in interventional radiology during minimally invasive surgery for better visualization of vascular structures than using 2D Angiography. Hence our study was able to recruit patients that had 3DRA performed during surgery and an additional scan performed in another modality for diagnostic purposes. The criteria for recruitment was not to have 3DRA be the common modality but that we have any one of the four modalities common amongst all patients.
3D Segmentation
Three dimensional models were created from the source data using levelset segmentation techniques as implemented in the Vascular Modeling ToolKit (VMTK).2 An appropriate threshold window is specified and levelset initialization methods, referred to as colliding fronts and fast marching, were used to segment the parent vasculature and the aneurysm respectively.11 The deformable models were evolved by applying evolution parameters within a set range—number of iterations (200–300), propagation scaling (0–1), curvature scaling (0–1), and advection scaling (1). Detailed reviews of these methods have been published by its authors earlier.1,2,11 Deformable models (defined by the levelset initialization algorithms) propagate from the source to target seed points within the provided threshold window. These generated 3D structures are further refined using the evolution parameters specified above. These parameters are chosen repeatedly until “good” conformance between the 3D structures and the source images are observed. Conformance between the two is a qualitative assessment since intensity gradients between the vascular structure and the surrounding cerebral tissue is not a consistent number for all of the modalities. By appropriately defining these parameters, the 3D segmented geometry is not noisy even in cases where the source images depict poor intensity gradients due to low flow (such as in TOF-MRA or 3DRA). Figure 4 shows source images of the aneurysm from the phantom and human subjects for all modalities obtained. Segmentations were all performed by one user. The user was blinded from previously made segmentation choices (seed points, threshold, and evolution parameters) for that corresponding geometry in any other imaging modality. Since there are multiple choices to be made and there are several 2D slices comprising a 3D volume in each modality, it was deemed not possible to remember those choices for them to cause bias in the subsequent segmentations of that geometry. The 3D segmentations of the phantom model obtained from each of the four scanning modalities are shown in Fig. 5. The segmented images were then smoothed using Taubin’s non shrinking algorithm implemented in VMTK.18 In order to better document the sensitivity of the segmentation to the smoothing parameters, the two smoothing parameters—number of iterations and passband were perturbed with values of 40, 60, 80, 100 and 0.1, 0.01 respectively and resulting segmentations recorded for each smoothing parameter value.1 Thus, for each modality, eight models with eight different iteration-passband combinations were created for each of five scans for a total of 40 segmentations of the phantom ACOM aneurysm model.
FIGURE 4.
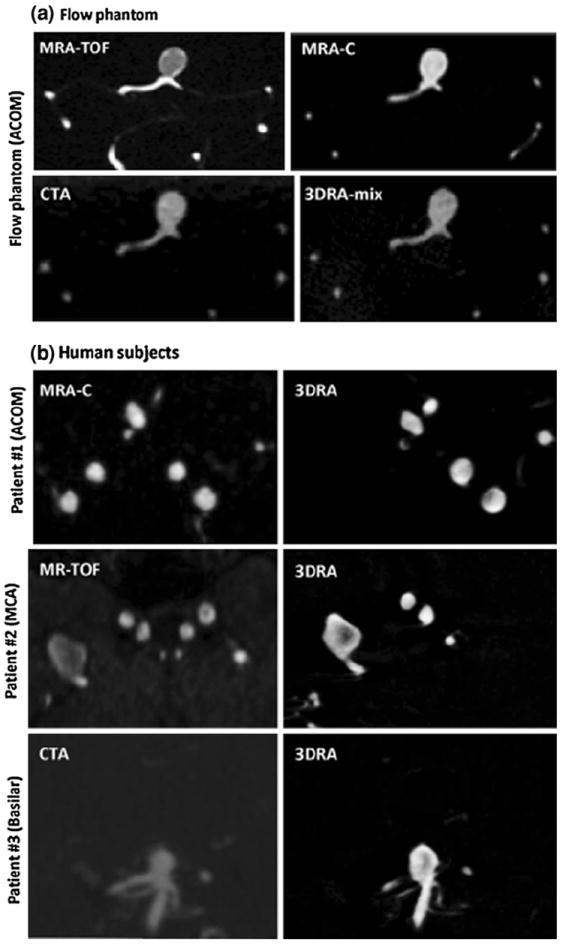
(a) Source images of the phantom aneurysm in all four modalities in approximately the same view. (b) Source images of the patient aneurysms in 3DRA and the additional modality in approximately the same view.
FIGURE 5.
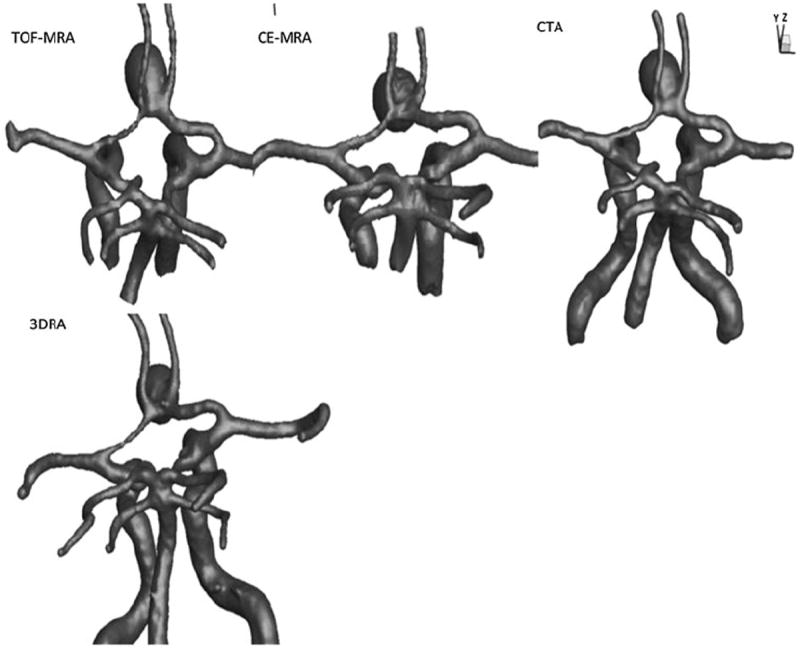
3D segmentation of the vasculature from all four modalities. The views and scales are roughly similar between models shown.
Morphometrics
The aneurysm sac was isolated from the contiguous vasculature using a visually determined cutting plane as previously reported.7 The cutting plane was chosen, so that, it would reflect the plane where a surgeon would, perhaps, place a surgical clip while treating the aneurysm by a craniotomy procedure. In spite of the above criteria, the cutting plane remains dependent upon the user’s discretion to some extent. Once the aneurysm dome was isolated from the parent vessels, five size and six shape indices were calculated for each 3D model using methods reported earlier7,16:
Size indices: Height (H), maximum diameter (Dmax), neck diameter (Dn), volume (V), and surface area (SA).
- Shape indices:
- Aspect ratio (AR): ratio of neck diameter to height.
- Bottleneck factor (BF): Ratio of neck diameter to max diameter.
- Bulge location (BL): Distance from neck plane to largest cross-section as a fraction of total height.
- Undulation index (UI): Measure of lobulations in the aneurysm surface.
- Ellipticity index (EI): Measure of ellipticity of aneurysm.
- Non-sphericity index (NSI): Aggregate measure of deviation from spherical shape due to ellipticity and undulation.
RESULTS
3D segmentations of aneurysms and their contiguous vasculature for the phantom-aneurysm are shown in Fig. 6 and those for the patient-aneurysms are shown in Fig. 7. Upon performing geometric analysis, all indices were calculated and tabulated. Table 3 lists the geometric indices of the phantom-aneurysm with their mean and standard deviation due to different levels of smoothing for each scan modality. The standard deviation for the indices were less than 3% of the mean indicating that the indices are not sensitive to smoothing levels, within the range tested. Owing to the (subjective) choice of neck plane, neck diameter and indices associated with it such as aspect ratio, and bottleneck factor, showed greater sensitivity, but still low. The seemingly elevated sensitivity of undulation index is of little consequence because the values were near zero due to the lack of any undulations on the phantom-aneurysm. In general, the values of indices are consistent across 3DRA, CTA, CE-MRA, and TOF-MRA models. Dimensions of the phantom-aneurysm as given by the vendor (Shelley Medical Imaging Technologies, Ontario, Canada) are a height of 13 mm and a diameter of 10 mm. Assuming the numbers are accurate, comparison between “actual” values and estimated values of both height and diameter is shown in Table 4. Geometric indices obtained for the patient data are shown in Table 5. Comparison of shape and size indices between 3DRA and CE-MRA/TOF-MRA/CTA for patient-aneurysms is shown in Figs. 8 and 9. To quantitatively assess similarity between modalities for each index of the phantom-aneurysm, a similarity metric was defined as the ratio of standard deviation of the means to the mean of the means for each modality. An index was judged to be similar between modalities when its similarity metric is less than 5%. Seven of the indices were similar: H (2%), Dmax (1%), V (2%), SA (1%), BL (4%), NSI (5%), and EI (5%). However, the Dn (10%), AR (10%), and BF (10%) are not similar between modalities.
FIGURE 6.
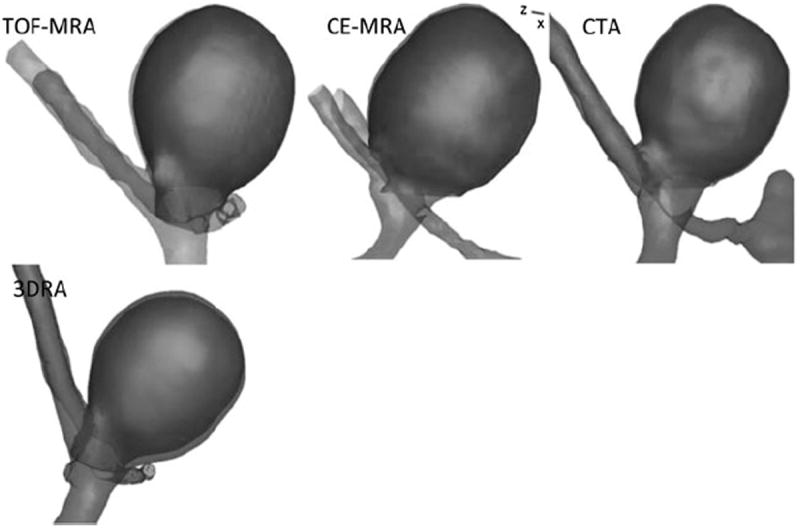
3D segmentations of the aneurysm and parent vessel. Also shown is the aneurysm dome isolated from its parent vasculature (highlighted as a darker shade). The views and scales are roughly similar between models shown.
FIGURE 7.
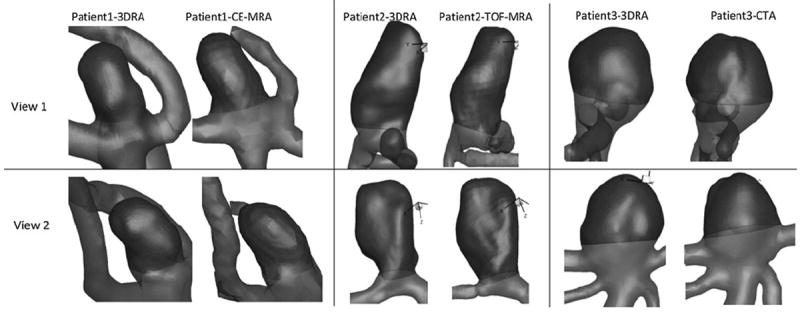
Two corresponding views of 3D models from patient 1, patient 2, and patient 3. Aneurysm sac is shown as a darker shade. The views and scales are roughly similar between models shown.
TABLE 3.
Average and standard deviation of six size indices and five shape indices calculated for the four listed modalities across eight levels of smoothing.
| Indices | CE-MRA | TOF-MRA | CTA | 3DRA |
|---|---|---|---|---|
| Height (mm) | 12.4 ± 0.2 | 12.9 ± 0.1 | 12.5 ± 0.2 | 12.5 ± 0.6 |
| Max. diameter (mm) | 10.5 ± 0.01 | 10.3 ± 0.1 | 10.4 ± 0.01 | 10.4 ± 0.01 |
| Neck diameter (mm) | 4.3 ± 0.2 | 5.0 ± 0.1 | 5.0 ± 0.1 | 5.5 ± 0.6 |
| Aspect ratio | 2.9 ± 0.2 | 2.6 ± 0.1 | 2.5 ± 0.1 | 2.3 ± 0.3 |
| Volume (mm3) | 731.9 ± 4.3 | 733.8 ± 4.0 | 728.2 ± 2.6 | 753.6 ± 15.7 |
| Surface area (mm2) | 390.6 ± 4.8 | 390.8 ± 3.5 | 386.4 ± 2.7 | 388.3 ± 12.3 |
| Bottleneck factor | 2.42 ± 0.13 | 2.06 ± 0.07 | 2.10 ± 0.08 | 1.92 ± 0.21 |
| Bulge location | 0.50 ± 0.01 | 0.55 ± 0.009 | 0.54 ± 0.008 | 0.54 ± 0.01 |
| Undulation index | 0.023 ± 0.01 | 0.021 ± 0.01 | 0.019 ± 0.00 | 0.015 ± 0.01 |
| Non sphericity index | 0.202 ± 0.01 | 0.200 ± 0.00 | 0.195 ± 0.00 | 0.181 ± 0.02 |
| Ellipticity index | 0.197 ± 0.005 | 0.195 ± 0.001 | 0.190 ± 0.003 | 0.177 ± 0.01 |
TABLE 4.
Percent error between height and diameter provide by vendor to height and diameter measured on models from the four modalities.
| Index | CE-MRA (%) | TOF-MRA (%) | CTA (%) | 3DRA (%) |
|---|---|---|---|---|
| Height | 4.6 | 0.8 | 3.8 | 3.8 |
| Max. diameter | 5.0 | 3.0 | 4.0 | 4.0 |
TABLE 5.
Shape indices calculated for each of the three patients.
| Indices | Patient #
|
|||||
|---|---|---|---|---|---|---|
| Patient 1
|
Patient 2
|
Patient 3
|
||||
| 3DRA | CE-MRA | 3DRA | TOF-MRA | 3DRA | CTA | |
| Height (mm) | 5.5 | 5.8 | 13.6 | 14.6 | 5.9 | 5.8 |
| Max. diameter (mm) | 4.1 | 4.2 | 9.0 | 8.4 | 7.1 | 7.5 |
| Neck diameter (mm) | 4.1 | 4.1 | 5.8 | 6.1 | 6.6 | 7.3 |
| Aspect ratio | 1.3 | 1.4 | 2.3 | 2.4 | 0.9 | 0.8 |
| Volume (mm3) | 62.9 | 69.9 | 628.0 | 635.2 | 179.7 | 184.0 |
| Surface area (mm2) | 72.6 | 79.2 | 368.7 | 378.4 | 131.9 | 131.5 |
| Bottleneck factor | 1.00 | 1.03 | 1.54 | 1.37 | 1.08 | 1.02 |
| Bulge location | 0 | 0.26 | 0.41 | 0.43 | 0.26 | 0.13 |
| Undulation index | 0.066 | 0.088 | 0.054 | 0.074 | 0.009 | 0.018 |
| Non sphericity index | 0.164 | 0.177 | 0.237 | 0.250 | 0.073 | 0.056 |
| Ellipticity index | 0.145 | 0.153 | 0.219 | 0.225 | 0.070 | 0.052 |
FIGURE 8.
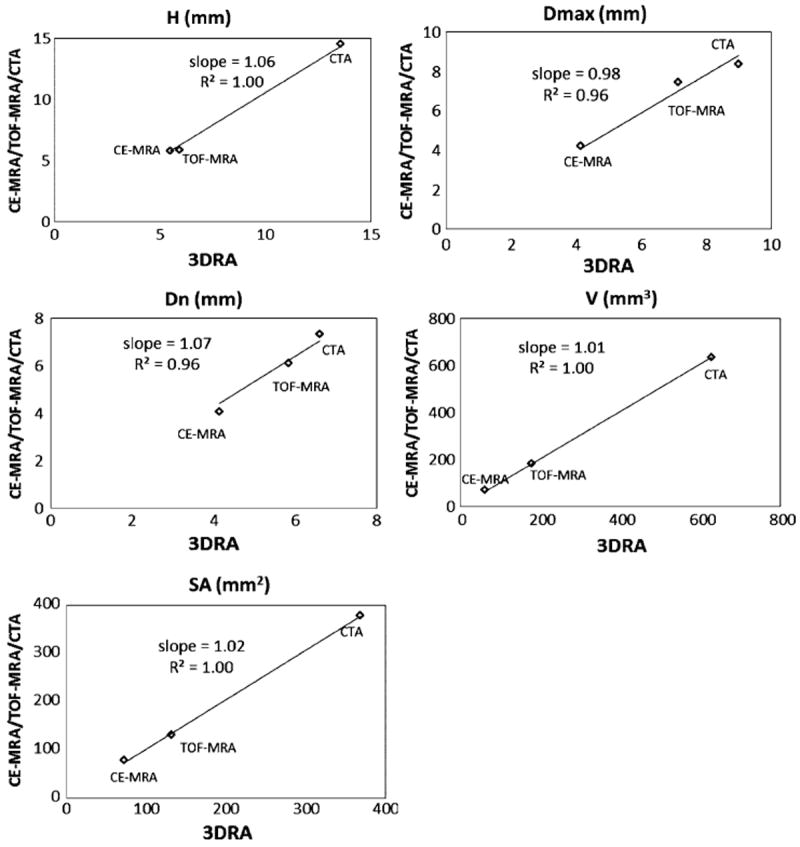
Graphical representation of size indices measured on patient-aneurysms with 3DRA on the x-axis and CE-MRA/TOF-MRA/CTA on the y-axis.
FIGURE 9.
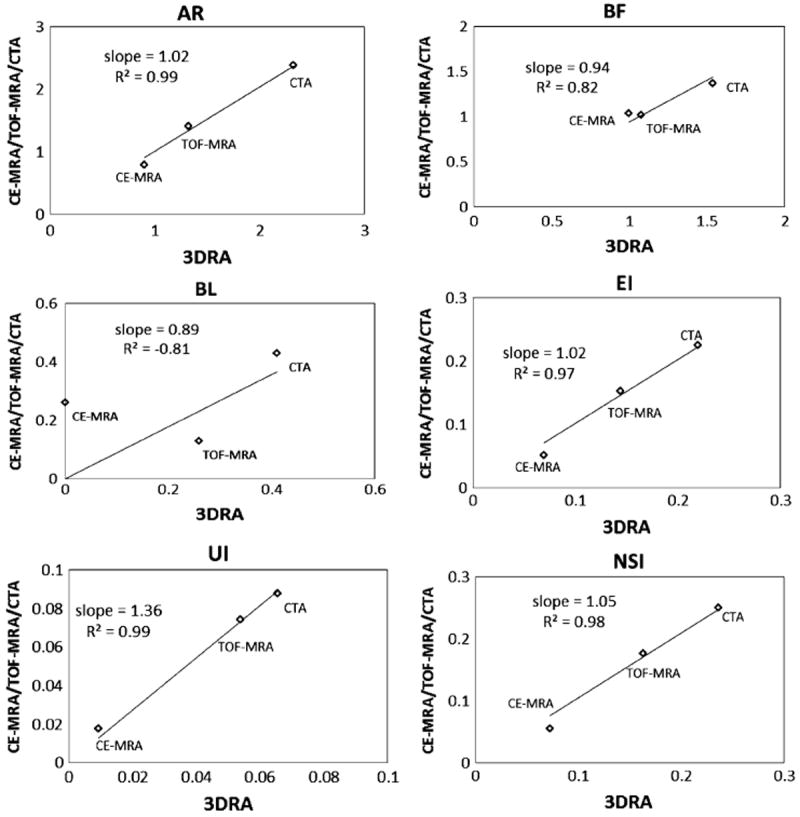
Graphical representation of shape indices measured on patient-aneurysms with 3DRA on the x-axis and CE-MRA/TOF-MRA/CTA on the y-axis.
DISCUSSION
The choice of imaging modality in the clinical management of unruptured intracranial aneurysms is often driven by many clinical factors. It is inevitable then that multi-site studies on aneurysms that are essential for recruiting large study populations will accumulate data from different imaging modalities. Assessing the appropriateness of lumping quantified geometric measures computed from such multimodality data for statistical analysis is important. Simply put, would an aneurysm’s quantified geometric characteristics differ simply because the modality is different? The current study assessed whether and to what extent 3D measures of aneurysm size and shape is sensitive to scan modality. All scan modalities were obtained for a single ACOM aneurysm flow phantom and compared. Although the flow phantom used was morphologically realistic and provides some definitiveness in comparisons, one could argue that it does not present with the true complexity and variations of image data from human subjects. The quality of phantom images may be a best case scenario with the absence of skull and other tissue structures. Our studies with the phantom are still valuable because it permitted our evaluation of all four modalities in a single aneurysm and the geometry being imaged is known a priori. The phantom-aneurysm comparisons were augmented by the study with human subjects. Ideally, such a study would involve a population of patients, each of whom have been scanned by all four modalities within a short period of time (days or weeks, not months or years) so that paired comparisons of geometric indices maybe conducted. But in practice, such data is scarce. Therefore, scans from three human subjects who all had 3DRA scans and one each of the other modalities were assessed.
Visual inspection of the phantom-3D models in Fig. 6 and the patient-3D models in Fig. 7, in general, suggest agreement between 3DRA, CE-MRA, TOF-MRA, and CTA. Minor disagreements in shape can be perceived in some cases (For example, in patients #1 and #3, there is perceptible difference in the shape of the neck) which could be caused due to scanning artifacts or due to segmentation choices made. While viewing these differences, the reader should bear in mind the size of the geometry (~5 mm) and the subsequent size scale for these disagreements. Comparison of the quantitative assessment of geometric features using the indices helps in better assessing the effects of these qualitative differences. Quantitatively assessment of similarity between modalities, for each index of the phantom-aneurysm, was performed using the similarity metric defined in the results section. Based on this metric, 3 out of the 10 indices (Dn, AR, and BF) are not similar between modalities. The common feature among these latter indices is that they are all related to the choice of neck plane. Neck diameter is affected by choice of neck plane with small differences in the location and orientation of the neck plane likely causing large variations in measured indices. Aspect ratio and bottleneck factor are calculated from the neck diameter and hence affected by it. The undulation index had a similarity ratio of 18%, but that is inconsequential since the seeming dissimilarity may be attributed to the fact that it is extremely small (0.01–0.02; the phantom aneurysm had little to no perceptible undulation) and so tiny fluctuations result in large percent errors. In patient-aneurysms, the similarity metric defined above cannot be used since only any two modalities were available in each subject. Fortunately however, the three subjects had aneurysms of varying sizes, permitting a combined assessment of each index for all three subjects as done in Figs. 8 and 9. A straight line relationship for an index on these graphs would suggest that the three aneurysms would be stratified in exactly the same manner by both indices and a slope of close to 1 indicates that the absolute values of the index is the same for both modalities. In human subjects too, the indices associated with the neck plane, namely, neck diameter (Dn), bottleneck factor (BF), and bulge location (BL) performed worse than the other indices. The worst among these, BL is the normalized height at which the maximum diameter of the aneurysm occurs (i.e., BL = 0 if the largest crosssection is at the neck, and BL = 1 if at the dome). This index, too, is highly sensitive to how the neck plane is chosen in aneurysms that do not have a clear plane of maximum dimension (cylindrical shapes). If the neck plane has a flare due to the inclusion of the vessel geometry, it may become the largest cross section for such aneurysm shapes resulting in BL = 0. But with slight differences in angle of the neck plane, the heightaxis of the aneurysm varies significantly and this causes BL to vary significantly as well.
The subjectivity and lack of consistency in isolating the aneurysm from its parent vasculature is a clear limitation of the segmentation approach, but not related to or resulting in sensitivity to imaging modality. A single investigator performed all the analyses to minimize subjectivity. In this context, a nifty technique for automated aneurysm isolation proposed by Ford et al.11 is noteworthy. A second limitation of this study is with regard to how 3DRA was assessed in the phantom. The contrast was directly mixed with the fluid in the reservoir for all phantom-aneurysm scans. This reasonably reflects the situation for CTA andMRA scans, but may not for 3DRA scans where it would have been better to inject the contrast at the ICA. The reason for mixing the contrast was to accommodate contrast flow-related issues with the scanning. On the one hand, ACOM aneurysms are particularly vulnerable to poor contrast flow from unilateral injection.5,13 On the other hand, the experiments involved steady flow of fluid in the flow phantom as opposed to the more realistic pulsatile flow because the latter is technically challenging to accomplish within the constraints of the clinical setting. But steady flow may further aggravate poor mixing of the contrast with the flow medium resulting in a scan that is not reflective of clinical 3DRA scanning. Indeed, another set of 3DRA scan was performed on the phantom with 34.5 mL of Iopamidol injected in the right ICA through a homeostasis valve in the flow loop as would be done in patients, except under steady flow conditions. The 3DRA scans were performed on a Siemens Axiom Artis and the subtraction angiographic images were obtained with a voxel size of 0.187 × 0.187 × 0.187 mm3 with matrix 512 × 512. It was noted that this 3DRA model presented with more surface undulations and the source images had poor and unrealistic intensity gradients. These were absent when 3DRA was performed with contrast mixed in the reservoir. Bash et al.4 observed that DSA performed poorly under low flow conditions, perhaps, the same phenomenon is observed here with low flow regions caused by an 11 mm AComm aneurysm and the poor mixing of contrast to flow medium under steady flow conditions. 3DRA scans of large patient-aneurysms need to be investigated independently. And finally, it is important to recognize that the study did not include very small aneurysms (the smallest aneurysm dimension in this population was 4 mm). This study’s findings cannot be extrapolated to aneurysms of 1 and 2 mm dimensions because differences in spatial resolutions between modalities will start to alter signal to noise ratios in measurable ways.
CONCLUSION
The volumetric imaging modalities commonly used for intracranial aneurysm scanning—CTA, CE-MRA, TOF-MRA, and 3DRA—show no evidence of inconsistencies in quantified morphology for mid- to large-sized aneurysms in this small study population. Subjectivity in the choice of the neck (aneurysm-isolation) plane does contribute to variations in some of the size and shape indices, but this is not attributable to sensitivity to modality per se. A similar study with a larger study population is needed for being definitive about the insensitivity of scan modality to morphometric analysis of brain aneurysms.
Acknowledgments
The authors are grateful to Ryan Allen, radiology technician for assistance with the study. The study was supported by funding from the NIH/NHLBI grant # 3R01HL083475-02S1.
References
- 1.Antiga L, Ene-Iordache B, Caverni L, Cornalba GP, Remuzzi A. Geometric reconstruction for computational mesh generation of arterial bifurcations from CT angiography. Comput Med Imaging Graph. 2002;26:227–235. doi: 10.1016/s0895-6111(02)00020-4. [DOI] [PubMed] [Google Scholar]
- 2.Antiga L, Ene-Iordache B, Remuzzi A. Computational geometry for patient-specific reconstruction and meshing of blood vessels from MR and CT angiography. IEEE Trans Med Imaging. 2003;22:674–684. doi: 10.1109/TMI.2003.812261. [DOI] [PubMed] [Google Scholar]
- 3.Anzalone N, Scomazzoni F, Cirillo M, Righi C, Simionato F, Cadioli M, Iadanza A, Kirchin MA, Scotti G. Follow-up of coiled cerebral aneurysms at 3T: comparison of 3D time-of-flight MR angiography and contrast-enhanced MR angiography. AJNR Am J Neuroradiol. 2008;29:1530–1536. doi: 10.3174/ajnr.A1166. [DOI] [PMC free article] [PubMed] [Google Scholar]
- 4.Bash S, Villablanca JP, Jahan R, Duckwiler G, Tillis M, Kidwell C, Saver J, Sayre J. Intracranial vascular stenosis and occlusive disease: evaluation with CT angiography, MR angiography, and digital subtraction angiography. AJNR Am J Neuroradiol. 2005;26:1012–1021. [PMC free article] [PubMed] [Google Scholar]
- 5.Castro MA, Putman CM, Cebral JR. Patient-specific computational fluid dynamics modeling of anterior communicating artery aneurysms: a study of the sensitivity of intra-aneurysmal flow patterns to flow conditions in the carotid arteries. AJNR Am J Neuroradiol. 2006;27:2061–2068. [PMC free article] [PubMed] [Google Scholar]
- 6.Chappell ET, Moure FC, Good MC. Comparison of computed tomographic angiography with digital subtraction angiography in the diagnosis of cerebral aneurysms: a meta-analysis. Neurosurgery. 2003;52:624–631. doi: 10.1227/01.neu.0000047895.82857.eb. discussion 30–31. [DOI] [PubMed] [Google Scholar]
- 7.Doerfler A, Becker W, Wanke I, Goericke S, Oezkan N, Forsting M. Multimodal imaging in the elastaseinduced aneurysm model in rabbits: a comparative study using serial DSA, MRA and CTA. Rofo-Fortschr Rontg. 2004;176:590–596. doi: 10.1055/s-2004-812753. [DOI] [PubMed] [Google Scholar]
- 8.Fahrig R, Nikolov H, Fox AJ, Holdsworth DW. A three-dimensional cerebrovascular flow phantom. Med Phys. 1999;26:1589–1599. doi: 10.1118/1.598672. [DOI] [PubMed] [Google Scholar]
- 9.Ferre JC, Carsin-Nicol B, Morandi X, Carsin M, de Kersaint-Gilly A, Gauvrit JY, Desal HA. Time-offlight MR angiography at 3T versus digital subtraction angiography in the imaging follow-up of 51 intracranial aneurysms treated with coils. Eur J Radiol. 2009;72:365–369. doi: 10.1016/j.ejrad.2008.08.005. [DOI] [PubMed] [Google Scholar]
- 10.Ford MD, Alperin N, Lee SH, Holdsworth DW, Steinman DA. Characterization of volumetric flow rate waveforms in the normal internal carotid and vertebral arteries. Physiol Meas. 2005;26:477–488. doi: 10.1088/0967-3334/26/4/013. [DOI] [PubMed] [Google Scholar]
- 11.Ford MD, Hoi Y, Piccinelli M, Antiga L, Steinman DA. An objective approach to digital removal of saccular aneurysms: technique and applications. Br J Radiol. 2009;82(Spec No 1):S55–S61. doi: 10.1259/bjr/67593727. [DOI] [PubMed] [Google Scholar]
- 12.Green D, Parker D. CTA and MRA: visualization without catheterization. Semin Ultrasound CT MRI. 2003;24:185–191. doi: 10.1016/s0887-2171(03)90011-4. [DOI] [PubMed] [Google Scholar]
- 13.Kouskouras C, Charitanti A, Giavroglou C, Foroglou N, Selviaridis P, Kontopoulos V, Dimitriadis AS. Intracranial aneurysms: evaluation using CTA and MRA. Correlation with DSA and intraoperative findings. Neuroradiology. 2004;46:842–850. doi: 10.1007/s00234-004-1259-2. [DOI] [PubMed] [Google Scholar]
- 14.Majoie CB, Sprengers ME, van Rooij WJ, Lavini C, Sluzewski M, van Rijn JC, den Heeten GJ. MR angiography at 3T versus digital subtraction angiography in the follow-up of intracranial aneurysms treated with detachable coils. AJNR Am J Neuroradiol. 2005;26:1349–1356. [PMC free article] [PubMed] [Google Scholar]
- 15.Piotin M, Gailloud P, Bidaut L, Mandai S, Muster M, Moret J, Rufenacht DA. CT angiography, MR angiography and rotational digital subtraction angiography for volumetric assessment of intracranial aneurysms. An experimental study. Neuroradiology. 2003;45:404–409. doi: 10.1007/s00234-002-0922-8. [DOI] [PubMed] [Google Scholar]
- 16.Raghavan ML, Ma B, Harbaugh RE. Quantified aneurysm shape and rupture risk. J Neurosurg. 2005;102:355–362. doi: 10.3171/jns.2005.102.2.0355. [DOI] [PubMed] [Google Scholar]
- 17.Tanoue S, Kiyosue H, Kenai H, Nakamura T, Yamashita M, Mori H. Three-dimensional reconstructed images after rotational angiography in the evaluation of intracranial aneurysms: surgical correlation. Neurosurgery. 2000;47:866–871. doi: 10.1097/00006123-200010000-00016. [DOI] [PubMed] [Google Scholar]
- 18.Taubin G, Zhang T, Golub G. Optimal surface smoothing as filter design. Fourth European Conference on Computer Vision. Fourth European Conference on Computer Vision (ECCV’96) and IBM Research Technical Report RC-20404; Mar, 1996. [Google Scholar]
- 19.Wardlaw JM, White PM. The detection and management of unruptured intracranial aneurysms. Brain. 2000;123(Pt 2):205–221. doi: 10.1093/brain/123.2.205. [DOI] [PubMed] [Google Scholar]


