

Abstract
When conducting optical imaging experiments, in vivo, the signal to noise ratio and effective spatial and temporal resolution is fundamentally limited by physiological motion of the tissue. A 3-dimensional motion tracking scheme, using a multi-photon excitation microscope with a resonant galvanometer, (512×512 pixels at 33 frames/sec) is described to overcome physiological motion, in vivo. The use of commercially available graphical processing units permitted the rapid 3-dimensional cross-correlation of sequential volumes to detect displacements and adjust tissue position to track motions in near real-time. Motion phantom tests maintained micron resolution with displacement velocities of up to 200 μm/min, well within the drift observed in many biological tissues under physiologically relevant conditions. In vivo experiments on mouse skeletal muscle using the capillary vasculature with luminal dye as a displacement reference revealed an effective and robust method of tracking tissue motion to enable (1) signal averaging over time without compromising resolution, and (2) tracking of cellular regions during a physiological perturbation.
Introduction
Intra-vital optical microscopy permits the observation of dynamic sub-cellular events in physiological systems, in vivo(Cahalan et al., 2003;Denk et al., 1990;Dunn et al., 2002;Hudetz, 1997;Rothstein et al., 2005;Rothstein et al., 2006;Stosiek et al., 2003). Targeted fluorescent probes, genetically engineered fluorescent proteins, and endogenous fluorescent molecules provide a multi-colored palette for probing the structure and dynamics of signaling and regulatory networks. Two-photon fluorescence microscopy is the most efficient method of fluorescence imaging(Combs et al., 2011;Combs et al., 2007), with near millimeter depth of penetration, highly localized excitation, low photo-toxicity, and unique information content providing an excellent platform for intra-vital microscopy (Rubart, 2004;Denk et al., 1990).
While the advantages of intra-vital observation are numerous, the intrinsic motion of the tissue limits the effectiveness of signal averaging often used to increase the signal to noise ratio (SNR) and corresponding image resolution for studies tracking sub-cellular events in time(Schroeder et al., 2010;Rothstein et al., 2005;Rothstein et al., 2006). When a tissue region of interest (ROI) is positioned within the microscope field-of-view (FOV) for observation over a period of minutes, the ROI often drifts on the order of 100 to 500 micrometers in three dimensions out of the FOV due to normal physiological processes(Schroeder et al., 2010;Rothstein et al., 2006). Tissue motion is also amplified during most physiological perturbations that cause variations in blood volume, edema, or muscle tone, precluding signal averaging or longitudinal monitoring of an ROI(Schroeder et al., 2010). Effective signal averaging is particularly important in low SNR experiments such as spectroscopy, light sensitive or weak fluorescent probe studies, or when high spatial resolution is required.
The basic tissue motion compensation techniques can be divided into methods that (1) restrict motion with mechanical devices, (2) apply retrospective corrections, and (3) implement active motion compensation via real-time tracking or prospective control. While mechanically securing a tissue before imaging can decrease the magnitude of the 3-dimensional (3D) drift, the degree to which a tissue can be stabilized is limited by the requirement that a preparation must maintain physiological function (e.g. blood flow, temperature, tissue pressure, and normal tissue displacements). Any mechanical restriction that directly impinges on the tissue, such as a cover glass, suction cups, or restriction rings, that impedes physiological motion, likely compromises normal tissue physiology. This might be most problematic during tissue edema, where mechanical restrictions may increase regional tissue pressure to higher than normal values, altering function and flow. Disruption of the tissue microenvironment and function undermines a main goal of using optical microscopy to study in vivo cellular physiology. Consequently, the mitigation of tissue motion using mechanical devices should be avoided in certain circumstances.
Retrospective corrections for tissue motion can be performed, but require large 3D volumes of data to be collected efficiently and, more importantly, the volumes must encompass the full range of the motion field. That is, the imaged 3D volume data must contain the ROI before, during, and after the motion perturbation. Retrospective identification and subsequent signal averaging of ROIs within these volumes can be accomplished using rigid body or deformation corrections generated by processing the image time series(Schroeder et al., 2010). This approach requires extensive oversampling, both in time and space (i.e. large FOV and large focal plane depth scanning), of the tissue volume to cover the full-range motion field. In our experience, the drift can approach 100 microns under normal conditions, but further increases to several hundred microns during physiological perturbations over the corresponding observation times. Thus, collecting the entire motion field, to enable retrospective correction of tissue motion, would require sampling volumes and frequencies that are difficult or insurmountable with commercially available two-photon fluorescence microscopy scanning devices.
To overcome imaging problems arising from tissue sample drift, researchers have been able to image intra-vital structures at sparse time-points by manually positioning the XY stage and Z focus of a microscope to relocate a ROI at each observation time-point. However, identifying a particular structure by eye within a dense tissue volume of repetitive features is time consuming and error prone, and human intervention greatly reduces the temporal resolution of an imaging data set.
Another approach is to automate the motion tracking process by using the live streaming image data to determine the actual tissue motion, which enables near real-time motion compensation to maintain the ROI(Schroeder et al., 2010). In our original implementation, we used rapidly acquired X-Y and X-Z 2D image planes to perform a limited prospective rigid body correction motion using both the microscope stage and focusing motor(Schroeder et al., 2010). Though this system was reasonably fast, the limited amount of data collected, from essentially two imaging planes of the 3D volume undergoing displacement limited the utility of this approach. Care had to be taken to assure that these two planes contained adequate spatial contrast to detect the displacements and this was sometimes difficult to achieve in some tissues.
The development of resonant multi-photon imaging systems(Leybaert et al., 2005) permits the rapid collection of 3D volumes that could potentially be used for more robust near real-time motion tracking than the previously implemented 2D approach to tracking. Herein, we report on the development of a 3D motion tracking system using a resonant multi-photon imaging system coupled to a real-time computer enhanced with graphical processing units (GPU) to speed data processing. By comparing a live time series of 3D image volumes against an initial template volume, the system monitors, in near real-time, tissue motion relative to the microscope FOV, and compensates for this motion by automatically adjusting the position of the microscope XY stage and Z focus in the direction opposing tissue motion. Examples are provided for monitoring the intracellular metabolites of murine skeletal muscle in vivo.
Methods and Materials
A two-axis computer controlled high performance stage (300 mm × 300 mm, 240 mm/s model 00-24-124-0000 Scan, Marzhauser Wetzlar Frankfurt, Germany) was aligned normal to the imaging axis of a commercial upright resonant scanning multi-photon microscope (Leica TCS SP5 II, Germany). All image acquisition was performed through the manufacturer provided microscope control software. A stepper motor integrated within the commercial microscope controlled the micrometer to millimeter Z position of the objective relative to a tissue sample on the stage, while a piezo nanostepping motor (Z-piezo, Physique Instruments, Germany) provided additional high speed, micrometer resolution Z position over a 150 μm range. Streaming microscope images were forwarded over a 10 Gb/s network to a dedicated stand-alone data processing computer (Intel x5472 processor operating at 3.0 GHz and 16GB of memory; Dell, Round Rock, TX USA) by a custom software script written in Python. A general computation capable graphics card (Tesla c1060; Nvidia, Santa Clara, CA USA) was installed in the data processing computer for executing parallel GPU algorithms. A USB driven data acquisition peripheral (USB-6215, National Instruments, Austin, TX USA) on the data processing computer monitored the digital (i.e., TTL) triggers from the Leica microscope to synchronize motion tracking software running on the data processing computer with microscope image acquisition. The X-Y positions of the 2-axis motorized stage were controlled via a serial connection to the Leica microscope, and the position of the Z piezo actuator motor was controlled via an analog voltage signal output by the USB data acquisition peripheral.
To track the position of a sample relative to the FOV of the microscope, imaging volumes (Z-stacks of X-Y image planes) were continuously acquired through time and spatially registered to a template volume captured at the beginning of a motion tracking session. Z-stacks were assembled by accumulating images while driving the Z-piezo actuator with a triangle wave voltage signal synchronized to the line scan-trigger of the microscope. The line scan trigger provided a external trigger for each line of the image frame being collected by the microscope providing a reference to construct the image frames in the stand alone data processing computer as well as control the timing of the Z-piezo actuator to create the Z-stacks. The triangle waveform provided two samples (down and up scans) of each volume. The total depth covered by a Z-stack was defined by the peak-to-peak voltage of the triangle wave, while the number of Z-planes (i.e., X-Y image planes) per Z-stack was defined by the number of discrete image acquisitions which occur during a given voltage ramp. For a Z-stack with n planes and covering a depth of z micrometers, the Z-piezo actuator was adjusted by z/n micrometers per frame. A schematic of this system is presented in Figure 1, with further information in the figure legend. The overall timing diagram of the process is presented in Figure 1b.
Figure 1.

A: Schematic diagram of 3D motion tracking system. The standard microscope in this system was a Leica TCS SP5 II. The images from the microscope were streamed to the Data Processing Computer (DPC) (Dell, Intel x5472 processor operating at 3.0 GHz and 16GB of memory), using a custom Python program, via a 10 Gb/s TCP Ethernet network. This data was in the form of lines of scanned data that was binned to create images using the frame sync lines from the microscope computer captured with a USB linked external acquisition system (USB-6215, National Instruments). The system programming on the DPC was performed using LabView tools with numerous calls to custom codes. The field of view, digitization schemes and macro systems alterations were manually synchronized between the microscope and DPC with a customized user interface on the DPC. The X-Y position of the 2-axis stage and the position of the Z stepper motor were controlled via a serial connection to the Leica microscope, and the position of the Z stepper motor was controlled by an analog voltage signal through the USB data acquisition peripheral. In this system, the DPC controlled the x-y-z coordinates while the Leica system controlled the scan parameters. The streaming imaging frames from the Leica were presented on the DPC system. The operator selected a reference volume and then initiated the tracking program. In coming volumes were compared to the reference volumes using a rapid 3D NCC implemented on a Tesla GPU system via CUDA. Once the displacement had been determined these were then transmitted to the Leica stage. B: Timing diagram. After the reference volume, each subsequent volume was motion corrected using the X,Y and Z correction values based on the 3D NCC estimate. The timing of the 3D NCC, lag in the stage and communication lines at large 10 micron correction required roughly 16 ms from the completion of a volume collection to the stage being corrected and stable. This would disrupt the first few lines of the next volume corresponding to only a few tenths of a percent of the total image volume. No artifacts were visually observed due to this disruption. In some cases the corrections resulted in oscillations from volume to volume due to the nature of the motion. In these cases a fraction scaling factor (sc) from 0.1 to 1 was used to modulate the step size on each image volume. This was found particularly useful in situations where rapid step changes in position occurred from time to time. The fraction scaling factor reduced the time constant of the stage response, however, could be adjusted for each experimental condition.
The displacement of a tissue sample between time steps (i.e., each Z-stack, 3D volume) was modeled as a three dimensional, purely translational rigid transformation. The translation vector (x, y, z) was computed by localizing the maxima of the three dimensional normalized cross-correlation (3D NCC) function f(V0, Vt), where V0 is a template Z-stack defined at the start of a tracking session and Vt is the latest acquired Z-stack. The vector (x, y, z)i was transformed from image coordinates (pixels) to the vector (x, y, z)s in spatial coordinates (micrometers) by a scaling factor defined by the magnification of the microscope objective and the distance z/n between X-Y image planes within a Z-stack. The XY stage and Z stepper motor were displaced by the vector (x, y, z)s scaled by a gain –Kp after each Z-stack was acquired, such that the single volume of interest (VOI) was maintained over the course of an experiment. Tracking failure occurred when the displacement vector (x, y, z)i in image space does not correspond to the spatial displacement between V0 and Vt, such that displacing the stage by the vector (x, y, z)s does not recover the original position of the sample relative to the FOV of the microscope.
The 3D NCC algorithm is computationally expensive. Typical experiments generate microscope images that are 512 × 512 pixels, and image stacks with 8, 16, or 32 slices. The high-speed resonant-scanning two photon excitation fluorescence microscopy (TPEFM) microscope collected 33 frames per second (FPS), resulting in a per-volume acquisition rate of between ~1 and 4.2 volumes per second (VPS) depending on the number of slices. Computing the displacement vector (x, y, z)i between two image volumes of these dimensions is computationally prohibitive (i.e., computation time exceeds TPEFM volume acquisition time) on even the fastest desktop workstations. In order to enable real-time calculation of the 3D NCC, the algorithm was implemented in the Compute Unified Design Architecture (CUDA) framework for parallel execution on a GPU. The implementation adapted a commonly used frequency domain normalized cross-correlation algorithm(Lewis, 1995)(for complete description see http://scribblethink.org/Work/nvisionInterface/nip.pdf). Even with the enhanced performance offered by a parallel GPU implementation of the 3D NCC algorithm, the high frame rate of the resonant-scanning TPEFM microscope captured Z-stacks more rapidly than the volumes could be processed with images at a full 512 × 512 pixel resolution. To decrease the 3D NCC processing time, images were down-sampled by a factor of two after transfer from the microscope. The runtime of the 3D NCC algorithm on stacks of 256 × 256 pixel images was between 1.8x (8 slices per stack) and 2.5x (32 slices per stack) faster than the acquisition rate of a Z-stack. The GPU implementation offers a speedup of 7.9x (256 × 256 × 8) to 9.7x (256 × 256 × 32) over a functionally equivalent, multi-threaded CPU, algorithm implementation in Matlab running on the same computer. Clearly, improving the algorithm performance or GPU performance could improve the temporal and spatial resolution of the 3D NCC method of real-time tracking of tissue motion.
The collection of volumes permitted the 3D compensation for non-rigid body deformations of a sample, in place of the 2D approach used in earlier work (Schroeder et al., 2010). A motion map was calculated for each volume using an optical flow method which iteratively maximized the local cross-correlation image subsets at different resolutions(ChefdHotel et al., 2002;Hermosillo et al., 2002). Non-rigid 3D image registration was performed using the images in the vascular/dye channel, which contained greater structure, and the deformation field was subsequently applied to both channels. The reference target volume used for registration was an average of the first several vascular images. A 5-th order B-spline interpolation was used for application of the non-rigid deformation to minimize loss of spatial resolution. The improvements in image quality in these trials were modest but improved the signal to noise and spatial resolution of the average images by performing this post-processing registration before image averaging as previously reported(Schroeder et al., 2010).
Results
Phantom Tracking Experiments
A prepared slide of human cheek epithelial cells stained with Acridine Orange to label nuclei and cell boundaries was selected as an imaging phantom for simulated motion tracking experiments. The sample was excited with a pulsed Ti:sapphire laser tuned to 720 nm, and two-photon fluorescence emission images were collected with the Leica Application Suite software. To simulate the tissue physiological drift observed during intra-vital microscopy, a six-axis hexapod stage (Physique Instruments, Germany) was secured to the surface of the microscope X-Y stage. The imaging phantom was placed on the hexapod stage such that any hexapod stage-driven motion displaced the sample relative to the FOV of the microscope. Time varying displacement signals were generated by the function f(t) = integral(St + n(t)), where the constant S is equal to the desired average rate of motion of the phantom and n(t) is a source of Gaussian noise. Three-dimensional phantom tissue drift was simulated by changing the position of the hexapod stage with two time varying signals, one controlling the X axis and a second controlling the Z axis. Because the X-Y plane of the hexapod stage was rotated relative to the parallel X-Y plane of the microscope stage and microscope image, displacing the X axis of the hexapod stage results in the displacement of the phantom relative to the imaging plane along both the X and Y axes.
Five trials were performed on each of five rates of drift from 50 μm/min to 250 μm/minute. For each trial, a VOI was located within the phantom, and a motion tracking session was initiated by first capturing a template volume. The motion control loop was then activated, and the simulated drift signals played back to displace the hexapod stage with the tissue phantom. Volumes were composed of 16 Z-slices each 512 × 512 pixels, with 2 μm between each Z-slice, covering a spatial volume of 347 × 347 × 32 μm. Each new displacement vector (x, y, z)s was added to an integral vector to track the total displacement of the microscope X-Y stage and Z stepper motor over time (compensation integral). For a successful motion tracking session, the value of the integral vector over time will correspond closely to the accumulated simulation drift signals, indicating that the microscope X-Y stage and the hexapod stage has moved in opposing directions to maintain the imaging of single volume of interest. For tissue phantom rates of drift at 50 μm/min, 100 μm/min, and 150 μm/min, each of the 5 trials was successful. At a drift rate of 200 μm/min, 3 out of 5 trials were successful, while in 2 out of 5 trials the motion tracking software failed to maintain the VOI. At a drift rate of 250 μm/min, tracking failed in 4 out of 5 trials suggesting a drift velocity limit for this approach. However, this drift velocity limit will likely be influenced by the image SNR and the information content of the VOI being tracked. It is assumed the performance of this motion tracking system is dependent on the image SNR as well as spatial distribution of reference tissue structures in the template volume and subsequent experimental volumes. A precise merit score for pre-determining likelihood of a given volume being tracked on is currently not available. We are currently attempting to combine the SNR and spatial distribution of structures into a useful merit score to select initial reference volumes to optimize tracking in different tissues.
When implementing intra-vital optical microscopy, signal averaging is a key fundamental method of increasing the image SNR. Motion interferes with image SNR as well as effective resolution. Figure 2 shows a time-averaged image plane from paired experiments, motion tracking enabled versus disabled, each performed at the same location within the tissue phantom with a simulated drift of 100 μm/min. In the image from the untracked trial (Figure 2A), features are blurred along the direction of motion, and the background intensity of the image increases due to averaging with out-of-plane (i.e. Z plane drift) information while the signal from the individual nuclei decreased due to motion blurring. Both of these effects resulted in a decrease in effective image contrast and resolution. The tracked image (Figure 2B) retains the SNR and acceptable resolution of the image despite the 100 μm/min displacement of the phantom tissue.
Figure 2.
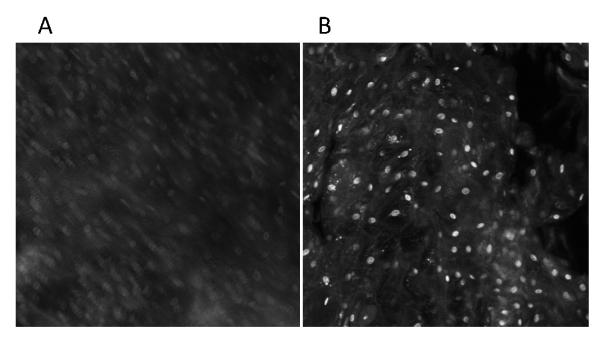
Motion phantom tests. Cheek cell images. Average images collected after 16 images collected over 1 minute with a displacement of 100 um/min. A) No motion compensation. B) Motion compensation.
In Figure 3, the mean and standard error of the motion tracking integral across each successful trial is plotted along with the simulated drift signals for the 50, 100, 150 and 200 μm/min trials. The motion tracking compensation integral signals closely follow the simulated drift signals, with increasing standard error as the rate of motion increases.
Figure 3.

Displacement in X-Y and Z during repeated trials at 50, 100, 150 and 200 um/min. Bars represent standard error from 5 repeated trials. Dotted line represents the maximum standard error.
In vivo Skeletal Muscle Studies
In vivo Mouse experiments were conducted using an approved protocol reviewed by the NHBLI Animal Care and Use Committee. The preparation was similar to a previously published model(Schroeder et al., 2010). Mice were initially anesthetized with 1.5-2% isoflurane administered via a nose cone, then rapidly intubated and continuously ventilated (Harvard Apparatus, Boston MA) with 1.5-2% isoflurane using ventilation parameters to maintain physiological arterial pCO2 and pO2. Mice then were placed on a water heated surgical bed custom designed for the microscope stage. Leg fur was removed from the tibalis anterior region by applying depilatory cream. The skin was then carefully removed from the surface of the muscle. The leg was attached to the surgical bed by enclosing it within a deformable cast and securing the cast to the bed. Layers of fascia were teased off using forceps to reduce the collagen and elastin interference. The animal bed was placed on top of the microscope stage, and the tibialis anterior muscle was manually positioned beneath the microscope objective. Coupling of the water emersion objective with the tissue was accomplished with a 0.3% carbomer optical coupling gel(Rothstein et al., 2006).
The exposed muscle was imaged with a pulsed Ti:sapphire laser tuned to 720nm (Spectra Physics, Irvine, CA), with two emission filters tuned to 430-490nm and 550-575nm, separating the signal generated from mitochondrial NAD(P)H from Rhodamine B fluorescence in the vasculature. The jugular vein was canulated and 0.1 mL of 10% w/v Rhodamine B Dextran 70,000 (molecular probes) was infused intravenously over 5 minutes. Microscope images were acquired continuously throughout dye infusion, and the infusion was terminated if vessel boundaries could be clearly resolved in the Rhodamine B channel before the entire 0.1 mL volume was delivered. To induce anoxia, oxygen was completely replaced with nitrogen while maintaining respiration with the ventilator as previously described(Schroeder et al., 2010).
A VOI with mixed type muscle fibers and a spatially varied vascular network was located by an operator. We have found that the capillary system makes an excellent tissue structure system that enables the 3D NCC algorithm to efficiently monitor tissue displacement. The capillary system is, by necessity, distributed throughout the tissue and provides very high 3D spatial frequency information for the algorithm to detect displacements. We have also found these vascular structure signals to be useful for tissue motion tracking in liver and kidney. A motion tracking session was conducted by capturing an initial template volume, activating the motion compensation loop on the vascular channel, and then recording the stream of two-channel images from the microscope. The motion compensation integrals and a 3D correlation coefficient, the maxima of the cross-correlation with the reference volume, were recorded along with two-channel emission data creating a 5-dimensional image array, (channel, x, y, z, time) for post-processing analysis.
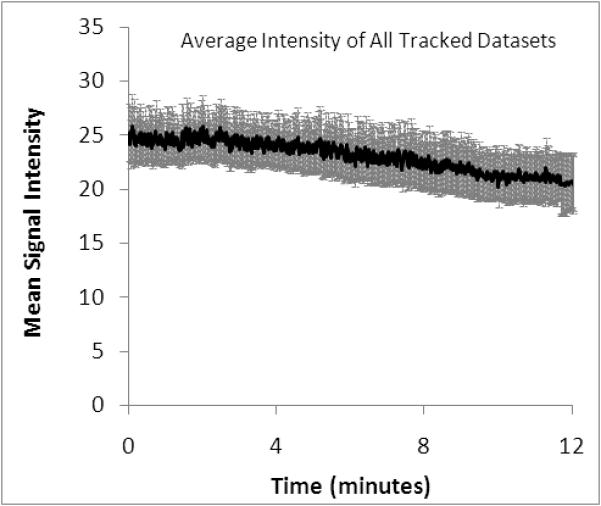
A set of experiments was conducted on 3 animals to quantitatively determine the effectiveness of this approach to compensate for tissue motion. In the ‘control’ arm of the experiment, an animal was prepared for in vivo imaging using the same methods used for tracking. A reference volume of interest was selected, and cross-correlation to the reference volume was calculated for each subsequent volume, but no change in sample position was performed. For the ‘intervention’ arm of the experiment, a reference volume was selected and the tracking scheme was used to maintain position on the volume of interest. No experimental perturbation was performed in this experiment, since any change in signal output would alter the cross-correlation between the current volume and the reference volume of interest. These experiments are summarized in Figure 4 and Figure 5. As seen in Figure 4a, without tracking the cross-correlation with the reference image degrades quickly, usually within 4 minutes. This demonstrates a phenomenon often observed in biological preparations, wherein there is a slow drift of the tissue under exposed tissue conditions. The mechanism responsible for this drift may differ from tissue to tissue, and is not fully understood. With the tracking scheme, the correlation with the reference image was much improved over the ~15 minutes of this study (Figure 4b). There was a slow, almost linear, decrease in the correlation over the 14 minutes, which may be ascribed to a lower overall signal to noise in the image due to photobleaching; notably, the mean signal in the images also decreased linearly with time (Figure 4d). The overall and average displacements in the x,y and z dimensions are presented in Figure 5. In the tracked data, an additional retrospective 3D deformation correction could be performed, which made minor improvements in tissue registration over time. No deformation correction could be applied to the non-tracked data because the 3D volumes did not have sufficient overlap to perform the correction.
Figure 4.
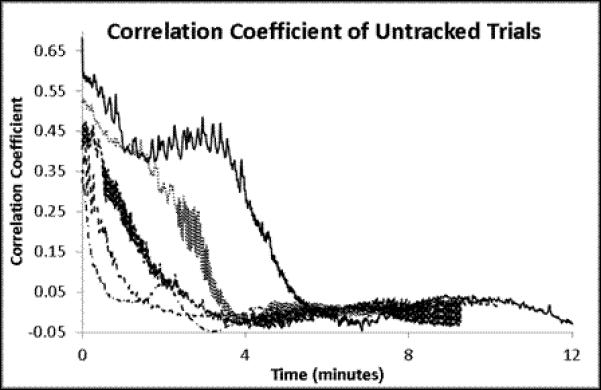
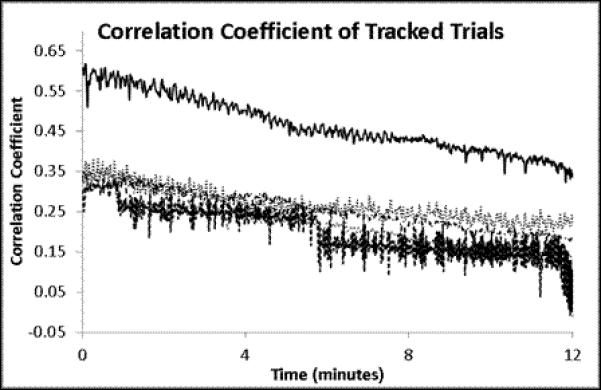
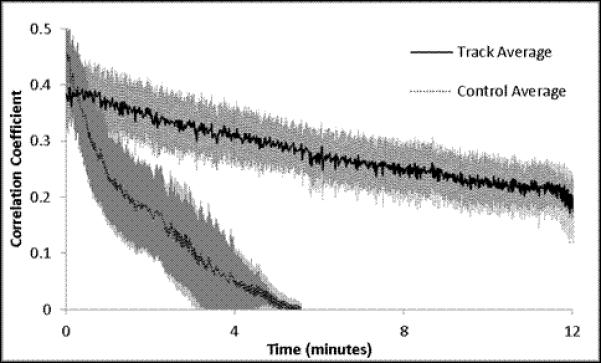
Time course analysis. All data was extracted from an imaging series using the following parameters: All volumes are 512 × 512 × 16 pixels at 0.85 μm × 0.85 μm × 2.13 μm per pixel or 434.17 × 434.17 × 32 μm total. 2 line averaged images took 70 ms per frame and resulted in 1.12 s per volume. A) Untracked 3D cross-correlation coefficient to the initial reference volume as a function of time. Each line represents a different volume field. B) Tracked 3D cross-correlation coefficient over time. Each line represents the tracking of a separate volume. C) Mean values + Standard error of the means for the 5 trials.
Figure 5.
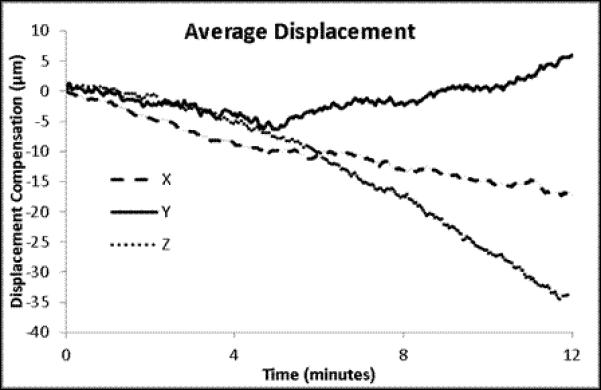
The individual and mean displacements for X, Y and Z for the time courses presented in Figure 4. The mean displacements are presented with the standard error of the means for the 5 trials.
Representative movies of the tracked and untracked data are presented in supplemental Movie #1 where rolling 50 frame averages of a single frame from a tracked and untracked volume is presented. The untracked volume presented was the volume that moved the least amount in the trials. For most in vivo applications, image averaging will be used to improve signal to noise and associated spatial resolution. We show the average of 590 frames from the untracked and tracked data sets from the Supplemental Movie files. The image resolution and signal to noise is clearly improved in the tracked data set as implied from the cross-correlation data presented in Figure 4.
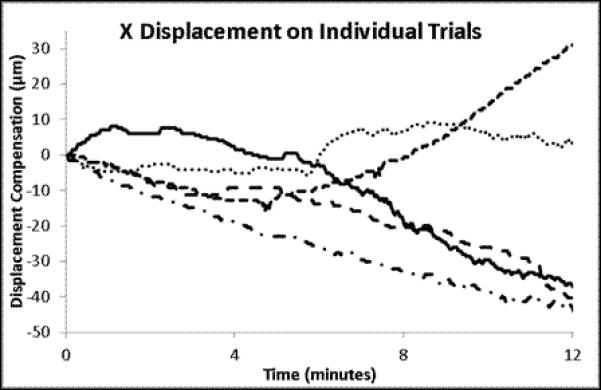
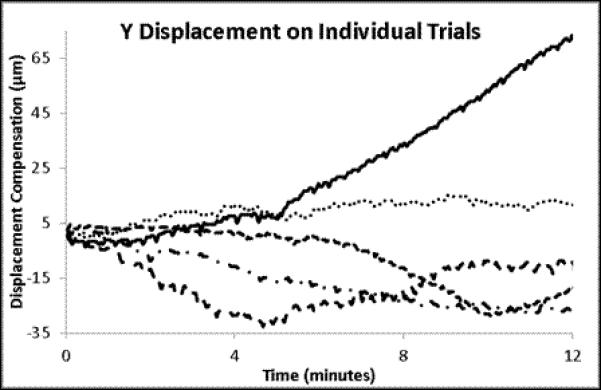
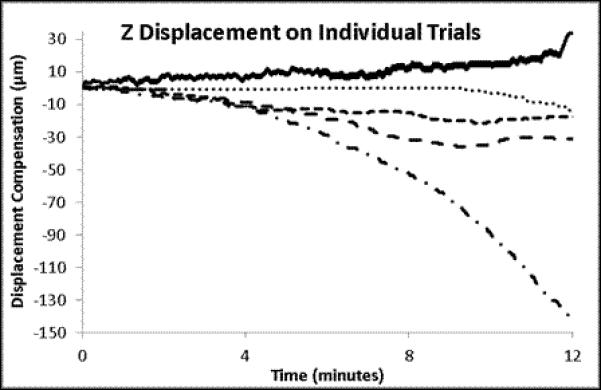
To evaluate this approach during a physiological perturbation, we selected systemic hypoxia as it causes metabolic perturbations to the NADH redox state as well as significant changes in muscle volume and blood flow. For these experiments the reference image was collected and then a baseline was collected for two minutes. After this control period, the oxygen supply was replaced with nitrogen, and images were recorded for an additional three minutes. The procedure was repeated for seven independent trials. Figure 8 shows the X, Y, Z component of the motion compensation integral over time for each of the seven trials. The 3D correlation coefficient of the vascular structure over time was not collected or reported in these studies, as some of the degradation of the correlation is due to changes in the vascular volume. The delay in a motion effect caused by the removal of oxygen was likely due to residual oxygen in the ventilation system, lungs, and blood. During the period before the oxygen is replaced with nitrogen to induce anoxia, the average rate of Z-axis motion drift across the seven trials was 6.1 um/min. After the anoxic event, the resting rate of drift was maintained for a period of approximately one minute, after which the rate of drift increased sharply to an average of 37.7 um/min. In each of the seven trials, the total displacement in the Z-dimension exceeded the depth of the VOI (32 um). This is an important observation since it confirms that the motion was greater than the FOV of the 3D volume, and therefore could not be corrected with post-processing methods alone. That is, the image planes of interest would not be in the 3D FOV at the beginning and end of the experiment without tracking.
Figure 8.
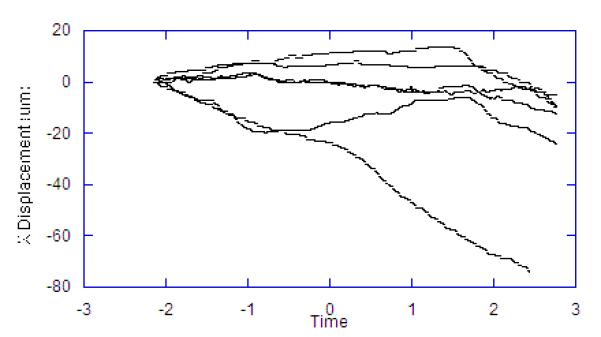
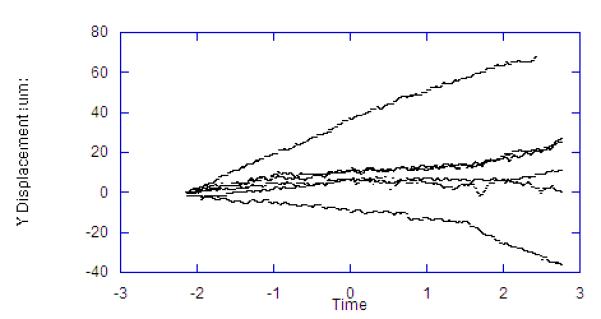
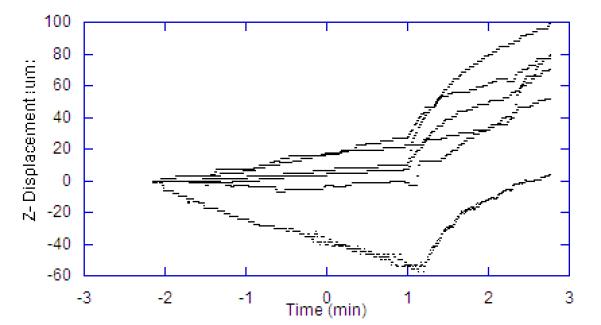
Displacements Occurring in Hypoxia Trials. Each line represents a different animal. Time scale is in minutes with hypoxia was induced at time zero. Lag in effect is due to oxygen in the system. A) Z displacement. B) X Displacement. C) Y Displacement.
The displacements were consistent with the metabolic perturbations associated with hypoxia, including a large increase in NAD(P)H concentration. The correlation of NAD(P)H with hypoxia had been previously demonstrated in our lab(Schroeder et al., 2010) using principal component analysis. As seen in the representative study presented in Figure 9 this system maintained good image resolution through the hypoxia transition and the NAD(P)H signal correlated well with the initiation of the spatial displacements associated with hypoxia. A positive displacement in the Z direction was observed in all trials (See Figure 8a) and was highly correlated with the changes in NADH(P)H, which likely represents a increase in muscle volume with hypoxia. The tissue displacement in the X and Y directions was more random when not corrected for muscle axis as shown in Figure 8. Thus, these large X and Y displacements are likely secondary to the metabolic consequences of the hypoxia, related to alterations in fiber type specific tissue Ca2+ levels causing regional contractions(Howlett & Hogan, 2007) (Nayler et al., 1979).
Figure 9.
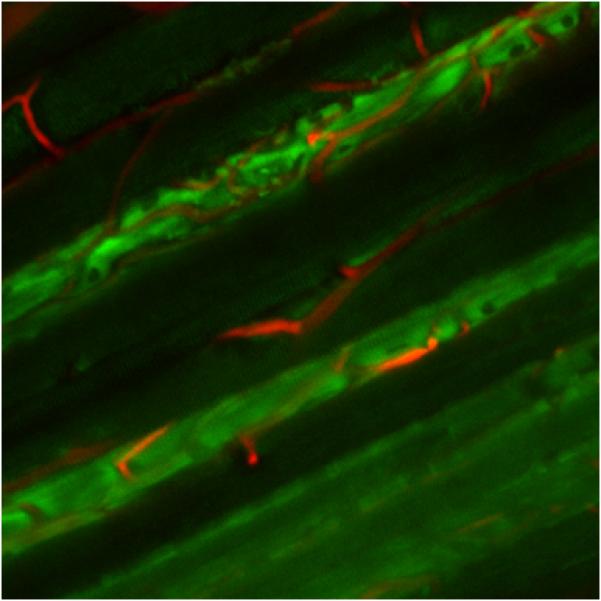
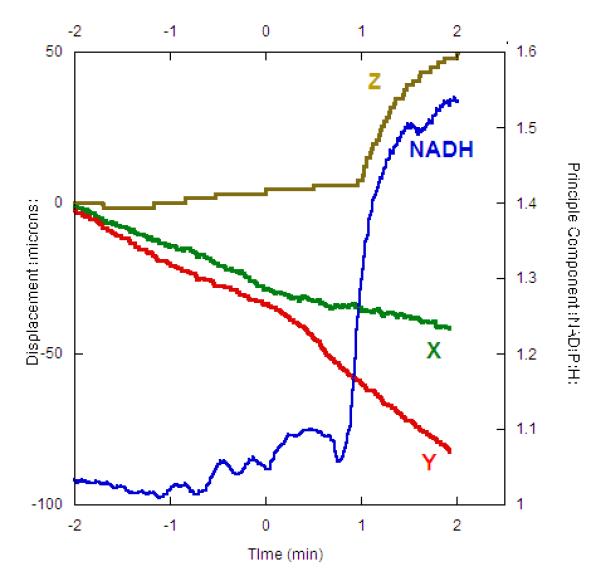
Averaged combined image of red and blue channels and NAD(P)H correlated principal component of hypoxia with displacements for a single experiment. A) Image averaged over the entire experimental period revealing the maintenance of the imaging plane and resolution. The red and blue channels were averaged for this presentation with the blue channel be presented in green for better visualization. B) For the same experiment as presented in (A), the x, y and z displacement values and principal component amplitude that correlated with NAD(P)H fluorescence. The principal component is normalized to the control period.
Discussion and Conclusions
Intra-vital optical microscopy image SNR and resolution is limited by tissue motion. In our experience using commercially available equipment, inherent in vivo tissue motion often dominates image quality more than the microscope optics, imaging probe, or excitation power applied as illustrated in Figure 7. Thus, having a robust motion compensation system to permit image or spectral averaging is critical for in vivo optical microscopy studies.
Figure 7.

Average images from the blue (NAD(P)H) and red (Rhodamine) channels from a tracked (right) and untracked (left) data sets. All images represent the average of the first 590 volumes of each dataset. Images were auto window leveled individually. The top panels represents the red channel. Middle panels represent the blue channel. Bottom panel represents the merged image of both channels.
The resonant scanning two-photon fluorescence microscope enables the acquisition of 512×512 pixel multi-channel frames to build 3D time series data at up to 1.8 VPS. This VOI observation rate is an improvement over traditional intra-vital imaging methods, and creates the possibility to follow in vivo sub-cellular temporal dynamic events, as well as to average sparse or weak signals without loss of the effective image resolution. We demonstrated the use of rather inexpensive GPU technology to process the near real-time 3D data stream to actuate retrospective adjustments to the XY stage and focus positions maintaining a constant VOI based on a rigid body correction. With the current VOI imaging rates (i.e., VPS), computational speeds, and selected tissue samples, we were able to demonstrate motion compensation for displacement rates less than 200 μm/min both in phantoms and in vivo tissues. By reducing the VOI size, increasing scan rates (assuming adequate image SNR), or improving computational speed, more rapid motion corrections can be accomplished. We found that using the initial 3D volume as a reference for motion calculations is superior to the prior methods of using two orthogonal image planes (Schroeder et al., 2010). The 3D NCC method of tracking tissue motion is more robust at maintaining a ROI during perturbations, and shows less dependence on specific tissue anatomy. We believe these improvements are a direct result of simply using more information, the 3D volume, rather than just two frames within the volume.
The physiological studies demonstrate that after temporal averaging the motion tracking system improves image SNR and effective resolution, in vivo. With regard to longitudinal changes in intracellular events, we demonstrated, with large net displacements (>100 μm) associated with a metabolic perturbation such as hypoxia, the ability of 3D NCC tracking to retain a region of interest within a few percent. This permitted the monitoring of intracellular events over long time periods associated with very challenging physiological processes.
In summary, a motion tracking system is presented that uses the rapid image acquisition capabilities of a resonant scanning 2-photon excitation microscope to generate 3D volumes for on-line displacement calculations and stage/objective adjustments. We demonstrate that this system can correct for motions on the order of 100 μm per minute well above the physiological drift seen in many biological systems. Using this approach, an improvement in signal to noise and spatial resolution was observed in vivo, even under “resting” conditions. These motion compensation approaches will be very effective in overcoming this major limitation of high-resolution optical microscopy, in vivo, as well as other systems where motion may degrade image quality.
Supplementary Material
Figure 6.
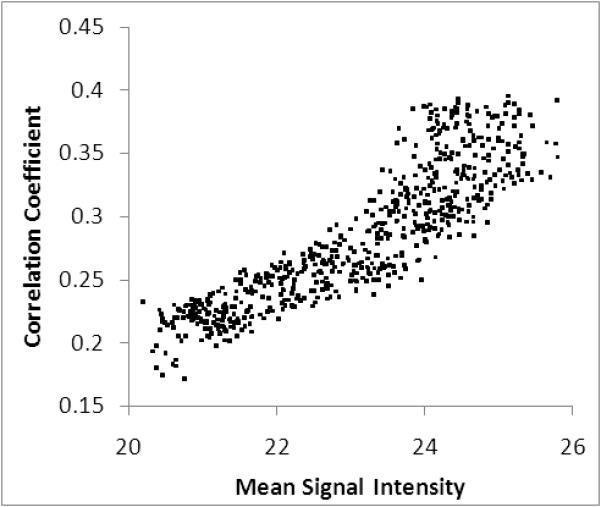
Signal amplitude over time and correlation with 3D cross-correlation coefficient. A) Mean total image signal amplitude over time for the 5 trials + standard error of the mean. B) Plot of 3D cross-correlation with total image signal over all 5 trials.
Reference List
- Cahalan MD, Parker I, Wei SH, Miller MJ. Real-time imaging of lymphocytes in vivo. Curr Opin Immunol. 2003;15:372–377. doi: 10.1016/s0952-7915(03)00079-7. [DOI] [PMC free article] [PubMed] [Google Scholar]
- ChefdHotel C, Hermosillo G, Faugeras O. Flows of diffeomorphisms for multimodal image registration. Proceedings of IEEE International Symposium on Biomedical Imaging. 2002:753–756. [Google Scholar]
- Combs CA, Smirnov A, Chess D, McGavern DB, Schroeder JL, Riley J, Kang SS, Lugar-Hammer M, Gandjbakhche A, Knutson JR, Balaban RS. Optimizing multiphoton fluorescence microscopy light collection from living tissue by noncontact total emission detection (epiTED) J Microsc. 2011;241:153–161. doi: 10.1111/j.1365-2818.2010.03411.x. [DOI] [PMC free article] [PubMed] [Google Scholar]
- Combs CA, Smirnov AV, Riley JD, Gandjbakhche AH, Knutson JR, Balaban RS. Optimization of multiphoton excitation microscopy by total emission detection using a parabolic light reflector. J Microsc. 2007;228:330–337. doi: 10.1111/j.1365-2818.2007.01851.x. [DOI] [PubMed] [Google Scholar]
- Denk W, Strickler JH, Webb WW. Two-photon laser scanning fluorescence microscopy. Science. 1990;248:73–76. doi: 10.1126/science.2321027. [DOI] [PubMed] [Google Scholar]
- Dunn KW, Sandoval RM, Kelly KJ, Dagher PC, Tanner GA, Atkinson SJ, Bacallao RL, Molitoris BA. Functional studies of the kidney of living animals using multicolor two-photon microscopy. Am J Physiol Cell Physiol. 2002;283:C905–C916. doi: 10.1152/ajpcell.00159.2002. [DOI] [PubMed] [Google Scholar]
- Hermosillo G, ChefdHotel C, Faugeras O. Variational Methods for Multimodal Image Matching. Int J Comp Vis. 2002;50:329–343. [Google Scholar]
- Howlett RA, Hogan MC. Effect of hypoxia on fatigue development in rat muscle composed of different fibre types. Exp Physiol. 2007;92:887–894. doi: 10.1113/expphysiol.2007.037291. [DOI] [PubMed] [Google Scholar]
- Hudetz AG. Blood flow in the cerebral capillary network: a review emphasizing observations with intravital microscopy. Microcirculation. 1997;4:233–252. doi: 10.3109/10739689709146787. [DOI] [PubMed] [Google Scholar]
- Lewis JP, Laurendeau D, woodham RJ. Vision Interface 95. Vision Interface VI1995. Canadian Image Processing and Pattern Recognition Society; 1995. Fast Template Matching; pp. 120–123. Ref Type: Conference Proceeding. [Google Scholar]
- Leybaert L, de MA, Mabilde C, Sanderson MJ. A simple and practical method to acquire geometrically correct images with resonant scanning-based line scanning in a custom-built video-rate laser scanning microscope. J Microsc. 2005;219:133–140. doi: 10.1111/j.1365-2818.2005.01502.x. [DOI] [PubMed] [Google Scholar]
- Nayler WG, Poole-Wilson PA, Williams A. Hypoxia and calcium. Journal of Molecular and Cellular Cardiology. 1979;11:683–706. doi: 10.1016/0022-2828(79)90381-x. [DOI] [PubMed] [Google Scholar]
- Rothstein EC, Carroll S, Combs CA, Jobsis PD, Balaban RS. Skeletal muscle NAD(P)H two-photon fluorescence microscopy in vivo: topology and optical inner filters. Biophys J. 2005;88:2165–2176. doi: 10.1529/biophysj.104.053165. [DOI] [PMC free article] [PubMed] [Google Scholar]
- Rothstein EC, Nauman M, Chesnick S, Balaban RS. Multi-photon excitation microscopy in intact animals. J Microsc. 2006;222:58–64. doi: 10.1111/j.1365-2818.2006.01570.x. [DOI] [PMC free article] [PubMed] [Google Scholar]
- Rubart M. Two-photon microscopy of cells and tissue. Circ Res. 2004;95:1154–1166. doi: 10.1161/01.RES.0000150593.30324.42. [DOI] [PubMed] [Google Scholar]
- Schroeder JL, Luger-Hamer M, Pursley R, Pohida T, Chefd’hotel C, Kellman P, Balaban RS. Short communication: Subcellular motion compensation for minimally invasive microscopy, in vivo: evidence for oxygen gradients in resting muscle. Circ Res. 2010;106:1129–1133. doi: 10.1161/CIRCRESAHA.109.211946. [DOI] [PMC free article] [PubMed] [Google Scholar]
- Stosiek C, Garaschuk O, Holthoff K, Konnerth A. In vivo two-photon calcium imaging of neuronal networks. Proc Natl Acad Sci U S A. 2003;100:7319–7324. doi: 10.1073/pnas.1232232100. [DOI] [PMC free article] [PubMed] [Google Scholar]
Associated Data
This section collects any data citations, data availability statements, or supplementary materials included in this article.