

Abstract
Background
Overexpression of phosphatase of regenerating liver 3 (PRL-3) has been implicated in gastric cancer (GC) metastasis. Epidemiological studies have evaluated the relationship between PRL-3 expression and prognosis in GC. However, results still remains controversial. In this study, a meta-analysis was performed to evaluate the association of PRL-3 expression with overall survival (OS) and clinicopathological characteristics.
Methods
Literature databases were searched to identify eligible studies dated until April 2013. Summary hazard ratios (HRs) or odds ratios (ORs) with 95% confidence interval (95% CI) were calculated to estimate the association.
Results
A total of 1380 GC patients from six studies were included in the meta-analysis. Overall, the combined HR estimate for OS in a random-effect model was 1.89 (95% CI = 1.38–2.60; P<0.001). Results showed that PRL-3 overexpression was significantly associated with OS, indicating that it may be a biomarker for poor prognosis of GC. Both subgroup and sensitivity analyses further identified the prognostic role of PRL-3 expression in GC patients. Moreover, PRL-3 overexpression was significantly associated with tumor stage (OR = 2.25; 95% CI = 1.63–3.12; P<0.001), depth of invasion (OR = 2.03; 95% CI = 1.38–2.98; P<0.001), vascular invasion (OR = 2.52; 95% CI = 1.79–3.56; P<0.001), lymphatic invasion (OR = 3.74; 95% CI = 2.49–5.63; P<0.001), and lymph node metastasis (OR = 4.56; 95% CI = 2.37–8.76; P<0.001). However, when age, sex, tumor size, and tumor differentiation were considered, no obvious association was observed.
Conclusions
This meta-analysis reveals significant association of PRL-3 overexpression with OS and some clinicopathological features in GC. PRL-3 may be a predicative factor of poor prognosis and aggressive tumor behavior in GC patients.
Introduction
The incidence and mortality of gastric cancer (GC) have dramatically decreased over the past few decades in many regions. However, this disease remains the second most common malignancy worldwide, with an estimated 989 600 new cases in 2008 [1], [2]. Despite advances in understanding the pathogenesis, early diagnosis, and new treatment approaches of GC, the results are still unsatisfactory [3]. Therefore, finding molecular markers that can predict the potential of tumor recurrence in GC patients and their prognosis is extremely important in establishing appropriate individualized therapy.
Considerable effort has been exerted to identify prognostic biomarkers in GC patients. Although some genes (e.g., CD133, Snail, p53, and STAT3) have been investigated in recent studies [4]–[7], a marker that can predict the survival of GC patients remains to be identified.
Protein tyrosine phosphatases (PTPs) are key regulatory enzymes in signal transduction pathways that are implicated in the tumorigenesis and metastasis of human cancers [8]. Phosphatase of regenerating liver (PRL) family is a PTP superfamily comprising three members, namely, PRL-1, PRL-2, and PRL-3 [9]. PRL-3 (also known as PTP4A3), is an important metastasis gene first identified in colorectal cancer in 2001 [10]. PRL-3 has been observed to be consistently overexpressed in all liver metastases derived from primary colorectal cancer compared with corresponding normal colorectal epithelium, adenomas, and primary tumors. Since then, many studies have suggested that PRL-3 expression is associated with metastasis of multiple tumor types by promoting the migration and invasion of tumor cells [11]–[13]. Therefore, the elevated expression of PRL-3 can be a significant biomarker for predicting poor survival in GC [14], [15].
Several studies have attempted to determine whether PRL-3 expression may be a prognostic factor for survival in GC patients. However, the results of these studies are controversial or inconclusive because of their limited sample size or genuine heterogeneity. Accordingly, this study aimed to review all available studies that investigated the relationship between PRL-3 overexpression and its clinical outcome in GC patients. A meta-analysis was conducted to more precisely estimate the prognostic significance of PRL-3 expression.
Materials and Methods
Search Strategy
The PubMed, ISI Web of Science, and Embase databases were searched to identify studies that assessed PRL-3 as a prognostic factor for survival in GC patients. The search ended in April 21, 2013, and no lower date limit was used. The search terms were “PRL-3,” “PRL3,” “PTP4A3,” “phosphatase of regenerating liver 3”; or “protein tyrosine phosphatase type IVA member 3” and “gastric tumors,” “gastric cancer,” “gastric carcinoma,” “gastric neoplasms,” “stomach cancer,” “stomachic cancer,” “stomachal cancer”; or “GC” and “survival,” “prognostic”; or “prognosis.” No language restriction was imposed. All references cited in the included studies were also reviewed to identify additional published articles not indexed in the common database.
Study Eligibility
The studies included in this meta-analysis are either retrospective or prospective cohort studies that evaluated the association between PRL-3 expression and overall survival (OS; i.e., date of surgery to date of death as a result of any cause). Studies considered ineligible for the meta-analysis were as follows: reviews, conference abstracts, editorials, or letters; and articles with insufficient published data in a full-text paper for determining an estimate of hazard ratio (HR) and 95% confidence interval (CI). In case of multiple publications from the same institution with identical or overlapping patient cohorts, only the largest study was included to avoid duplication of information.
Data Extraction
Two authors (Hu L.R. and Luo H.Q.) independently extracted data from eligible studies, and disagreements were resolved through consensus to all items. Standardized abstraction sheets were used to record data from individual studies. Data retrieved from the articles included the following: first author, year of publication, country of origin, ethnicity, number of patients analyzed, follow-up months, analysis method, blinding of PRL-3 measurements, cut-off value, number of high/low PRL-3 expression, HR estimation, and quality scores. For each study, HR was estimated using an approach reported by Parmar et al [16]. The most accurate approach is to obtain the HR estimate and 95% CI directly from the paper, or calculating them using the parameters such as the O-E statistic and variance offered in the manuscript. Otherwise, the number of patients at risk in each group, the number of events and P-value of the log-rank statistic were retrieved to permit an approximate calculation of the HR estimate and its variance. If the study did not provide a HR but reported the data in the form of the survival curve, survival rates at certain specified times were extracted from them for the reconstruction of the HR estimate and its variance, with the assumption that the rate of patients censored was constant during the follow-up.
Quality Assessment
Quality assessment for the studies in this meta-analysis was performed using the Newcastle Ottawa scale (NOS) recommended by the Cochrane Non-Randomized Studies Methods Working Group [17], [18]. Based on the NOS, studies were judged based on three broad perspectives: selection of study groups (one criterion), comparability of study groups (four criteria), and ascertainment of outcome of interest (three criteria). Given the variability in quality of observational studies found on our initial literature search, we considered studies as high quality if they met five scores or more of the NOS criteria.
Statistical Analysis
STATA version 11.0 (STATA Corporation, College Station, TX, USA) was used for all statistical analyses. For the pooled analysis of the correlation between PRL-3 overexpression and clinicopathological features (age, sex, tumor size, tumor stage, tumor differentiation, the depth of invasion, vascular invasion, lymphatic invasion, and lymph node metastasis), odds ratios (ORs) with their corresponding 95% CI were combined to estimate the effect. The combined HR with 95% CI was used to calculate and assess the strength of the association of PRL-3 expression. An observed HR>1 indicated a poor prognosis for the group with PRL-3 overexpression and would be considered to be statistically significant if the 95% CI did not overlap 1.
Heterogeneity assumption was examined by the chi-squared test based on the Q statistic [19] and was considered statistically significant when P<0.10. Heterogeneity was quantified by the I 2 metric, which is independent of the number of studies used in the meta-analysis (I 2<25%, no heterogeneity; I 2 = 25%–50%, moderate heterogeneity; I 2>50%, extreme heterogeneity). The pooled HR estimation of each study was calculated using a random-effects model (DerSimonian and Laird method) when P<0.10; otherwise, a fixed-effect model was used (Mantel–Haenszel method) [20].
To validate the credibility of outcomes in this meta-analysis, sensitivity analysis was performed by sequential omission of each individual study using the “metaninf” STATA command. Potential publication bias was evaluated through Begg’s and Egger’s Asymmetry tests [21], as well as through visual inspection of funnel plots, in which the standard error was plotted against log (HR) to form a simple scatterplot. Statistical significance for the interpretation of the Egger’s test was defined as P<0.10.
Results
Study Characteristics
Figure 1 illustrates the trial flow chart. The literature search identified a total of 41 potentially relevant articles. Upon further review, 31 were excluded after reading the title and abstract because of obvious lack of relevance. The following articles were also excluded: one review-type article [15], and three duplicated publications [22]–[24] overlapping populations with other eligible studies [25], [26]. After selection, six studies published in English language were finally enrolled for analysis of the prognostic value of PRL-3 expression in the meta-analysis [25]–[30].The main characteristics of these six included studies are summarized in Table 1. Among these studies, a total of 1380 GC patients ranging from 71 to 639 patients per study were reported to have been evaluated for the effect of PRL-3 expression on OS. The individual HRs of the included studies were calculated by one of the three methods reported in the “Data extraction” section. Three studies reported data from which the estimated HR can be directly retrieved [25], [26], [30]. For all other studies, HR had to be extrapolated from the survival curve [27]–[29]. Four out of six studies identified PRL-3 overexpression as an indicator of poor prognosis [25], [26], [28], [30], and all other studies showed no statistically significant effect of PRL-3 overexpression on survival period [27], [29]. According to the quality criteria, all studies were high quality. All included studies were retrospective cohort studies. Laboratory procedures for PRL-3 determination were reported in sufficient detail in all studies. For five reports, data on the association of PRL-3 and age, sex, and tumor stage can be obtained from published information; for four studies, information on the correlation of PRL-3 with tumor differentiation, depth of invasion, vascular invasion and lymph node metastasis can be extracted from the published articles. Five of the eligible studies clearly stated that PRL-3 determinations were blinded to outcomes [25]–[28], [30]. Information on the specified cutoff (5% or at least moderate staining) can be obtained in all enrolled studies.
Figure 1. Flow diagram for study selection and specific reasons for exclusion in the meta-analysis.
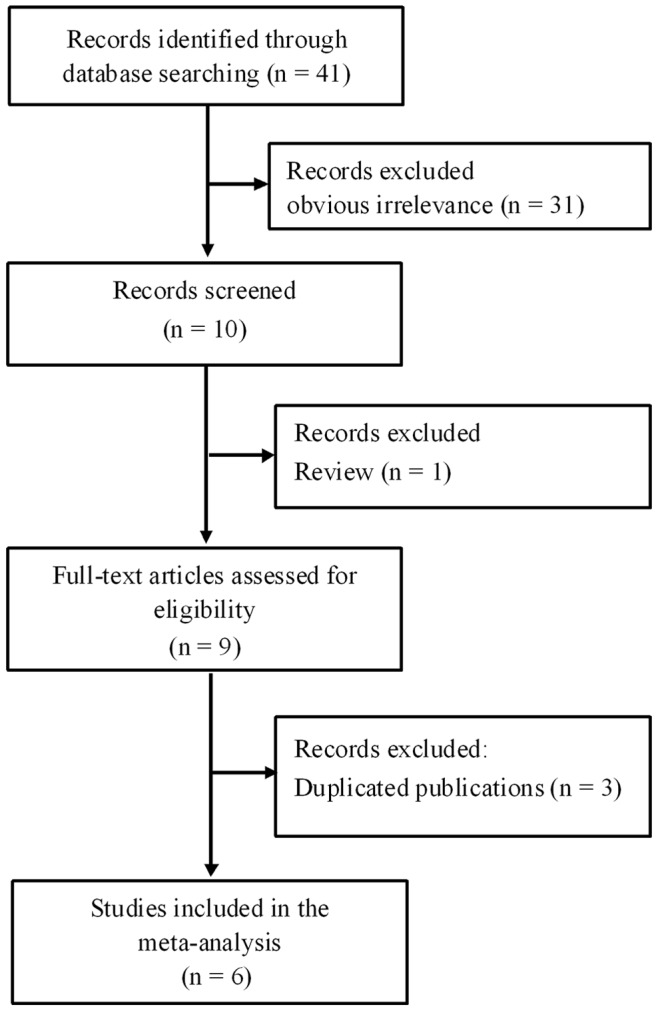
Table 1. Main characteristic of 6 eligible studies enrolled in this meta-analysis.
| Study (authors-year) | Patients source | Ethnicity | Recruitment time | No. of Patients | follow up (month) | PRL-3 expression (High/Low) | Analysis method | Blinding evaluation | Cutoff scores | Analysis of variance | HR estimation | Prognostic value | Quality score |
| Li ZR [25] (2007) | China | Asian | 1994–2004 | 639 | 2–140 | 450/189 | IHC | Yes | >5% | Multivariate | 1.24(1.02–1.49)a | Poor | 6 |
| Miskad UA [27] (2007) | Japan | Asian | NR | 94 | 0–52 | 34/60 | ISH | Yes | >25% | Univariate | 2.17(0.92–5.13)b | NS | 5 |
| Dai N [28] (2009) | China | Asian | 1994.7–2000.12 | 293 | 0–122 | 127/166 | IHC | Yes | >5% | Univariate | 2.14(1.57–2.82)b | Poor | 7 |
| Ooki A [26] (2009) | Japan | Asian | 1999–2003 | 173 | 0–60 | 95/78 | IHC | Yes | Score≥2 | Multivariate | 2.74(1.53–4.90)a | Poor | 6 |
| Pryczynicz A [29] (2010) | Poland | Caucasian | NR | 71 | 0–85 | 30/41 | IHC | NR | >5% | Univariate | 1.74(0.94–3.20)b | NS | 5 |
| Bilici A [30] (2012) | Turkey | Caucasian | 2006.12–2009.10 | 110 | 3.5–58 | 79/31 | IHC | Yes | Score≥2 | Multivariate | 2.25(1.32–3.84)a | Poor | 6 |
NR data were not reported, NS not significant, ISH in situ hybridization, IHC immunohistochemistry,
directly extracted from original data,
extrapolated from survival curve.
Correlation of PRL-3 with Clinicopathological Parameters
The associations of PRL-3 with clinicopathological characteristics were illustrated in Table 2 and Figure S1, S2, S3, S4, S5, S6, S7, S8, S9. Relationships existed between putative PRL-3 and biologically aggressive phenotypes such as tumor stage (pooled OR = 2.25; 95% CI = 1.63–3.12; P<0.001, fixed effect), depth of invasion (pooled OR = 2.03; 95% CI = 1.38–2.98; P<0.001, fixed effect), vascular invasion (pooled OR = 2.52; 95% CI = 1.79–3.56; P<0.001, fixed effect), lymphatic invasion (pooled OR = 3.74; 95% CI = 2.49–5.63; P<0.001, fixed effect), and lymph node metastasis (pooled OR = 4.56; 95% CI = 2.37–8.76; P<0.001, random effect). These findings suggested that PRL-3 overexpression was obviously associated with tumor stage, extent of invasion, and lymph node metastasis. However, no association existed between PRL-3 and other clinicopathological parameters such as age (pooled OR = 0.88; 95% CI = 0.55–1.38; P = 0.566, random effect), sex (pooled OR = 1.18; 95% CI = 0.86–1.62; P = 0.306, fixed effect), tumor size (pooled OR = 1.61; 95% CI = 0.76–3.42; P = 0.217, random effect), and tumor differentiation (pooled OR = 1.12; 95% CI = 0.81–1.55; P = 0.496, fixed effect).
Table 2. Meta-analysis of PRL-3 overexpression and clinicopathological features in gastric cancer patients.
| Categories | Studies (patients) | OR (95% CI) | I 2 (%) | P h | Z | P |
| Age | 5(741) | 0.88(0.55–1.38) | 50.0 | 0.092 | 0.57 | 0.566 |
| Sex | 5(741) | 1.18(0.86–1.62)F | 30.0 | 0.221 | 1.02 | 0.306 |
| Tumor size | 3(497) | 1.61(0.76–3.42) | 68.0 | 0.044 | 1.24 | 0.217 |
| Tumor differentiation | 4(647) | 1.12(0.81–1.55)F | 50.5 | 0.109 | 0.68 | 0.496 |
| Tumor stage | 5(741) | 2.25(1.63–3.12)F | 43.8 | 0.130 | 4.92 | <0.001 |
| Depth of invasion | 4(631) | 2.03(1.38–2.98)F | 0.0 | 0.840 | 3.59 | <0.001 |
| Vascular invasion | 4(670) | 2.52(1.79–3.56)F | 43.8 | 0.149 | 5.29 | <0.001 |
| Lymphatic invasion | 3(560) | 3.74(2.49–5.63)F | 17.7 | 0.293 | 6.33 | <0.001 |
| Lymph node metastasis | 4(670) | 4.56(2.37–8.76) | 67.9 | 0.025 | 4.56 | <0.001 |
All pooled OR s were derived from random-effect model except for cells marked with (fixedF).
P h P-value for heterogeneity based on Q test.
P P-value for statistical significance based on Z test.
Correlation of PRL-3 with Survival
We also carried out a meta-analysis on the association of PRL-3 overexpression in GC patients with OS. The pooled HRs along with their 95% CI were presented in detail in Table 3. A poor prognosis was demonstrated in the overall HR estimate (pooled HR = 1.89; 95% CI = 1.38–2.60; Z = 3.95; P<0.001, random effect), although a significant degree of heterogeneity (I 2 = 69.4%, P h = 0.006) was present. Further analysis was performed on data stratified by variance analysis to determine possible factors that may have influenced the results. Results showed that poor prognosis was found in GC patients with PRL-3 overexpression under multivariate analyses (pooled HR = 1.87; 95% CI = 1.08–3.23; Z = 2.23; P = 0.026, random effect) and univariate analyses (pooled HR = 2.07; 95% CI = 1.61–2.66; Z = 5.64; P<0.001, random effect). When subgrouped by ethnicity, unfavorable survival results were observed in patients from Asian populations (pooled HR = 1.88; 95% CI = 1.23–2.88; Z = 2.92; P = 0.004, random effect) and Caucasian populations (pooled HR = 2.01; 95% CI = 1.35–3.01; Z = 3.41; P<0.001, random effect). After exclusion of the study without blinded evaluation [29], the pooled HR was 1.94 (95% CI = 1.34–2.79; Z = 3.54; P<0.001, random effect); after omission of the study [27] using in situ hybridization not immunohistochemistry analysis yielded a pooled result of 1.87 (95% CI = 1.33–2.65; Z = 3.57; P<0.001, random effect). Furthermore, a prognostic effect on survival was also observed in the three largest studies [25], [26], [28]. Results did not change when cutoff values were considered. The forest plot for the overall association of PRL-3 overexpression with OS in GC patients was shown in Figure 2.
Table 3. Meta-analysis of PRL-3 overexpression and prognosis in gastric cancer patients.
| Categories | Studies(patients) | HR (95% CI) | I 2 (%) | P h | Z | P |
| Overallsurvival | 6(1380) | 1.89(1.38,2.60) | 69.4 | 0.006 | 3.95 | <0.001 |
| Multivariateanalyses | 3(922) | 1.87(1.08,3.23) | 79.6 | 0.002 | 2.23 | 0.026 |
| Univariateanalyses | 3(458) | 2.07(1.61,2.66) | 60.9 | 0.008 | 5.64 | <0.001 |
| Asian | 4(1199) | 1.88(1.23,2.88) | 79.2 | 0.002 | 2.92 | 0.004 |
| Caucasian | 2(181) | 2.01(1.35,3.01) | 67.0 | 0.009 | 3.41 | <0.001 |
| IHCanalysis | 5(1286) | 1.87(1.33,2.65) | 74.7 | 0.003 | 3.57 | <0.001 |
| Statedblinding | 5(1309) | 1.94(1.34,2.79) | 75.4 | 0.003 | 3.54 | <0.001 |
| Largeststudies | 3(1105) | 1.84(1.14–2.99) | 85.5 | 0.010 | 2.49 | 0.013 |
| Cutoffvalue >5% | 3(1003) | 1.63(1.08–2.47) | 79.7 | 0.007 | 2.31 | 0.021 |
All pooled HR s were derived from random-effect model.
P h P-value for heterogeneity based on Q test.
P P-value for statistical significance based on Z test.
Figure 2. The forest plot for the overall association between PRL-3 overexpression and OS of GC patients.

The contribution of each study to the meta-analysis (its weight) is represented by the area of a box, the center of which represents the size of the HR estimated from that study. The 95% CI for the HR (extending lines) from each study is also shown. The pooled HR is shown in the middle of a diamond, the left and right extremes of which represent the corresponding CI.
Sensitivity Analysis and Publication Bias
In the sensitivity analysis, the influence of each study on the pooled HR was examined by repeating the meta-analysis while omitting each study one at a time. Figure 3 demonstrated that no point estimate of the omitted individual study lied outside the 95% CI of the combined analysis on the summary OS. These analyses suggested that no individual study dominated the results in the meta-analysis, which validated the credibility of outcomes.
Figure 3. Effect of individual studies on the pooled HR for PRL-3 overexpression and OS of GC patients.

The vertical axis at 1.89 indicates the overall HR, and the two vertical axes at 1.38 and 2.60 indicate the 95% CI. Every hollow round indicates the pooled HR when the left study was omitted in a meta-analysis with a random model. The two ends of every broken line represent the respective 95% CI.
Publication bias was analyzed in the included literature involving the overall HR estimation of OS. No obvious publication bias was detected in either Begg’s test (Z = 0.00; P = 1.000) or the Egger’s tests (t = 2.10; P = 0.103; 95% CI = −0.78–5.64). The shapes of the funnel plots also showed that the included studies did not have apparent asymmetry, thereby indicating that our results were statistically robust.
Discussion and Conclusion
Since PRL-3 protein was firstly determined to play a key role in tumor metastatic process, the biological functions of this protein have been extensively studied by in vitro experiments and in vivo analyses. Moreover, PRL-3 expression is reportedly a potential prognostic factor in different types of cancer, including colorectal [31], ovarian [32], hepatocellular [33], nasopharyngeal [34], and breast [35] cancers.
The relationship between GC prognosis and PRL-3 expression has also attracted considerable attention. Li et al. [25] reported that individuals with highly expressed PRL-3 have a significantly shorter survival than individuals with no or low expression genotype. However, some researchers such as Miskad et al. [27] and Pryczynicz et al. [29] failed to demonstrate any relationship between PRL-3 overexpression and survival in GC patients. These controversies in the predictive significance of the PRL-3 phenotype in GC warrant a quantitative meta-analysis of the study outcomes.
To our knowledge, the present meta-analysis is the first study to systematically elucidate the association of PRL-3 expression with OS and clinicopathological characteristics of GC. Results showed that PRL-3 overexpression was significantly associated with OS, indicating that PRL-3 may be a marker for poor prognosis of GC. All subgroup analyses and sensitivity analyses identified the prognostic role of PRL-3 overexpression in GC patients. Notably, when the analysis was restricted to multivariate analyses, a statistically significant unfavorable effect of PRL-3 overexpression on OS was observed. Thus, PRL-3 expression may be an independent factor for OS. Furthermore, significant correlations were observed between PRL-3 overexpression and clinicopathological features, including tumor stage, depth of invasion, vascular invasion, lymphatic invasion, and lymph node metastasis, which revealed that PRL-3 may facilitate invasion and metastasis. Begg’s test, Egger’s test, and funnel plot revealed no publication bias in our analysis. Regarding quality assessment, all included studies in the meta-analysis were high quality (quality scores ≥5). Thus, the results are encouraging and may provide further basis for the development of new markers for GC prognosis and of PRL-3 inhibitors for individualized therapy.
However, the results should be interpreted very cautiously. In this review, the test for heterogeneity of the included studies was significant. Although we used subgroup analyses by variance analysis, ethnicity, PRL-3 measurements, blinded evaluation, and the number of patients during pooling data, all stratified analyses did not identify the source of heterogeneity. Moreover, sensitivity analysis did not help clarify the source of heterogeneity in this study. Therefore, multidimensional network meta-analysis models for published survival curves can be established to explain systematic heterogeneity across studies and to reduce inconsistencies [36].
Although the present meta-analysis had some advantages over other individual studies, a few limitations were also inherent. First was our inability to explore the potential effect of confounding factors, such as tumor location and different treatment regimens, because of insufficient information in the included studies. Second, the studies included in the meta-analysis were from different sources of PRL-3 antibody and dilutions of the antibodies, indicating a possibility that antibody factors can confound the results. Third, differences in the cutoff definition of PRL-3 overexpression and the experimental processes may partly influence the significance of the clinicopathological outcome in survival analyses and partially account for the inter-study heterogeneity. The fourth and last limitation is related to the approach of the HRs and 95% CI estimations. In the meta-analysis, HRs and 95% CI were directly extracted from original data in three included studies. For all other studies, HR had to be extrapolated from the survival curve. Thus, the estimated HR may be less reliable than when directly obtained from published statistics [37]. Meanwhile, we compared our estimated HRs and their statistical significance with the results reported in papers and did not identify any major deviation.
We hereby make the following recommendations to future studies: 1) a large series of consecutive patients from a single cohort, 2) sufficient long-term follow-up, 3) usage of monoclonal instead of polyclonal antibody directed against PRL-3 for immunostaining, 4) uniform standard for assessment overexpression, 5) complete description of the clinical characteristics of a study population, 6) presentation of results as survival curves and as a multivariate Cox proportional hazard model, and 7) complete description of survival events to time. Moreover, further studies should include more homogeneous populations and be prospective.
In summary, this meta-analysis revealed that PRL-3 overexpression was significantly associated with poor OS and clinicopathological features in GC. PRL-3 expression may be a predicative factor of poor prognosis and aggressive tumor behavior in GC patients.
Supporting Information
The forest plot for the overall association between PRL-3 overexpression and age in GC patients. The contribution of each study to the meta-analysis (its weight) is represented by the area of a box, the center of which represents the size of the OR estimated from that study. The 95% CI for the OR (extending lines) from each study is also shown. The pooled OR is shown in the middle of a diamond, the left and right extremes of which represent the corresponding CI.
(TIF)
The forest plot for the overall association between PRL-3 overexpression and sex of GC patients. The contribution of each study to the meta-analysis (its weight) is represented by the area of a box, the center of which represents the size of the OR estimated from that study. The 95% CI for the OR (extending lines) from each study is also shown. The pooled OR is shown in the middle of a diamond, the left and right extremes of which represent the corresponding CI.
(TIF)
The forest plot for the overall association between PRL-3 overexpression and tumor size of GC patients. The contribution of each study to the meta-analysis (its weight) is represented by the area of a box, the center of which represents the size of the OR estimated from that study. The 95% CI for the OR (extending lines) from each study is also shown. The pooled OR is shown in the middle of a diamond, the left and right extremes of which represent the corresponding CI.
(TIF)
The forest plot for the overall association between PRL-3 overexpression and tumor differentiation of GC patients. The contribution of each study to the meta-analysis (its weight) is represented by the area of a box, the center of which represents the size of the OR estimated from that study. The 95% CI for the OR (extending lines) from each study is also shown. The pooled OR is shown in the middle of a diamond, the left and right extremes of which represent the corresponding CI.
(TIF)
The forest plot for the overall association between PRL-3 overexpression and tumor stage of GC patients. The contribution of each study to the meta-analysis (its weight) is represented by the area of a box, the center of which represents the size of the OR estimated from that study. The 95% CI for the OR (extending lines) from each study is also shown. The pooled OR is shown in the middle of a diamond, the left and right extremes of which represent the corresponding CI.
(TIF)
The forest plot for the overall association between PRL-3 overexpression and depth of invasion of GC patients. The contribution of each study to the meta-analysis (its weight) is represented by the area of a box, the center of which represents the size of the OR estimated from that study. The 95% CI for the OR (extending lines) from each study is also shown. The pooled OR is shown in the middle of a diamond, the left and right extremes of which represent the corresponding CI.
(TIF)
The forest plot for the overall association between PRL-3 overexpression and vascular invasion of GC patients. The contribution of each study to the meta-analysis (its weight) is represented by the area of a box, the center of which represents the size of the OR estimated from that study. The 95% CI for the OR (extending lines) from each study is also shown. The pooled OR is shown in the middle of a diamond, the left and right extremes of which represent the corresponding CI.
(TIF)
The forest plot for the overall association between PRL-3 overexpression and lymphatic invasion of GC patients. The contribution of each study to the meta-analysis (its weight) is represented by the area of a box, the center of which represents the size of the OR estimated from that study. The 95% CI for the OR (extending lines) from each study is also shown. The pooled OR is shown in the middle of a diamond, the left and right extremes of which represent the corresponding CI.
(TIF)
The forest plot for the overall association between PRL-3 overexpression and lymph node metastasis of GC patients. The contribution of each study to the meta-analysis (its weight) is represented by the area of a box, the center of which represents the size of the OR estimated from that study. The 95% CI for the OR (extending lines) from each study is also shown. The pooled OR is shown in the middle of a diamond, the left and right extremes of which represent the corresponding CI.
(TIF)
Prisma checklist.
(DOC)
Acknowledgments
The authors thank Wenkai Chen at the library of Guangdong Medical College for literature searches.
Funding Statement
This study was supported by Guangdong Medical College Leading Academic Discipline Project (Project No. XZ1105) and Guangdong Natural Science Foundation (Grant No. S2011010004146). The funders had no role in study design, data collection and analysis, decision to publish, or preparation of the manuscript.
References
- 1. Jemal A, Bray F (2011) Center MM, Ferlay J, Ward E, et al (2011) Global cancer statistics. CA Cancer J Clin 61: 69–90. [DOI] [PubMed] [Google Scholar]
- 2. de Martel C, Ferlay J, Franceschi S, Vignat J, Bray F, et al. (2012) Global burden of cancers attributable to infections in 2008: a review and synthetic analysis. Lancet Oncol 13: 607–615. [DOI] [PubMed] [Google Scholar]
- 3. Lim SS, Vos T, Flaxman AD, Danaei G, Shibuya K, et al. (2012) A comparative risk assessment of burden of disease and injury attributable to 67 risk factors and risk factor clusters in 21 regions, 1990–2010: a systematic analysis for the Global Burden of Disease Study 2010. Lancet 380: 2224–2260. [DOI] [PMC free article] [PubMed] [Google Scholar]
- 4.Hashimoto K, Aoyagi K, Isobe T, Kouhuji K, Shirouzu K (2013) Expression of CD133 in the cytoplasm is associated with cancer progression and poor prognosis in gastric cancer. Gastric Cancer. [DOI] [PMC free article] [PubMed]
- 5. Shin NR, Jeong EH, Choi CI, Moon HJ, Kwon CH, et al. (2012) Overexpression of Snail is associated with lymph node metastasis and poor prognosis in patients with gastric cancer. BMC Cancer 12: 521. [DOI] [PMC free article] [PubMed] [Google Scholar]
- 6. Neves Filho EH, Cordeiro DE, Vieira AP, Rabenhorst SH (2012) TP53 codon 72 and intron 3 polymorphisms and mutational status in gastric cancer: an association with tumor onset and prognosis. Pathobiology 79: 323–328. [DOI] [PubMed] [Google Scholar]
- 7. Woo S, Lee BL, Yoon J, Cho SJ, Baik TK, et al. (2011) Constitutive activation of signal transducers and activators of transcription 3 correlates with better prognosis, cell proliferation and hypoxia-inducible factor-1alpha in human gastric cancer. Pathobiology 78: 295–301. [DOI] [PubMed] [Google Scholar]
- 8. Scott LM, Lawrence HR, Sebti SM, Lawrence NJ, Wu J (2010) Targeting protein tyrosine phosphatases for anticancer drug discovery. Curr Pharm Des 16: 1843–1862. [DOI] [PMC free article] [PubMed] [Google Scholar]
- 9. Kozlov G, Cheng J, Ziomek E, Banville D, Gehring K, et al. (2004) Structural insights into molecular function of the metastasis-associated phosphatase PRL-3. J Biol Chem 279: 11882–11889. [DOI] [PubMed] [Google Scholar]
- 10. Saha S, Bardelli A, Buckhaults P, Velculescu VE, Rago C, et al. (2001) A phosphatase associated with metastasis of colorectal cancer. Science 294: 1343–1346. [DOI] [PubMed] [Google Scholar]
- 11. Wang H, Vardy LA, Tan CP, Loo JM, Guo K, et al. (2010) PCBP1 suppresses the translation of metastasis-associated PRL-3 phosphatase. Cancer Cell 18: 52–62. [DOI] [PubMed] [Google Scholar]
- 12. Bardelli A, Saha S, Sager JA, Romans KE, Xin B, et al. (2003) PRL-3 expression in metastatic cancers. Clin Cancer Res 9: 5607–5615. [PubMed] [Google Scholar]
- 13. Al-Aidaroos AQ, Zeng Q (2010) PRL-3 phosphatase and cancer metastasis. J Cell Biochem 111: 1087–1098. [DOI] [PubMed] [Google Scholar]
- 14. Bessette DC, Qiu D, Pallen CJ (2008) PRL PTPs: mediators and markers of cancer progression. Cancer Metastasis Rev 27: 231–252. [DOI] [PubMed] [Google Scholar]
- 15. Guzinska-Ustymowicz K, Pryczynicz A (2011) PRL-3, an emerging marker of carcinogenesis, is strongly associated with poor prognosis. Anticancer Agents Med Chem 11: 99–108. [DOI] [PubMed] [Google Scholar]
- 16. Parmar MK, Torri V, Stewart L (1998) Extracting summary statistics to perform meta-analyses of the published literature for survival endpoints. Stat Med 17: 2815–2834. [DOI] [PubMed] [Google Scholar]
- 17. Maxwell L, Santesso N, Tugwell PS, Wells GA, Judd M, et al. (2006) Method guidelines for Cochrane Musculoskeletal Group systematic reviews. J Rheumatol 33: 2304–2311. [PubMed] [Google Scholar]
- 18.Wells GA, Shea B, O’Connell D, Peterson J, Welch V, et al.. (2012) The Newcastle-Ottawa Scale (NOS) for assessing the quality of nonrandomised studies in meta-analyses, Ottawa Health Research Institute Web site.
- 19. Higgins JP, Thompson SG, Deeks JJ, Altman DG (2003) Measuring inconsistency in meta-analyses. BMJ 327: 557–560. [DOI] [PMC free article] [PubMed] [Google Scholar]
- 20. Mantel N, Haenszel W (1959) Statistical aspects of the analysis of data from retrospective studies of disease. J Natl Cancer Inst 22: 719–748. [PubMed] [Google Scholar]
- 21. Egger M, Davey SG, Schneider M, Minder C (1997) Bias in meta-analysis detected by a simple, graphical test. BMJ 315: 629–634. [DOI] [PMC free article] [PubMed] [Google Scholar]
- 22. Wang Z, Cai SR, He YL, Zhan WH, Zhang CH, et al. (2009) Elevated PRL-3 expression was more frequently detected in the large primary gastric cancer and exhibits a poor prognostic impact on the patients. J Cancer Res Clin Oncol 135: 1041–1046. [DOI] [PubMed] [Google Scholar]
- 23. Wang Z, Cai SR, He YL, Zhan WH, Chen CQ, et al. (2009) High expression of PRL-3 can promote growth of gastric cancer and exhibits a poor prognostic impact on patients. Ann Surg Oncol 16: 208–219. [DOI] [PubMed] [Google Scholar]
- 24. Ooki A, Yamashita K, Kikuchi S, Sakuramoto S, Katada N, et al. (2011) Therapeutic potential of PRL-3 targeting and clinical significance of PRL-3 genomic amplification in gastric cancer. BMC Cancer 11: 122. [DOI] [PMC free article] [PubMed] [Google Scholar]
- 25. Li ZR, Wang Z, Zhu BH, He YL, Peng JS, et al. (2007) Association of tyrosine PRL-3 phosphatase protein expression with peritoneal metastasis of gastric carcinoma and prognosis. Surg Today 37: 646–651. [DOI] [PubMed] [Google Scholar]
- 26. Ooki A, Yamashita K, Kikuchi S, Sakuramoto S, Katada N, et al. (2009) Phosphatase of regenerating liver-3 as a prognostic biomarker in histologically node-negative gastric cancer. Oncol Rep 21: 1467–1475. [DOI] [PubMed] [Google Scholar]
- 27. Miskad UA, Semba S, Kato H, Matsukawa Y, Kodama Y, et al. (2007) High PRL-3 expression in human gastric cancer is a marker of metastasis and grades of malignancies: an in situ hybridization study. Virchows Arch 450: 303–310. [DOI] [PubMed] [Google Scholar]
- 28. Dai N, Lu AP, Shou CC, Li JY (2009) Expression of phosphatase regenerating liver 3 is an independent prognostic indicator for gastric cancer. World J Gastroenterol 15: 1499–1505. [DOI] [PMC free article] [PubMed] [Google Scholar]
- 29. Pryczynicz A, Guzinska-Ustymowicz K, Chang XJ, Kisluk J, Kemona A (2010) PTP4A3 (PRL-3) expression correlate with lymphatic metastases in gastric cancer. Folia Histochem Cytobiol 48: 632–636. [DOI] [PubMed] [Google Scholar]
- 30. Bilici A, Ustaalioglu BB, Yavuzer D, Seker M, Mayadagli A, et al. (2012) Prognostic significance of high phosphatase of regenerating liver-3 expression in patients with gastric cancer who underwent curative gastrectomy. Dig Dis Sci 57: 1568–1575. [DOI] [PubMed] [Google Scholar]
- 31. Mollevi DG, Aytes A, Padulles L, Martinez-Iniesta M, Baixeras N, et al. (2008) PRL-3 is essentially overexpressed in primary colorectal tumours and associates with tumour aggressiveness. Br J Cancer 99: 1718–1725. [DOI] [PMC free article] [PubMed] [Google Scholar]
- 32. Reich R, Hadar S, Davidson B (2011) Expression and clinical role of protein of regenerating liver (PRL) phosphatases in ovarian carcinoma. Int J Mol Sci 12: 1133–1145. [DOI] [PMC free article] [PubMed] [Google Scholar]
- 33. Mayinuer A, Yasen M, Mogushi K, Obulhasim G, Xieraili M, et al. (2013) Upregulation of protein tyrosine phosphatase type IVA member 3 (PTP4A3/PRL-3) is associated with tumor differentiation and a poor prognosis in human hepatocellular carcinoma. Ann Surg Oncol 20: 305–317. [DOI] [PMC free article] [PubMed] [Google Scholar]
- 34. Zhou J, Wang S, Lu J, Li J, Ding Y (2009) Over-expression of phosphatase of regenerating liver-3 correlates with tumor progression and poor prognosis in nasopharyngeal carcinoma. Int J Cancer 124: 1879–1886. [DOI] [PubMed] [Google Scholar]
- 35. Wang L, Peng L, Dong B, Kong L, Meng L, et al. (2006) Overexpression of phosphatase of regenerating liver-3 in breast cancer: association with a poor clinical outcome. Ann Oncol 17: 1517–1522. [DOI] [PubMed] [Google Scholar]
- 36. Jansen JP, Cope S (2012) Meta-regression models to address heterogeneity and inconsistency in network meta-analysis of survival outcomes. BMC Med Res Methodol 12: 152. [DOI] [PMC free article] [PubMed] [Google Scholar]
- 37. Tierney JF, Stewart LA, Ghersi D, Burdett S, Sydes MR (2007) Practical methods for incorporating summary time-to-event data into meta-analysis. Trials 8: 16. [DOI] [PMC free article] [PubMed] [Google Scholar]
Associated Data
This section collects any data citations, data availability statements, or supplementary materials included in this article.
Supplementary Materials
The forest plot for the overall association between PRL-3 overexpression and age in GC patients. The contribution of each study to the meta-analysis (its weight) is represented by the area of a box, the center of which represents the size of the OR estimated from that study. The 95% CI for the OR (extending lines) from each study is also shown. The pooled OR is shown in the middle of a diamond, the left and right extremes of which represent the corresponding CI.
(TIF)
The forest plot for the overall association between PRL-3 overexpression and sex of GC patients. The contribution of each study to the meta-analysis (its weight) is represented by the area of a box, the center of which represents the size of the OR estimated from that study. The 95% CI for the OR (extending lines) from each study is also shown. The pooled OR is shown in the middle of a diamond, the left and right extremes of which represent the corresponding CI.
(TIF)
The forest plot for the overall association between PRL-3 overexpression and tumor size of GC patients. The contribution of each study to the meta-analysis (its weight) is represented by the area of a box, the center of which represents the size of the OR estimated from that study. The 95% CI for the OR (extending lines) from each study is also shown. The pooled OR is shown in the middle of a diamond, the left and right extremes of which represent the corresponding CI.
(TIF)
The forest plot for the overall association between PRL-3 overexpression and tumor differentiation of GC patients. The contribution of each study to the meta-analysis (its weight) is represented by the area of a box, the center of which represents the size of the OR estimated from that study. The 95% CI for the OR (extending lines) from each study is also shown. The pooled OR is shown in the middle of a diamond, the left and right extremes of which represent the corresponding CI.
(TIF)
The forest plot for the overall association between PRL-3 overexpression and tumor stage of GC patients. The contribution of each study to the meta-analysis (its weight) is represented by the area of a box, the center of which represents the size of the OR estimated from that study. The 95% CI for the OR (extending lines) from each study is also shown. The pooled OR is shown in the middle of a diamond, the left and right extremes of which represent the corresponding CI.
(TIF)
The forest plot for the overall association between PRL-3 overexpression and depth of invasion of GC patients. The contribution of each study to the meta-analysis (its weight) is represented by the area of a box, the center of which represents the size of the OR estimated from that study. The 95% CI for the OR (extending lines) from each study is also shown. The pooled OR is shown in the middle of a diamond, the left and right extremes of which represent the corresponding CI.
(TIF)
The forest plot for the overall association between PRL-3 overexpression and vascular invasion of GC patients. The contribution of each study to the meta-analysis (its weight) is represented by the area of a box, the center of which represents the size of the OR estimated from that study. The 95% CI for the OR (extending lines) from each study is also shown. The pooled OR is shown in the middle of a diamond, the left and right extremes of which represent the corresponding CI.
(TIF)
The forest plot for the overall association between PRL-3 overexpression and lymphatic invasion of GC patients. The contribution of each study to the meta-analysis (its weight) is represented by the area of a box, the center of which represents the size of the OR estimated from that study. The 95% CI for the OR (extending lines) from each study is also shown. The pooled OR is shown in the middle of a diamond, the left and right extremes of which represent the corresponding CI.
(TIF)
The forest plot for the overall association between PRL-3 overexpression and lymph node metastasis of GC patients. The contribution of each study to the meta-analysis (its weight) is represented by the area of a box, the center of which represents the size of the OR estimated from that study. The 95% CI for the OR (extending lines) from each study is also shown. The pooled OR is shown in the middle of a diamond, the left and right extremes of which represent the corresponding CI.
(TIF)
Prisma checklist.
(DOC)