

Abstract
Cytochrome P450 aromatase (CYP19A1) is the only enzyme known to catalyze the biosynthesis of estrogens from androgens. The crystal structure of human placental aromatase (pArom) has paved the way toward understanding the structure–function relationships of this remarkable enzyme. Using an amino terminus-truncated recombinant human aromatase (rArom) construct, we investigate the roles of key amino acids in the active site, at the intermolecular interface, inside the access channel, and at the lipid–protein boundary for their roles in enzyme function and higher-order organization. Replacing the active site residue D309 with an N yields an inactive enzyme, consistent with its proposed involvement in aromatization. Mutation of R192 at the lipid interface, pivotal to the proton relay network in the access channel, results in the loss of enzyme activity. In addition to the distal catalytic residues, we show that mutation of K440 and Y361 of the heme-proximal region critically interferes with substrate binding, enzyme activity, and heme stability. The D–E loop deletion mutant Del7 that disrupts the intermolecular interaction significantly reduces enzyme activity. However, the less drastic Del4 and point mutants E181A and E181K do not. Furthermore, native gel electrophoresis, size-exclusion chromatography, and analytical ultracentrifugation are used to show that mutations in the intermolecular interface alter the quaternary organization of the enzyme in solution. As a validation for interpretation of the mutational results in the context of the innate molecule, we determine the crystal structure of rArom to show that the active site, tertiary, and quaternary structures are identical to those of pArom.
Human aromatase (Arom, 503 amino acids), an integral membrane hemeprotein of the endoplasmic reticulum, exhibits high substrate specificity in catalyzing the synthesis of estrogens from androgen precursors. The enzyme has been a subject of biochemical and biophysical investigations for the past 35 years. Nevertheless, many aspects of the catalyzed reaction remain poorly understood. The crystal structure of placental aromatase (pArom)1–4 has revealed key aspects regarding the properties of Arom. However, without a recombinant, active enzyme that can be manipulated by site-directed mutagenesis, it is not possible to fully explore the molecular basis for catalysis, higher-order organization, and coupling to cytochrome P450 reductase (CPR). Although many laboratories to date recombinantly expressed and purified modified human Arom from various sources,5–13 none yielded them in sufficient quality and/or quantity to be crystallized. Furthermore, mutagenesis studies in the past were mostly conducted in whole cells,11,12,14,15 and a few in the purified enzyme.9,16,17 Unambiguous assignment of the functional roles was not possible because these studies were performed prior to the elucidation of the pArom structure.8,17–19 Determination of the crystal structure of a recombinant Arom and cross-validation of the integrity of its tertiary fold and the active site structure against the native X-ray structure of human placental enzyme are crucial to the validity of mutational data.
Here, we use an N terminus-truncated recombinant human Arom (rArom) to investigate the roles of key amino acids in the active site, inside the access channel, and at the intermolecular interface.1–3 All of these residues were implicated in the structural studies.1–3 Catalytic amino acids at the heme distal site are in the immediate vicinity of the bound steroid and may directly participate in the reaction mechanism.1 The amino acids at the active site access channel1 are possibly responsible for the passage of water and steroid, as well as proton flow. Additionally, functional roles of the residues at the intermolecular interface, a coupling of two neighboring molecules via the heme-proximal cavity, and the oligomeric state of the enzyme are probed by systematic mutations. Lastly, we show that rArom has pArom-like structure and properties, permitting interpretation of the mutational results in the context of the innate molecule.
MATERIALS AND METHODS
General
[1β-3H,4-14C]Androstenedione (ASD) was purchased from Perkin-Elmer (Waltham, MA). n-Dodecyl β-D-maltopyranoside (BDM) was purchased from Affymetrix (Cleveland, OH). All columns used for purification were purchased from GE Healthcare Life Sciences (Pittsburgh, PA). All other chemicals were purchased from Sigma-Aldrich (St. Louis, MO).
Buffers
The following buffers were used for the purification: (i) buffer A, which consisted of 100 mM potassium phosphate buffer (PPB, pH 7.4), 20% glycerol, 0.5 mM BDM, and 10 μM ASD, (ii) buffer A with 100 mM NaCl and 100 mM histidine, (iii) buffer A with 1 M NaCl and buffer A with 500 mM PPB (pH 7.4), and (iv) buffer A with no potassium phosphate.
Expression
The rArom construct is identical to the human pArom, except for the missing 39 amino-terminal amino acids, the 10 added hydrophilic amino-terminal residues, and 4 His residues added at the carboxy terminus, which is essentially the same as reported by others (−39 amino-terminal residues + MAKKTSSKGR + carboxy-terminal 4×His).10,18 After transformation of Escherichia coli DH5α competent cells with the pCW Ori+ plasmid containing rArom, a single colony was grown for 16 h in LB containing 100 μg/ml Ampicillin medium. A 1:100 dilution of overnight culture was used to inoculate terrific broth medium containing 100 μg/mL ampicillin. The culture was grown to an optimal optical density of 0.6–0.8 absorbance unit at 600 nm. The temperature was then decreased to 28 °C; 1 mM δ-aminolevulinic acid was added and the mixture grown for an additional 1 h. At this point, additional 100 μg/mL ampicillin and 1 mM isopropyl β-D-1-thiogalactopyranoside were added, and the protein was expressed for 48 h at 28 °C. Cells were then harvested by centrifugation methods. The medium was discarded, and the cell pellet was washed with 0.1 M PPB (pH 7.4).
Expression of Mutant rArom
D309N, R192Q, Del7, Del4, and E181A mutants were generated using the Stratagene QuikChange kit according to the manufacturer’s instructions. All primers for mutagenesis were designed utilizing the Stratagene website. The E181K mutant was generated by Retrogen, Inc. (San Diego, CA). K440Q and Y361 mutants were generated by GenScript USA Inc. (Piscataway, NJ). Growth and expression conditions were the same as those for the rArom wild type (WT).
Solubilization
A pellet was resuspended in buffer A with 1 mg/mL lysozyme and a pea-sized scoop of deoxyribonuclease (approximately 5 mg) and then the mixture was stirred at 4 °C for 30 min. After 30 min, 1% Tween 20 and 1 mM phenylmethanesulfonyl fluoride were added, and the solution was stirred for an additional 30 min. Cells were mechanically broken with a microfluidizer. A high-speed centrifugation using a Beckman Coulter Optima L-90K ultracentrifuge at 40000 rpm (185511g) was performed.
Purification
All purification procedures were conducted at 4 °C in 0.5 mM BDM to eliminate the necessity of a buffer exchange for the purpose of crystallization. The supernatant from centrifugation was collected and applied to a 5 mL Histrap column and eluted with buffer A with 100 mM histidine. Peak fractions containing 50–100 mM histidine were pooled and exchanged into buffer A to remove excess histidine and salt. The exchanged protein (rArom) was further purified via anion exchange chromatography where it was eluted in the flow-through. The flow-through was applied to a hydroxyapatite column and eluted with buffer A and 500 mM PPB. rArom peak fractions were eluted within the range of 200–500 mM PPB. The eluate was exchanged with buffer A without potassium phosphate to adjust the potassium phosphate concentration back to 100 mM. Further polishing was obtained by utilizing GF75 and S200 gel filtration columns.
UV–Visible Spectroscopy for Measuring the Soret Peaks
The protein solution was scanned over the visible range between 250 and 650 nm in a Cary50 UV–visible spectrophotometer with a 1 mL quartz cuvette and 1 cm path length. At the crystallization concentration, 1 μL of the concentrated protein solution was scanned over the visible range between 250 and 650 nm on an Implen NanoPhotometer with a 0.20 mm path length.
Measurement of Activity
Activities of rArom WT and mutants were measured using the tritiated water assay, which has been well established and previously published.20 To determine the kinetics of rArom WT and mutants, ASD concentrations were varied from 0 to 252 nM. Purified rat CPR was used for the measurement of activities. All assays were performed in quadruplicate. All experiments were performed at least twice. Analyses were conducted using Graphpad.21
Arom Activity Assay by a Competitive Enzyme-Linked Immunosorbent Assay
A convenient enzyme-linked immunosorbent assay (ELISA) that uses a 17β-estradiol (E2)-specific antibody has been modified for our assay purposes based upon a previous publication.22 The details of this assay will be reported in the future. The dependence of rArom activity on rat CPR concentration was shown utilizing this modified ELISA. The concentrations of Arom, ASD, and NADPH were fixed to 0.4 nM, 140 nM, and 0.5 mM, respectively. The concentration of rat CPR was varied from 0 to 80 nM.
Analytical Ultracentrifugation
All samples for analytical ultracentrifugation were in buffer A with 1 mM DTT. Samples ranged in concentration from 1 to 30 mg/mL and were concentrated using centricons. Analytical ultracentrifugation experiments and analyses were conducted by the Cosgrove lab at SUNY Upstate Medical University according to the methodologies previously published.23 All experiments were conducted using a Beckman Coulter ProteomeLabTM XL-A analytical ultracentrifuge equipped with absorbance optics and a four-hole An-60 Ti analytical rotor. Sedimentation velocity experiments were conducted at 10 °C and 60000 rpm (262000g) using 3 mm two-sector charcoal-filled Epon centerpieces with quartz windows. For each sample, 300 scans were collected with the time interval between scans set to 0. The data were analyzed with SEDFIT24 using the continuous distribution [c(s)] option.
Gel Electrophoresis
Polyacrylamide gel electrophoresis (PAGE) of pArom and rArom was conducted under denaturing and nondenaturing conditions. Precast 12% and 4–20% gels in Tris-HCl (Bio-Rad Laboratories, Hercules, CA) were used for denaturing and nondenaturing conditions, respectively. For denaturing conditions, the gel was run under the following conditions: 25 mM Tris base, 192 mM glycine, and 0.1% sodium dodecyl sulfate (SDS) (pH 8.3). The sample was prepared via combination with a Laemmli sample buffer containing 62.5 mM Tris-HCl (pH 6.8), 25% glycerol, 2% SDS, and 0.01% bromophenol blue. The nondenaturing gel was run under the following conditions: 25 mM Tris base, 192 mM glycine, and 0.004% SDS. Samples were combined with a loading dye containing 62.5 mM Tris base, 25% glycerol, 0.01% bromophenol blue, and 0.01% SDS. All samples were run at concentrations ranging from 0.4 to 35 mg/mL.
Native Gel Calibration
The retardation factor was determined by manually measuring the average distance from the bottom of the gel to various points on a protein band. The logarithms of the theoretical molecular masses of various oligomers were plotted against the retardation factors of the bands. All points were least-squares minimized to a straight line using different molecular mass models. The most plausible model was judged on the basis of the highest correlation coefficient of the least-squares fit lines.
Western Blotting
The purified Y361F mutant was resolved by SDS–PAGE and transferred to a nitrocellulose membrane electrophoretically. The blot was blocked in TBST [25 mM Tris (pH 7.4), 135 mM NaCl, 3 mM KCl, and 0.5% Tween 20] supplemented with 5% (w/v) nonfat milk for 30 min at room temperature and subsequently washed with TBST. The polyclonal Arom antibody (generated from antisera of rabbits injected with the immunoaffinity-purified human Arom) was diluted 1:3000 in blocking buffer and incubated with the membrane for 1.5 h, after which the membranes were then washed extensively with TBST buffer and incubated with horseradish peroxidase-linked goat anti-rabbit (GAR) IgG diluted 1:5000 in TBST supplemented with 5% (w/v) nonfat milk. After the samples had been washed three times with TBST, the immunoblot signals were visualized by colorimetric detection using the Opti-4CN Substrate Kit (Bio-Rad) following the manufacturer’s protocol.
Protein Concentration Determination
Both A393 and SDS–PAGE were used to determine the protein concentration. The benchmark for the correlation between absorbance and protein concentration was derived using the native placental enzyme. The absorbances of the native and recombinant enzymes (at the same concentration) are similar; therefore, the same method was used for protein concentration determination. The total protein as measured by Lowry and Bradford measurements was correlated to A393. On the basis of these assays, the extinction coefficient of Arom was determined to be 0.055 μM−1 cm−1. A393/A280 is approximately 1.2. Utilizing a SDS–PAGE gel with varying concentrations of bovine serum albumin as a standard, we estimated the concentration of our protein based upon the size of the band compared to the band size of the standards. The concentrations by A393 and SDS–PAGE were averaged to determine the final protein concentration.
Crystallization
On the basis of the protein concentration determined by A393 and SDS–PAGE analysis, the protein was then concentrated to 30 mg/mL and filtered with a 0.22 μm filter. Using protein:reservoir ratios of 2:1 and 3:1, rArom was mixed with crystallization cocktails containing 24–30% PEG 4000, 0.5 M NaCl, and 0.05 M Tris-HCl (pH 8.5) and vapor diffused in sealed 24-well sitting drop plates at 4 °C. Crystals appeared after 1–6 weeks of initial setup and continued to grow for an additional 2–6 weeks after their first appearance.
Diffraction Data Collection
Diffraction data set to 3.30 Å resolution were collected at beamline 19-ID (0.979 Å) of the Advanced Photon Source (Argonne National Laboratory, Argonne, IL). The crystal was flash-cooled in a stream of liquid nitrogen using ~40% glycerol as the cryoprotectant and maintained at ~100 K during data collection. The data were recorded on an ADSC Q315 CCD detector and processed with HKL3000.25
Structure Refinement
Model building and refinement were performed with Coot26 and Refmac527 routines, respectively, on an Intel quad-processor MacPro workstation running the OSX 10.5 operating system. The final model contained 452 amino acid residues, a heme group, one ASD molecule, two solvent waters, and one phosphate ion (3729 total atoms). The fit between the experimental electron density of side chains and the corresponding sequence was excellent except for a few exposed charged amino acids, such as lysine. The final R factor for all reflections was 0.216, and the Rfree value was 0.248. The root-mean-square deviations of bond lengths and angles from ideal values were 0.009 Å and 1.27°, respectively. The average isotropic thermal factor (B) for all atoms was 90.5 Å2, whereas the Wilson plot B value was 98.8 Å2. Of 407 non-glycine and non-proline residues, there were four violations in the backbone torsion angle Ramachandran plot, all in weaker loop regions. Overall, random coordinate errors were 0.37 Å (on Rfree) and 0.27 Å (on maximum likelihood). The refined coordinates and diffraction data have been deposited with the Protein Data Bank (entry 4KQ8).
Visualization and Modeling of WT and Mutant Enzymes
Molecular graphics and analyses were performed with Chimera. Chimera was developed by the Resource for Biocomputing, Visualization, and Informatics at the University of California, San Francisco (supported by National Institute of General Medical Sciences Grant P41-GM103311).28 The crystal structure of rArom was used to model the mutations generated. Chimera was also used for the preparation of structural illustrations in Figures 2, 3, 6, and 7.
Figure 2.
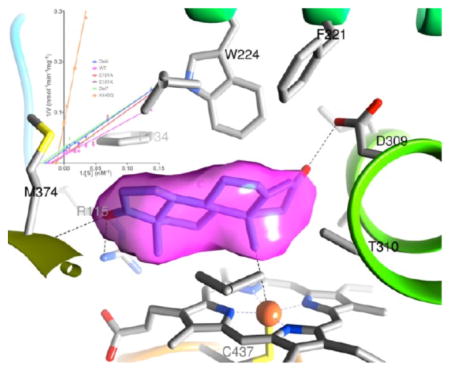
Close-up view of the active site of rArom WT at 3.3 Å resolution. An unbiased difference electron density (contoured at 4.2σ) for the bound androstenedione (ASD), prior to its inclusion in the model refinement, is colored purple. The backbone ribbon is rainbow-colored [from blue (N terminus) to red (C terminus)]. Protonated D309 makes a hydrogen bond with the 3-keto group of ASD. D309 is also linked to R192 via water. R192 forms a salt bridge with E483. These two residues sit at the mouth of the active site access channel.
Figure 3.

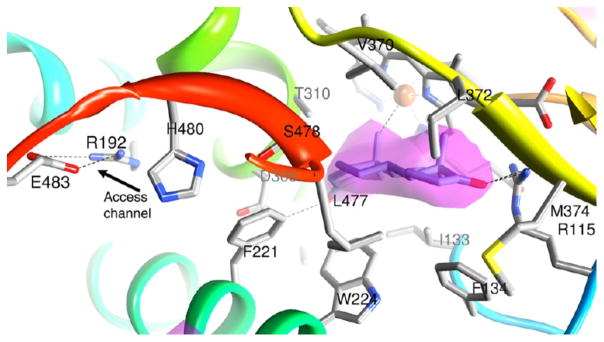
Intermolecular interaction between aromatase molecules. The D–E loop of one aromatase molecule is colored magenta and the heme-proximal region of the neighboring molecule blue. Important residues involved in interfacial interactions and/or subjects of mutational analysis are shown. Notable electrostatic and hydrogen bond formations among the side chains are indicated.
Figure 6.

Superposition of the crystal structures of pArom (cornflower blue) and rArom (lavender). The superposition establishes that the two tertiary structures are essentially identical (the root-mean-square deviation of the Cα atoms is 0.4 Å) except for some loop and terminal regions. The N-terminal residues that traverse the lipid bilayer4 are shown only for pArom and are absent in rArom. The terminal residues for the crystal structure (46 and 496) are numbered.
Figure 7.

Packing of pArom (blue) and rArom (magenta) crystals, viewed roughly along the 32 screw axis. N-Terminal transmembrane helices in the pArom structure line up about and are roughly perpendicular to the 32 symmetry axis in the space that constitutes the largest void, a channel of dynamically disordered solvent and detergent. As the intermolecular contact along this interface is nonexistent, and packing along the 32 screw axis dominates in both crystals, the deletion of 39 amino acids at the N-terminus of rArom does not change the crystal packing interactions.
RESULTS
Features of the Recombinant Enzyme
An N terminus-modified human Arom clone was generated using a cloning strategy similar to the one that allowed for crystallization of P450 2B4.29 This construct contains a deletion of the first 39 amino acids, an addition of 10 hydrophilic amino acids at the N terminus, and a 4×His tag at the C terminus, similar to others that have been previously reported.5,9 The resulting enzyme is soluble and stable in solution as evidenced by the sharp 393 nm Soret peak (Figure S1 of the Supporting Information) with an A393:A280 ratio typically in the range of 1.0–1.5. The specific activities of pArom and rArom are comparable (Table 1). Typical yields for the rArom range from 10 to 15 mg/L of medium culture, and >90% purity (Figure 1) is achieved utilizing the purification protocol listed in the Materials and Methods. The activity of rArom WT is assessed using a well-established tritiated water assay20 and an estrone-based ELISA22 adapted for Arom measurement according to our assay needs. The activities of rArom WT and pArom are determined to be 35–40 and 40–50 nmol min−1 mg−1, respectively (Table 1).1
Table 1.
Kinetics Parameters for WT and Mutant rArom
| enzyme | Soret peak type | specific activity (nmol min−1 mg−1) | % reduction in specific activity | yield (mg/L of culture) | KM (nM) | Vmax (nmol min−1 mg−1) | Kcat (min−1) | Vmax/KM |
|---|---|---|---|---|---|---|---|---|
| WT | I | 40.5 ± 0.5 | N/A | 15 | 37.6 ± 5.3 | 60.6 ± 3.0 | 3.3 | 1.6 |
| D309N | I | 0.7 ± 0.1 | 98.0 | 5 | NMb | NMb | NMb | NMb |
| R192Q | I | 4.4 ± 0.1 | 88.0 | 5 | NMb | NMb | NMb | NMb |
| Del7 | I | 12.7 ± 0.1 | 65.3 | 5 | 21.8 ± 3.5 | 29.8 ± 1.3 | 1.7 | 1.4 |
| Del4 | I | 36.0 ± 0.1 | nonea | 15 | 30 ± 5 | 57 ± 4 | 3.1 | 1.9 |
| E181A | I | 40.2 ± 0.6 | nonea | 60 | 38.1 ± 4.0 | 51.1 ± 1.9 | 2.8 | 1.3 |
| E181K | I | 41.6 ± 2.2 | nonea | 15 | 40.4 ± 4.3 | 59.6 ± 2.3 | 3.2 | 1.5 |
| K440Q | I | 5.3 ± 0.1 | 87.5 | 5 | 74.9 ± 5 | 12.1 ± 0.5 | 0.6 | 0.15 |
| Y361F | I | 0.4 ± 0.1 | 99.0 | 1 | NMb | NMb | NMb | NMb |
Because the specific activity of rArom WT over tens of purifications ranges between 35 and 45 nmol min−1 mg−1, the specific activities of these mutants are considered WT-like.
The activity is very low and not measurable with sufficient reliability, and therefore, the mutant is considered virtually inactive.
Figure 1.
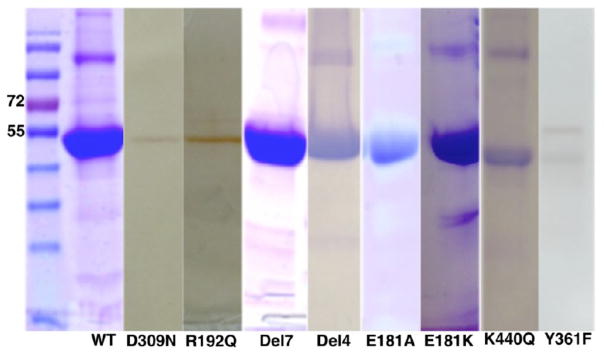
SDS–PAGE analysis of rArom WT and its mutants. The lanes, from left to right, are a composite of purified rArom WT and mutants under final or crystallization conditions (with the exception of Y361F). Western blotting was performed on Y361F because of the low yield and heterogeneity. rArom WT and other mutants were purified to homogeneity with a final yield ≥5 mg/L of cell culture (see Table 1). The amounts of protein loaded for analysis are ~2 μg for D309N, R192Q, and Y361F; ~10 μg for K440Q; and ~35 μg for WT, Del7, Del4, E181A, and E181K. Gels are either imperial blue or silver-stained.
Mutagenesis of Residues Implicated in Catalysis
D309 makes a hydrogen bond with the 3-keto moiety of the bound ASD.1 In addition to being the key residue for substrate binding (Figure 2), a protonated D309 plays a role in enzyme catalysis.1,2 Mutagenesis of D309 to asparagine removes the negative charge and prevents proton dissociation required for catalysis.1 The D309N mutation results in a soluble, stable, homogeneous, albeit inactive protein (Figure 1 and Table 1). D309 is linked to R192 by a water molecule. R192 forms a salt bridge with E483, which together are the “gatekeepers” because they line the access channel and can regulate the passage of molecules (Figure 2). Furthermore, this salt bridging pair is within the proton relay network (Figure 2), allowing for a regulatory role in catalysis.1 Mutagenesis of R192 leads to a loss of the salt bridge between R192 and E483 and hence a break in the proton network. The R192Q mutant undergoes an 88% reduction in activity relative to that of the WT (Table 1); however, it remains soluble, stable, and purifiable (Figure 1). The typical yield for both D309N and R192Q is ~4–5 mg/L, considerably smaller than that of the WT. The kinetics properties of these two mutants could not be reliably measured because of their low specific activities.
Characteristics of the Oligomeric Interface Mutants
In the crystal, Arom molecules are linked by an intermolecular association via a surface loop between helix D and helix E of one Arom molecule that penetrates the heme-proximal cavity of the neighboring molecule,3 forming a higher-order oligomeric chain. The D–E loop has an overall negative electrostatic potential (E181 and D186), whereas the heme-proximal cavity has a positive electrostatic potential (K108, K354, K420, R425, K440, and K448), suitable for docking of the negatively charged FMN-binding domain of CPR. For dimer formation, the D–E loop consisting of residues V178, T179, N180, E181, S182, G183, Y184, V185, and D186 of one monomer launches into the proximal cavity of the other through shape complementarity and electrostatic interactions. Such an in-tandem association generates a polymeric Arom chain about a 3-fold screw axis. These polymer chains then pack via the two H–I loops about 2-fold rotational symmetry axes normal to the screw axis, forming the P3221 space group symmetry.4 To examine the effect of the oligomerization, the following mutants of the D–E loop were generated: (i) Del7, in which T179, N180, E181, S182, G183, Y184, and V185 of the D–E loop were deleted; (ii) Del4, in which T179, N180, E181, and S182 of the D–E loop were deleted; (iii) point mutant E181A; and (iv) point mutant E181K. In addition, we generated two important side chain mutants, Y361F and K440Q, at the heme-proximal cavity (Figure 3). The Del7 mutant would involve removal of the entire D–E loop without affecting helices D and E, changes in the electrostatic property of the loop, and removal of the hydrogen bonds. The Del4 mutant will have a less severe effect but would change the electrostatic property of the loop. The E181A and E181K point mutations replace a negatively charged amino acid with a neutral and a positively charged side chain, respectively. The K440Q point mutation replaces a positive charge with a neutral polar amino acid. The Y361F mutation involves substituting a large hydrophobic residue with a polar headgroup for a large hydrophobic amino acid.
All six mutants are soluble and purifiable to different levels. The SDS–PAGE gels show that all the mutants are ~90% pure (Figure 1). Relative expression levels of all mutants are listed in Table 1. Protein yield is determined by the Soret peak absorbance at 393 nm and SDS–PAGE (Figure 1 and Figure S1 of the Supporting Information). Most notably, the highest yield is observed in the E181A mutant and the lowest yield in the Y361F mutant (Figure 1 and Table 1). All mutants, except for Y361F, possess a strong Soret peak at 393 nm indicative of a properly folded substrate-bound high-spin ferric state (Figure S1 of the Supporting Information). The Y361F mutant has a broad Soret signature at 393 nm with an inexplicable minor peak at 510 nm (Figure S1 of the Supporting Information). This minor peak, different from the characteristic α (570 nm), β (540 nm), and Q (550 nm) bands of P450s, prompted the necessity for confirmation of the protein identity by Western blotting as shown in Figure 1
Table 1 and Figure S2 of the Supporting Information summarize the enzyme activity measurement data for all mutants at the intermolecular interface as assessed by the tritiated water assay.20 Enzymatic activities of the WT, Del4, E181A, and E181K are comparable. Del7 maintains only 40% of the activity of the WT. The heme-proximal side mutants, K440Q and Y361, have detrimental effects on enzymatic activity, as both mutants are virtually inactive. Lineweaver–Burk plots (Figure S2 of the Supporting Information) are used to assess the functionality of rArom WT in comparison to those of the various intermolecular interface mutants. The measured KM and Vmax values of WT, Del4, E181A, and E181K are similar. Despite having a somewhat lower KM value, the Del7 mutant has an appreciably lower specific activity in comparison to that of the WT. Not surprisingly, however, the substrate affinity and Vmax for K440Q are both reduced.
Solution Studies on the Oligomeric States
Arom exists as a higher-order oligomer in protein crystals.3,4 Native PAGE analyses of the enzyme from 0.4 mg/mL (concentration at the end of purification) to 30–35 mg/mL (crystallization concentration) have been performed to study the oligomeric states of Arom in solution (Figure 4). pArom and rArom WT exist as higher-order oligomers in solution, whereas E181A and E181K exist predominantly in lower-order oligomeric states. Size-exclusion chromatography (SEC) of the purified rArom WT and mutants shows two peaks: a minor 78 kDa peak and a major 143 kDa peak (data not shown). These SEC results indicate that at lower concentrations (because of a 30-fold dilution that occurs with SEC), rArom WT and mutants can exist as a mixture of monomeric, dimeric, and trimeric states. Analytical ultracentrifugation (AUC) is used to further confirm the oligomeric state of Arom in solution based upon the apparent molecular mass of Arom in solution. Results indicate that at 2 and 20 mg/mL, rArom WT exists in its dimeric form or in equilibrium between monomeric and dimeric states (Figure S3 of the Supporting Information). Additionally, AUC data indicate that rArom is highly homogeneous and monodisperse, which further confirms the integrity of the protein.
Figure 4.

Native PAGE analysis of pArom, rArom WT, rArom E181A, and rArom E181K. (A) Native PAGE with pArom at varying concentrations and (B) rArom WT and mutants at 30 mg/mL. pArom and rArom oligomeric states assigned by linear regression are marked by arrows and designated by numbers: (1) monomer, (2) dimer, (3) trimer, (4) tetramer, and (5) pentamer. pArom and rArom WT exist as higher-order oligomers, while E181A and E181K are primarily lower-order oligomers. The dimeric state is predominant for rArom WT and mutants, whereas the trimer is the dominant pArom form.
Coupling of Arom with CPR
Modeling of coupling between CPR and Arom showed that CPR couples to the heme-proximal end of Arom.10 By utilizing an estrone-based ELISA modified for the measurement of Arom activity, we are able to gather accurate activity data in a semi-high-throughput way. Additionally, the method requires only small amounts of both enzymes and is thus well suited for this experiment. The resulting Michaelis–Menten plot is shown in Figure 5. The specific activity of rArom increases with an increasing concentration of rat CPR at a fixed rArom concentration and excess ASD and NADPH (Figure 5). The KM value for CPR binding is calculated to be 9.5 nM, and the Vmax is 55 nmol min−1 mg−1. Furthermore, the optimal molar ratio of CPR to Arom appears to be ≫ 3:1.
Figure 5.
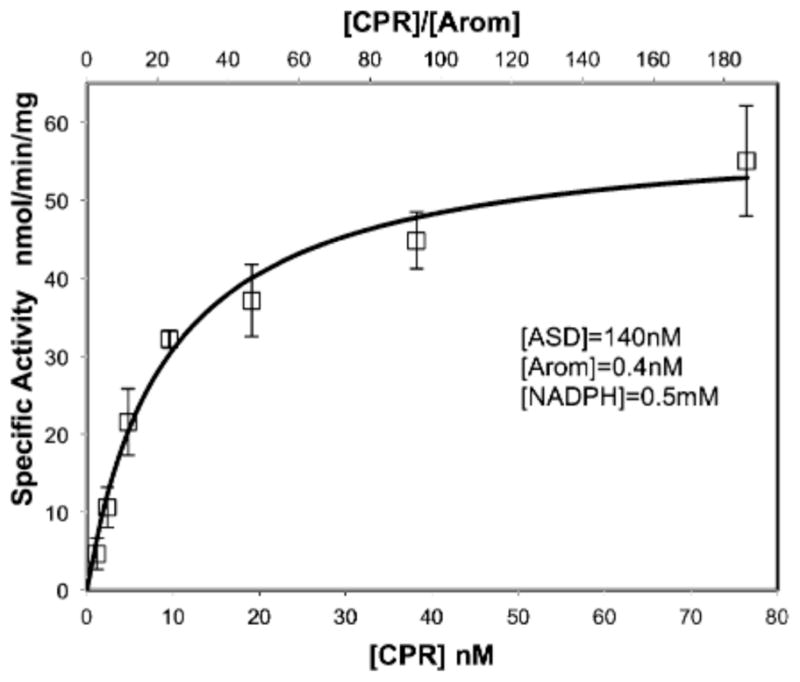
Michaelis–Menten plot of rArom activity as a function of CPR concentration. The specific activity of rArom is measured by the ELISA method (see Materials and Methods for details). Averaged data points and their standard deviations resulting from quadruplicate measurements are shown. The corresponding CPR:rArom concentration ratios are indicated on the upper x-axis.
Overall and Active Site Structure of rArom
The crystals are long (~0.1–0.5 mm), rod-shaped, and salmon-colored (Figure S4A of the Supporting Information), contrasting in morphology with the pArom crystals, which are typically shorter and thicker hexagonal rods, and deep brown in color.1 The corresponding SDS–PAGE (Figure S4B of the Supporting Information) and Soret peak (Figure S5C of the Supporting Information) show the purity of the protein solution that yielded crystals. The heme integrity of the protein is maintained even under the crystallization conditions as evidenced by the ratio of absorbances at 393 and 280 nm. The rArom crystal is isomorphous to that of pArom with nearly identical cell parameters and the same space group (Table 2). The space group was P3221 with the following unit cell parameters: a = b = 140.8 Å, c = 116.5 Å, α = β = 90°, and γ = 120°. There was one Arom molecule in the asymmetric unit, with a solvent content of ~79%. A total of 72413 diffraction intensities were measured yielding 20153 unique reflections. The diffraction data were 97.8% complete between 50.0 and 3.30 Å with an overall Rmerge of 0.093. The intensity:σ ratio was 2.0 in the highest-resolution shell. A data collection summary is provided in Table 2. The 3.30 Å resolution crystal structure of the rArom–ASD complex can be superimposed with the pArom structure with a Cα root-mean-square deviation (RMSD) of 0.4 Å (Figure 6). The two structures, therefore, are nearly identical except for some dynamically mobile loop regions (G–H and H–I loops) and minor changes of the active site. The carboxylate Oδ2 of the protonated D309 side chain is involved in a hydrogen bond with the 3-keto oxygen that is 2.9 Å away (Figure 1), which is marginally longer than in the pArom structure.1 The distance from the C19 to the heme iron is 3.7 Å, 0.3 Å shorter than in pArom. However, the minor differences between the active sites of pArom and rArom are within the limits of error. Collectively, the overall structures of pArom and rArom remain the same. Moreover, the N-terminal modification does not affect the overall packing (Figure 7). The N-terminal transmembrane helix is in a region of dynamically disordered solvent and detergent. As the intermolecular contact along this interface is nonexistent, the deletion of 39 amino acids at the N terminus of rArom does not alter the crystal packing interactions.
Table 2.
Diffraction Data Collection and Refinement Statistics of rArom
| Data Collection | |
| space group | P3221 |
| cell dimensions | |
| a, b, c (Å) | 140.82, 140.82, 116.48 |
| α, β, γ (deg) | 90.0, 90.0, 120.0 |
| resolution (Å) | 50.0–3.30 (3.29–3.38)a |
| Rsym or Rmerge | 0.093 (0.662) |
| I/σI | 16.76 (2.01) |
| completeness (%) | 97.8 (99.9) |
| redundancy | 3.6 (3.7) |
| no. of crystals used | 1 |
| Refinement | |
| resolution (Å) | 50.0–3.30 |
| no. of reflections | 19096 |
| Rwork/Rfree | 0.216/0.248 |
| no. of atoms | |
| protein | 3658 |
| ligand/ion | 64/5 |
| water | 2 |
| B factor (Å2) | |
| protein | 91 |
| ligand/ion | 59/114 |
| water | 76 |
| rmsd | |
| bond lengths (Å) | 0.009 |
| bond angles (deg) | 1.273 |
Values in parentheses are for the highest-resolution shell.
DISCUSSION
Mutations That Influence Enzyme Activity
The D309N (Figure 2) mutant is capable of substrate binding because the amide group of asparagine is still capable of hydrogen bonding to the 3-keto group of ASD. The approximate distance determined by modeling the mutation in the rArom crystal structure is ~2.6 Å. However, because asparagine has no dissociable proton, it would not be able to participate in enzyme catalysis.1 The tritiated water assay confirms that the D309N mutant is virtually inactive,13,30 in agreement with the proposed mechanism.1 This result shows that D309 is indeed essential for enzyme catalysis, being in the path of the proton relay network for the 3-keto enolization reaction.1,2 The prediction that D309 must be protonated and that the proton is trapped between D309 carboxylate and 3-keto of the substrate1 has been supported by a recent hybrid quantum mechanics/ molecular mechanics simulation of the third reaction step.31
In addition, we have reasoned that R192 (Figure 2) is critical to the network and its mutagenesis would abolish proton relay.1 Mutation of R192 to glutamine involves removal of the positive charge, thus eliminating the possibility of formation of a salt bridge. Modeling suggests that the distance between E483 and Q192 is too large to form a hydrogen bond. Moreover, Q192 is unable to make a hydrogen bonding contact with the water molecule linking D309 to the proton relay network. As confirmed by the enzyme activity assay, this mutagenesis consequently results in an inactive protein.
Mutations of the Intermolecular Interface
The constructs rArom WT, E181A, E181K, and Del4 all produce similar protein yields (~10–15 mg of purified enzyme/L of culture). Intriguingly, D–E loop point mutant E181A (Figure 3) has consistently yielded much larger amounts of purified protein, by a factor of 5–15-fold versus that of the WT. Because this mutation results in the loss of intermolecular charge coupling with the K440 side chain in the proximal cavity, it is likely to lower the binding affinity and shift the equilibrium toward the monomeric form, which is apparently evident from the solution data (Figure 4B). On the other hand, the E181A mutation probably stabilizes or tightens the D–E loop region, increasing the protein solubility and thereby shifting the equilibrium from the insoluble protein (in the inclusion bodies) to the soluble form. The loss of conformational entropy for an open D–E loop with E181 could be more than offset by the gain in hydrophobic effects caused by burying this loop. The E181K charge-reversal mutation creates repulsive and steric interference with K440 at the proximal intermolecular interface, being too far from neighboring polar residues (Y361 and Y441) to allow for compensatory hydrogen bond formation (Figure 3). Therefore, this mutant would likely exist as a lower-order oligomer, as the solution result indicates (Figure 4B). Even though the protrusion of this loop into the proximal cavity could be hindered by mutation of E181, previous calculations suggest that there is more to the interfacial interaction than just the D–E loop.4
Mutations Del7 and Del4 involve removal of all or part of the D–E loop region (Figure 3). The deletion of all seven residues of the D–E loop would drastically alter the complementarities of the coupling interfaces and disrupt the electrostatic and hydrogen bond-forming interactions between the loop and the proximal cavity, as well. The loss of enzyme activity for Del7 (Table 1) is likely due to the partial loss of the oligomeric state. Nonetheless, like E181A and E181K, the deletion mutants probably do not abolish all of the intermolecular interactions but shift the equilibrium toward the lower-order forms. The integrity of the heme-binding scaffold for Del7 and Del4 is maintained as evidenced by the sharp Soret peaks (Figure S1 of the Supporting Information).
K440 is the first residue of helix L, at the end of a long loop (consisting of residues 419–439 between helices K″ and L) that houses several key residues, including R435, involved in heme coordination, and C437, the ligand to heme iron. The region, especially the antiparallel strandlike feature between F430 and G439, is stabilized by an intrastrand hydrogen bond (F430 CO···C437 NH) and a strong hydrogen bond between the K440 side chain and G431 carbonyl. Therefore, these residues not only have major roles in the maintenance of heme integrity but also may be direct participants in the transfer of electrons from CPR to heme. Mutation of K440 to glutamine could, therefore, result in loss of the electrostatic potential difference that drives CPR coupling10 as well as transfer of electrons. It is thus plausible that the K440Q mutation could compromise heme stability as well, as suggested by the high A280/A393 ratio of the spectra (Figure S1 of the Supporting Information). The other proximal cavity mutant Y361F (Figure 3) involves loss of an intermolecular hydrogen bond. The phenylalanine side chain here may pose additional hindrance to oligomer formation.
E181A, E181K, and Del4 have specific activities similar to that of the WT (Table 1). On the other hand, Del7, K440Q, and Y361F experience significant activity losses. The heme-proximal cavity mutants K440Q and Y361F are virtually inactive, unlike previous reports showing Y361F is active.15,32 In these reports, however, the enzymes were expressed in mammalian cells and assays were conducted in whole cells. The broad Soret peak exhibited by Y361F (Figure S1 of the Supporting Information) is indicative of poor heme incorporation, lack of substrate binding or folding problems, or any combination thereof. Furthermore, the low yield of this mutant enzyme suggests misfolding and a shift of the equilibrium toward insolubility, although a number of expression-related issues, such as mRNA instability, cannot be ruled out. These observations show for the first time the crucial role of the proximal cavity in intermolecular coupling between Arom and CPR, and in electron transfer. A recent report claims that Y361 is phosphorylated by nongenomic signaling of 17β-estradiol in breast cancer cell lines.32 Phosphorylation of this residue will not only alter the electrostatic potential of the proximal cavity but also influence the electron transfer mechanism and oligomer formation.
The measured KM and catalytic efficiency (Vmax/KM) (Table 1 and Figure S2 of the Supporting Information) for rArom WT are higher than those of pArom.33 Most of the mutants have similar kinetics parameters compared to those of the WT. Interestingly, Del7 (Table 1 and Figure S2 of the Supporting Information) exhibits lower values of KM, Vmax, and catalytic efficiency, and one of the lowest Kcat values compared to those of the WT and all other mutants. The decreased catalytic efficiency could account for the reduced activity of Del7, possibly indicating that it binds the substrate tighter but the reaction rate is slower. On the other hand, the other heme-proximal site mutant K440Q has a higher KM and the lowest catalytic efficiency compared to those of the WT and all other mutants (Table 1 and Figure S2 of the Supporting Information). These observations are especially interesting because it raises the possibility that mutations in the proximal region affect substrate binding, as well.
Verification of the integrity of mutants is possible because the three-dimensional structure of rArom, the architecture of the active site, the heme, and substrate-binding positions are nearly identical to those of pArom except for a few dynamically mobile loop regions (Figure 6). This work demonstrates, for the first time, that deletion and manipulation at the amino terminus, a technique used to crystallize several recombinant human microsomal cytochrome P450s,29 does not alter the native tertiary structure of the enzyme. Surprisingly, the pArom and rArom crystals are also isomorphous, and the overall crystal packing interactions remain the same (Figure 7). This is probably due to the fact that the intermolecular interaction that exists between the heme-proximal cavity and the D–E loop is conserved and dominant in both forms of Arom3,4 and could, therefore, be fundamental to its physiological organization. Finally, we have now shown that the kinetics profiles of both forms are comparable, as well, thereby establishing that the two cytoplasmic catalytic domains are essentially the same.
Oligomeric States of Arom in Solution
Multiple oligomeric states are observed in both pArom and rArom. Collectively, the solution data show that Arom can exist in multiple oligomeric states in solution. For rArom WT, the highest observed oligomeric state is a pentamer; however, the dimeric state seems to be the predominant state. On the other hand, for pArom, the highest observed oligomeric state is a tetramer with a predominant trimeric state. Oligomerization also appears to be concentration-dependent (Figure 4). For a nucleating supersaturated droplet, the protein concentration could be many times that achievable in solution (~50 mg/mL), because in the crystal it is estimated to be 270 mg/mL. This reasoning provides a rationale for why Arom exists as polymeric chains in the crystal.4 Interestingly, only lower-order oligomers are observed for our D–E loop mutants E181A and E181K. On the basis of our analysis of the D–E loop mutants, the highest-order oligomeric state is a dimer. Similar analyses of Del7 and Del4 are thus far inconclusive. This observation suggests that mutagenesis of residues in the D–E loop interferes with oligomerization by shifting the equilibrium toward the monomeric form. Possibly, some association still remains through other residues involved in driving “head-to-tail” association as previously noted.4
In conclusion, the question that lingers is how CPR is coupled to the Arom oligomer. CPR appears to compete with an Arom monomer for a free proximal end (Figure 5). The interaction exhibits Michaelis–Menten kinetics, but the structural basis of this phenomenon is yet to be determined. It is possible that higher-order organization is an act of protecting the delicate proximal cavity and maintenance of the heme in a high-spin ferric state. When CPR is in abundance, it could compete for a free proximal end to facilitate the transfer of electrons. Nevertheless, the fact that CPR binds to an Arom dimer at the interface is still a distinct possibility. We have structural data showing small molecules are accommodated in the proximity of the D–E loop in the open interfacial space (unpublished results). Evaluation of full implications of the interactions via the proximal cavity awaits the crystal structures of some of the key rArom mutants and the Arom–CPR complex.
Supplementary Material
Acknowledgments
Funding
This work was supported in parts by Grant R01GM086893 from the National Institutes of Health (to D.G.).
Dr. Michael Cosgrove and Stephen Shinsky are thanked for the use of the analytical ultracentrifuge and assistance with the interpretation of data. Crystallographic data were collected at beamline 19-ID at the Advanced Photon Source. The Structural Biology Center at the Advanced Photon Source is operated by UChicago Argonne, LLC, for the U.S. Department of Energy, Office of Biological and Environmental Research, under Contracts DE-AC02-06CH11357 and W-31-109-Eng-38.
ABBREVIATIONS
- BDM
β-dodecyl maltoside
- AUC
analytical ultracentrifugation
- ASD
androstenedione
- Vmax/KM
catalytic efficiency
- c(s)
continuous distribution
- CYP19A1
cytochrome P450 aromatase
- CPR
cytochrome P450 reductase
- Arom
human aromatase
- pArom
placental aromatase
- PPB
potassium phosphate buffer
- rArom
recombinant aromatase
- rmsd
root-mean-square deviation
- SEC
size-exclusion chromatography
- WT
wild type
Footnotes
The authors declare no competing financial interest.
Accession Codes
Deposited in the Protein Data Bank as entry 4KQ8.
Soret peak signatures, Lineweaver–Burk plots, analytical ultracentrifugation data, and rArom WT crystal pictures. This material is available free of charge via the Internet at http://pubs.acs.org.
References
- 1.Ghosh D, Griswold J, Erman M, Pangborn W. Structural basis for androgen specificity and oestrogen synthesis in human aromatase. Nature. 2009;457:219–223. doi: 10.1038/nature07614. [DOI] [PMC free article] [PubMed] [Google Scholar]
- 2.Ghosh D, Griswold J, Erman M, Pangborn W. X-ray structure of human aromatase reveals an androgen-specific active site. J Steroid Biochem Mol Biol. 2010;118:197–202. doi: 10.1016/j.jsbmb.2009.09.012. [DOI] [PMC free article] [PubMed] [Google Scholar]
- 3.Ghosh D, Jiang W, Lo J, Egbuta C. Higher order organization of human placental aromatase. Steroids. 2011;76:753–758. doi: 10.1016/j.steroids.2011.02.030. [DOI] [PMC free article] [PubMed] [Google Scholar]
- 4.Jiang W, Ghosh D. Motion and Flexibility in Human Cytochrome P450 Aromatase. PLoS One. 2012;7:e32565. doi: 10.1371/journal.pone.0032565. [DOI] [PMC free article] [PubMed] [Google Scholar]
- 5.Zhang F, Zhou D, Kao YC, Ye J, Chen S. Expression and purification of a recombinant form of human aromatase from Escherichia coli. Biochem Pharmacol. 2002;64:1317–1324. doi: 10.1016/s0006-2952(02)01361-8. [DOI] [PubMed] [Google Scholar]
- 6.Di Nardo G, Gilardi G. Human aromatase: Perspectives in biochemistry and biotechnology. Biotechnol Appl Biochem. 2013;60:92–101. doi: 10.1002/bab.1088. [DOI] [PubMed] [Google Scholar]
- 7.Santen RJ, Brodie H, Simpson ER, Siiteri PK, Brodie A. History of aromatase: Saga of an important biological mediator and therapeutic target. Endocr Rev. 2009;30:343–375. doi: 10.1210/er.2008-0016. [DOI] [PubMed] [Google Scholar]
- 8.Zhou D, Cam LL, Laughton CA, Korzekwa KR, Chen S. Mutagenesis study at a postulated hydrophobic region near the active site of aromatase cytochrome P450. J Biol Chem. 1994;269:19501–19508. [PubMed] [Google Scholar]
- 9.Kagawa N, Hori H, Waterman MR, Yoshioka S. Characterization of stable human aromatase expressed in E. coli. Steroids. 2004;69:235–243. doi: 10.1016/j.steroids.2004.01.002. [DOI] [PubMed] [Google Scholar]
- 10.Hong Y, Li H, Yuan YC, Chen S. Molecular characterization of aromatase. Ann NY Acad Sci. 2009;1155:112–120. doi: 10.1111/j.1749-6632.2009.03703.x. [DOI] [PMC free article] [PubMed] [Google Scholar]
- 11.Sigle RO, Titus MA, Harada N, Nelson SD. Baculovirus mediated high level expression of human placental aromatase (CYP19A1) Biochem Biophys Res Commun. 1994;201:694–700. doi: 10.1006/bbrc.1994.1756. [DOI] [PubMed] [Google Scholar]
- 12.Zhou D, Wang J, Chen E, Murai J, Siiteri PK, Chen S. Aromatase gene is amplified in MCF-7 human breast cancer cells. J Steroid Biochem Mol Biol. 1993;46:147–153. doi: 10.1016/0960-0760(93)90289-9. [DOI] [PubMed] [Google Scholar]
- 13.Chen S, Zhou D, Swiderek KM, Kadohama N, Osawa Y, Hall PF. Structure-function studies of human aromatase. J Steroid Biochem Mol Biol. 1993;44:347–356. doi: 10.1016/0960-0760(93)90238-r. [DOI] [PubMed] [Google Scholar]
- 14.Zhou DJ, Pompon D, Chen SA. Stable expression of human aromatase complementary DNA in mammalian cells: A useful system for aromatase inhibitor screening. Cancer Res. 1990;50:6949–6954. [PubMed] [Google Scholar]
- 15.Zhou DJ, Pompon D, Chen SA. Structure-function studies of human aromatase by site-directed mutagenesis: Kinetic properties of mutants Pro-308 → Phe, Tyr-361 → Phe, Tyr-361 → Leu, and Phe-406 → Arg. Proc Natl Acad Sci USA. 1991;88:410–414. doi: 10.1073/pnas.88.2.410. [DOI] [PMC free article] [PubMed] [Google Scholar]
- 16.Kagawa N. Efficient expression of human aromatase (CYP19) in E. coli. Methods Mol Biol. 2011;705:109–122. doi: 10.1007/978-1-61737-967-3_7. [DOI] [PubMed] [Google Scholar]
- 17.Hong Y, Yu B, Sherman M, Yuan YC, Zhou D, Chen S. Molecular basis for the aromatization reaction and exemestane-mediated irreversible inhibition of human aromatase. Mol Endocrinol. 2007;21:401–414. doi: 10.1210/me.2006-0281. [DOI] [PubMed] [Google Scholar]
- 18.Hong Y, Cho M, Yuan YC, Chen S. Molecular basis for the interaction of four different classes of substrates and inhibitors with human aromatase. Biochem Pharmacol. 2008;75:1161–1169. doi: 10.1016/j.bcp.2007.11.010. [DOI] [PubMed] [Google Scholar]
- 19.Kao YC, Korzekwa KR, Laughton CA, Chen S. Evaluation of the mechanism of aromatase cytochrome P450. A site-directed mutagenesis study. Eur J Biochem. 2001;268:243–251. doi: 10.1046/j.1432-1033.2001.01886.x. [DOI] [PubMed] [Google Scholar]
- 20.Lala P, Higashiyama T, Erman M, Griswold J, Wagner T, Osawa Y, Ghosh D. Suppression of human cytochrome P450 aromatase activity by monoclonal and recombinant antibody fragments and identification of a stable antigenic complex. J Steroid Biochem Mol Biol. 2004;88:235–245. doi: 10.1016/j.jsbmb.2003.12.010. [DOI] [PubMed] [Google Scholar]
- 21.Motulsky H. GraphPad Prism, version 5.0. GraphPad Software; San Diego: 2003. [Google Scholar]
- 22.Matsui K, Nishii S, Oka M. P450 aromatase inhibition assay using a competitive ELISA. J Pharm Biomed Anal. 2005;38:307–312. doi: 10.1016/j.jpba.2005.01.006. [DOI] [PubMed] [Google Scholar]
- 23.Patel A, Vought VE, Dharmarajan V, Cosgrove MS. A novel non-SET domain multi-subunit methyltransferase required for sequential nucleosomal histone H3 methylation by the mixed lineage leukemia protein-1 (MLL1) core complex. J Biol Chem. 2011;286:3359–3369. doi: 10.1074/jbc.M110.174524. [DOI] [PMC free article] [PubMed] [Google Scholar]
- 24.Schuck P. Size-distribution analysis of macromolecules by sedimentation velocity ultracentrifugation and Lamm equation modeling. Biophys J. 2000;78:1606–1619. doi: 10.1016/S0006-3495(00)76713-0. [DOI] [PMC free article] [PubMed] [Google Scholar]
- 25.Otninowski Z, Minor W. HKL Manual. Yale University; New Haven, CT: 1995. [Google Scholar]
- 26.Emsley P, Cowtan K. Coot: Model-building tools for molecular graphics. Acta Crystallogr. 2004;D60:2126–2132. doi: 10.1107/S0907444904019158. [DOI] [PubMed] [Google Scholar]
- 27.Murshudov GN, Vagin AA, Dodson EJ. Refinement of macromolecular structures by the maximum-likelihood method. Acta Crystallogr. 1997;D53:240–255. doi: 10.1107/S0907444996012255. [DOI] [PubMed] [Google Scholar]
- 28.Pettersen EF, Goddard TD, Huang CC, Couch GS, Greenblatt DM, Meng EC, Ferrin TE. UCSF Chimera: A visualization system for exploratory research and analysis. J Comput Chem. 2004;25:1605–1612. doi: 10.1002/jcc.20084. [DOI] [PubMed] [Google Scholar]
- 29.Williams PA, Cosme J, Vinkovic DM, Ward A, Angove HC, Day PJ, Vonrhein C, Tickle IJ, Jhoti H. Crystal structures of human cytochrome P450 3A4 bound to metyrapone and progesterone. Science. 2004;305:683–686. doi: 10.1126/science.1099736. [DOI] [PubMed] [Google Scholar]
- 30.Auvray P, Nativelle C, Bureau R, Dallemagne P, Seralini GE, Sourdaine P. Study of substrate specificity of human aromatase by site directed mutagenesis. Eur J Biochem. 2002;269:1393–1405. doi: 10.1046/j.1432-1033.2002.02779.x. [DOI] [PubMed] [Google Scholar]
- 31.Sen K, Hackett JC. Coupled electron transfer and proton hopping in the final step of CYP19-catalyzed androgen aromatization. Biochemistry (Moscow) 2012;51:3039–3049. doi: 10.1021/bi300017p. [DOI] [PMC free article] [PubMed] [Google Scholar]
- 32.Catalano S, Barone I, Giordano C, Rizza P, Qi H, Gu G, Malivindi R, Bonofiglio D, Ando S. Rapid estradiol/ERα signaling enhances aromatase enzymatic activity in breast cancer cells. Mol Endocrinol. 2009;23:1634–1645. doi: 10.1210/me.2009-0039. [DOI] [PMC free article] [PubMed] [Google Scholar]
- 33.Bullion KA, Osawa Y, Braun DG. Reversible inhibition of human placental microsomal aromatase by CGS 18320B and other non-steroidal compounds. Endocr Res. 1990;16:255–267. doi: 10.1080/07435809009033004. [DOI] [PubMed] [Google Scholar]
Associated Data
This section collects any data citations, data availability statements, or supplementary materials included in this article.