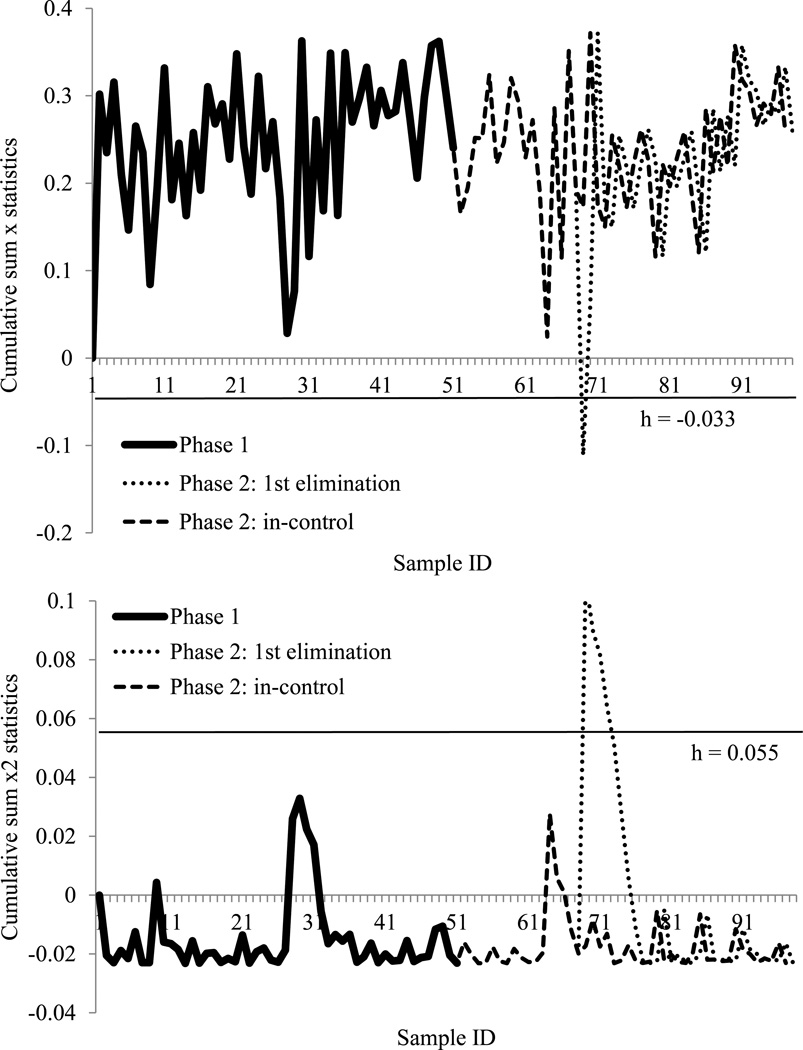
Figure 6.
Cumulative sum X and X square (X2) control charts for 2011 post-thaw membrane integrity data. With 100% inspection, the cumulative sum X chart (above) monitored mean shifts and the cumulative sum X2 chart (below) monitored variation changes. The charts were set up with simulated data from same distribution of 2011 data as Phase 1, and the control limit (straight line) kept all Phase 1 in-control. The tested 2011 data were Phase 2. The charts represented the approach of eliminating every first out-of-control point until all Phase 2 in-control. h: control limit.

