

Abstract
Background
Cockroach and mouse allergens have both been implicated as causes in inner-city asthma morbidity in multicenter studies, but whether both allergens are clinically relevant within specific inner-city communities is unclear. Objective: Our study aimed to identify relevant allergens in Baltimore City.
Methods
One hundred forty-four children (5–17 years old) with asthma underwent skin prick tests at baseline and had clinical data collected at baseline and 3, 6, 9, and 12 months. Home settled dust samples were collected at the same time points for quantification of indoor allergens. Participants were grouped based on their sensitization and exposure status to each allergen. All analyses were adjusted for age, sex, and serum total IgE level.
Results
Forty-one percent were mouse sensitized/exposed, and 41% were cockroach sensitized/exposed based on bedroom floor exposure data. Mouse sensitization/exposure was associated with acute care visits, decreased FEV1/forced vital capacity percentage values, fraction of exhaled nitric oxide levels, and bronchodilator reversibility. Cockroach sensitization/exposure was only associated with acute care visits and bronchodilator reversibility when exposure was defined by using bedroom floor allergen levels. Mouse-specific IgE levels were associated with poor asthma health across a range of outcomes, whereas cockroach-specific IgE levels were not. The relationships between asthma outcomes and mouse allergen were independent of cockroach allergen. Although sensitization/exposure to both mouse and cockroach was generally associated with worse asthma, mouse sensitization/exposure was the primary contributor to these relationships.
Conclusions
In a community with high levels of both mouse and cockroach allergens, mouse allergen appears to be more strongly and consistently associated with poor asthma outcomes than cockroach allergen. Community-level asthma interventions in Baltimore should prioritize reducing mouse allergen exposure.
Keywords: Inner-city asthma, childhood asthma, mouse allergen, cockroach allergen, indoor allergens
Asthma is one of the most common diseases of childhood, and it is known to have a high prevalence among urban minority children.1, 2 Urban minority children also display more asthma morbidity than nonurban nonminority children. The cause for this is believed to be multifold, but the major indoor allergens (dust mite, cat, cockroach, and mouse) have repeatedly been shown to be major contributors to asthma morbidity in this population.3–14 Because mouse, cockroach, cat, and dust mite allergen levels vary across and even within cities in the United States,6, 15, 16 it is generally thought that this spatial variability in indoor allergen levels provides insight into which allergens are most clinically relevant within a geographic area. For example, if there are high prevalences and concentrations of certain allergens within a given community, the assumption is that these particular allergens are the ones that contribute to asthma morbidity in that community. As such, the prevailing thought is that both cockroach and mouse allergens are major causes of asthma morbidity in US inner cities that have high levels of these 2 pest allergens.17 However, there are scant data to support this assumption because the multicenter inner-city asthma studies conducted to date have not, by design, focused on site-specific allergen exposure and asthma morbidity.5, 6, 15
It is also well known that sensitization and exposure to any particular allergen rarely occurs in isolation in childhood asthma, yet many inner-city asthma studies examine the effects of sensitization and exposure to a single allergen, often without adjusting for other allergens.15, 18 Although it is quite plausible that being sensitized and exposed to multiple allergens can have greater adverse effects than being sensitized and exposed to any single allergen, the combined effects of sensitization and exposure to these allergens on inner-city asthma health have not been evaluated.
Determining the specific allergen profile most highly associated with asthma morbidity within a community is not only important for managing patients with asthma and allergies from that community but also informs the development of communitylevel asthma interventions that would aim to reduce levels of the key allergen or allergens in the community as a whole. Therefore we aimed to identify the profile of allergens of greatest public health relevancein 1inner-city community, Baltimore City, and to estimate the combined effects of these allergens on asthma health. To accomplish these objectives, we examined relationships between exposure and sensitization to indoor allergens and asthma health in a prospective cohort study of 150 Baltimore City children and adolescents with persistent asthma.
METHODS
Study population
One hundred fifty Baltimore City children (5–17 years old) with persistent asthma were enrolled and followed for 1 year as part of the Mouse Allergen and Asthma Cohort Study. The primary objective of this study was to evaluate relationships between mouse allergen exposure and clinical markers of asthma and to evaluate the relationships between other indoor allergen exposures, particularly cockroach, and clinical markers of asthma. Participants were recruited from the Johns Hopkins Emergency Department, an institutional review board–approved database of past study participants who had consented to being contacted for future studies, and miscellaneous sources, including health fairs and word of mouth, from April 2007 to June 2009. Participants had to have received a diagnosis of asthma from a physician at least 1 year before the baseline study visit. Participants had to be receiving a controller medication or meet the criteria for persistent asthma, as defined by the National Asthma Education and Prevention Program guidelines (National Heart, Lung, and Blood Institute; National Asthma Education and Prevention Program; 2007). Participants were eligible if they had experienced an asthma exacerbation in the previous year. An asthma exacerbation was defined as requiring a trip to the emergency department or a physician’s office because of asthma symptoms or an oral corticosteroid burst in the last 12 months. Smokers were excluded. Smoking status was determined based on the results of rapid urine cotinine screening. Participants with a positive rapid urine cotinine test result at baseline did not continue in the study. Participants also had to sleep in the same home for at least 4 nights each week to be enrolled in the study. Clinical assessments were performedat baseline and every 3 months thereafter. Exposure assessments were also performed at baseline and every 3 months within ±2 weeks of clinical assessment. Written informed consent was obtained, and the study was approved by the Johns Hopkins Institutional Review Board.
Clinical assessments
Allergy skin testing was performed at the baseline clinic visit with the MultiTest II device (Lincoln Diagnostics, Decatur, Ill). The allergens tested were dog, cat, Dermatophagoides pteronyssinus, Dermatophagoides farinae, rat epithelia, German cockroach, American cockroach, mouse epithelia, oak, grass mix, Alternaria tenuis, Aspergillus fumigatus, common ragweed, and Cladosporium herbarum (Greer Laboratories, Lenoir, NC). A skin test result was considered positive if the net orthogonal wheal diameter was 3 mm or greater.19 The net orthogonal wheal diameter was obtained by subtracting the orthogonal wheal diameter of the negative control from the orthogonal wheal diameter of the skin test in question. Blood was collected at baseline, and serum total and specific IgE levels were quantified with the ImmunoCAP system (Thermo Fisher, Uppsala, Sweden).
Spirometry was performed at each clinic visit with a KoKo spirometer (nSpire Health, Longmont, Colo), and percent predicted values were determined by using Hankinson equations. Bronchodilator reversibility was defined as having a 12% or greater increase in FEV1 15 minutes after administration of 2 puffs of short-acting β-agonist. Fraction of exhaled nitric oxide (FENO) levels were measured at each clinic visit with the NIOX Mino (Aerocrine, Solana, Sweden), according to the manufacturer’s instructions. FENO levels were always measured before spirometry.
Questionnaires that captured medication use, asthma symptoms, and health care use were administered at all clinic visits. The questionnaires were designed to capture symptoms and medication use over a 2-week period.5, 6, 15 Data on asthma-related health care use were collected for the preceding 3-month period. An acute visit was defined as any unscheduled visit for asthma-related symptoms.
Exposure assessments
Settled dust samples from the bed and bedroom floor were collected with a handheld vacuum cleaner and a Mitest dust collector (Indoor Biotechnologies, Charlottesville, Va). Protein was extracted from the settled dust samples, and Mus m 1, Bla g 1, Der f 1, and Fel d 1 content was quantified by means of ELISA. The limit of detection for the assay was 2.2 ng/g for Mus m 1, 0.39 U/g for Bla g 1, 21 ng/g for Der f 1, and 63.4 ng/g for Fel d 1.
Statistical analyses
Participants were stratified by sensitization and exposure status for the allergens of interest. For each allergen, sensitization and exposure status was modeled as a dichotomous predictor variable, with sensitization and exposure being coded a 1 and nonsensitization or nonexposure being coded a 0. There were separate models for each allergen. For dichotomous outcomes, such as acute care visits and reversibility, binomial regression models with a log link and generalized estimating equations were used. For continuous outcomes, such as FEV1/forced vital capacity (FVC) ratio, linear regression models with generalized estimating equations were used. For continuous outcomes, predicted outcome values were generated from the regression models. Participants were considered sensitized if the net wheal for a particular allergen extract was 3 mm or larger. Participants were considered exposed if their house dust samples for a particular visit contained at least the following levels of allergen: Bla g 1, 1 U/g; Mus m 1, 1 μg/g; Der f 1, 2 μg/g; and Fel d 1, 8 μg/g.3, 4, 14, 15, 20–22 These thresholds were based on thresholds determined to be clinically relevant in previously published studies. Dog allergen was not explored in our analyses because subjects in this population were much less frequently sensitized to dog (26% of participants with positive skin test results) compared with the other allergens (51% to 64% of participants with positive skin test results for all other allergens explored). Final models were adjusted for age, sex, total IgE level, and type of health insurance. Health insurance was a dichotomous variable of public health insurance versus private insurance or self-pay, and it was used as a marker of socioeconomic status.
Initial analyses focused on identifying the indoor allergens that were associated with markers of poor asthma health. To examine the combined effects of sensitization and exposure to these 2 allergens, participants were stratified into sensitization and exposure categories as follows: (1) sensitized and exposed to neither cockroach nor mouse, (2) sensitized and exposed to cockroach but not mouse, (3) sensitized and exposed to mouse but not cockroach, and (4) sensitized and exposed to both mouse and cockroach. We then modeled relationships among these 4 sensitization/exposure categories and the asthma outcomes of interest using generalized estimating equations. Predicted outcome measures were generated from the models. Final models were adjusted for age, sex, total IgE level, and type of health insurance. All analyses were performed with STATA SE 11.0 software (StataCorp, College Station, Tex). A P value of less than .05 was considered statistically significant.
RESULTS
Study population
A total of 150 participants were enrolled, and 144 had at least 1 visit with valid cockroach, mouse, dust mite, and cat allergen exposure data. The population was predominantly African American, low income, and poorly educated. Most of the participants had been to the emergency department in the last 12 months because of an asthma exacerbation. The frequency of short-acting β-agonist use was high, with participants using short-acting β-agonists 4.4 days out of 2 weeks (SD, 5.2 days) on average. Ninety percent had at least 1 positive skin prick test response. The most predominant positive skin test response was for cat at 64%. Sixty percent had positive results for cockroach, 56% for dust mite, and 51% for mouse. Twenty-six percent were sensitized to dog. The distribution of mouse-specific IgE was right skewed in this population. Additional characteristics, including lung function and FENO concentrations, are summarized in Table I.
TABLE I.
Study population characteristics
| Demographic characteristics | |
| Female sex, no. (%) | 63 (44) |
| Age (y), median (range) | 11 (5–17) |
| African American, no. (%) | 131 (91) |
| Annual household income <$30,000, no. (%) | 86 (64) |
| Public health insurance, no. (%) | 122 (85) |
| Caregiver ≤ high school education, no. (%) | 90 (63) |
| Clinical characteristics | |
| Health care and medication use | |
| ED visit, previous 12 mo, no. (%) | 101 (70) |
| Controller medication use, no. (%)* | 104 (72) |
| SABA use, days/2 weeks, mean (SD) | 4.4 (5.2) |
| Lung function | |
| FEV1/FVC (%), mean (SD) | 80.7 (9.6) |
| Bronchodilator reversibility, no. (%) | 34 (27) |
| Allergic sensitization | |
| ≥1 Positive SPT response, no. (%) | 130 (90) |
| Cat, no. (%) | 92 (64) |
| Cockroach, no. (%) | 87 (60) |
| Dust mite, no. (%) | 81 (56) |
| Mouse, no. (%) | 74 (51) |
| Total IgE (kU/L), median (IQR) | 189 (48–458) |
| Mouse-specific IgE (kU/L), median (IQR) | 0.05 (0.05–10.3) |
| Cockroach-specific IgE (kU/L), median (IQR) | 0.11 (0.03–1.23) |
| Allergen exposure, median (IQR) | |
| Bed dust | |
| Fel d 1 (μg/g) | 1.5 (0.6–8.8) |
| Bla g 1 (U/g) | 0.1 (0.1–1.7) |
| Der f 1 and Der p 1 (μg/g) | 0.2 (0.04–0.8) |
| Mus m 1 (μg/g) | 1.2 (0.3–3.7) |
| Bedroom floor dust | |
| Fel d 1 | 0.4 (0.1–2.4) |
| Bla g 1 (U/g) | 1.2 (0.1–12.5) |
| Der f 1 and Der p 1 | 0.1 (<LLOD-0.4) |
| Mus m 1 | 2.7 (0.4–10.7) |
ED, Emergency department; IQR, interquartile range; LLOD, lower limit of detection; SABA, short-acting β-agonist.
Inhaled corticosteroid or leukotriene inhibitor.
Relevant allergens in Baltimore City
To answer the question of which allergens act as significant drivers of asthma morbidity among Baltimore City children, we divided the study population into 2 categories for each allergen in question: (1) sensitized and exposed or (2) either not sensitized or not exposed. At baseline, by using bed dust exposure data, 26% of the participants were sensitized and exposed to mouse, 17% to cockroach, 14% to cat, and 9% to dust mite. Sensitization status was fixed from baseline, and although exposure could vary over time, it remained relatively stable. Of note, 88% of those considered exposed to mouse at baseline were considered exposed to mouse at all of their follow-up visits, and 89% of subjects considered exposed to cockroach at baseline were considered exposed to cockroach at all of their follow-up visits.
Mouse emerged as the most relevant allergen with regard to asthma outcomes. Results are presented in Table II. When we examined relationships between sensitization/exposure status and asthma health outcomes using bed dust as the measure of exposure, mouse sensitization and exposure was significantly associated with increased prevalence of health care use (prevalence ratio [PR], 1.51; 95% CI, 1.22–1.88; P < .01), decreased FEV1/FVC percentage (predicted mean, 79.5%; 95% CI, 77.8% to 81.2%; P = .048), and increased prevalence of bronchodilator reversibility (PR, 1.54; 95% CI, 1.09–2.19; P = .01). Significant relationships between sensitization and exposure status and these asthma outcomes were not seen for any of the other allergens (ie, cockroach, dust mite, or cat). Fig 1 displays the predicted percentage of subjects requiring acute health care visits for asthma among the sensitization and exposure groups for each allergen. By using bedroom dust samples as the measure of exposure, sensitization and exposure to mouse was associated with increased prevalence of health care use for asthma (PR, 1.33; 95% CI, 1.07–1.65; P <.01) and higher levels of pulmonary inflammation, as measured based on FENO levels (predicted mean, 35.5; 95% CI, 30.2–40.7; P <.01). Among those sensitized and exposed to cockroach, an increased prevalence of health care use for asthma (PR, 1.24; 95% CI, 1.01–1.52; P =.04) was noted. No significant relationships between sensitization and exposure to the other allergens (dust mite and cat) and the clinical features of asthma were seen. Several previously published allergen exposure thresholds3, 4, 14, 15, 20–22 were used to define exposure versus nonexposure for each of the allergens, and similar patterns were seen for all thresholds used (data not shown). Furthermore, adjusting the mouse allergen models for the presence of cockroach allergen did not alter the patterns seen.
TABLE II.
Associations of clinical features of asthma with sensitization/exposure to indoor allergens
| Acute health care visits in 3 mo | Bedroom dust | Bed dust | ||
|---|---|---|---|---|
| PR (95% CI) | P value | PR (95% CI) | P value | |
| Mouse | 1.33 (1.07–1.65) | <.01 | 1.51 (1.22–1.88) | <.01 |
| Cockroach | 1.24 (1.01–1.52) | .04 | 1.06 (0.82–1.39) | .65 |
| Dust mite | 0.70 (0.40–1.23) | .22 | 1.01 (0.69–1.47) | .96 |
| Cat | 0.97 (0.68–1.38) | .87 | 0.87 (0.63–1.21) | .42 |
| FENO | Predicted value (95% CI) | P value | Predicted value (95% CI) | P value |
|---|---|---|---|---|
| Mouse | 35.5 (30.2–40.7) | <.01 | 32.4 (27.5–38.0) | .31 |
| Cockroach | 29.5 (25.7–33.9) | .41 | 29.5 (24.5–34.7) | .53 |
| Dust mite | 28.2 (21.4–36.3) | .48 | 30.2 (24.0–38.0) | .99 |
| Cat | 30.2 (24.0–37.2) | .79 | 30.2 (25.1–36.3) | .90 |
| FEV1/FVC (%) | Predicted value (95% CI) | P value | Predicted value (95% CI) | P value |
|---|---|---|---|---|
| Mouse | 80.6 (79.0–82.2) | .93 | 79.5 (77.8–81.2) | .048 |
| Cockroach | 81.0 (79.5–82.5) | .41 | 80.3 (78.4–82.3) | .45 |
| Dust mite | 81.2 (78.5–83.8) | .67 | 79.5 (77.0–82.0) | .27 |
| Cat | 80.8 (78.4–83.2) | .91 | 81.2 (79.0–83.3) | .74 |
| Bronchodilator reversibility | PR (95% CI) | P value | PR (95% CI) | P value |
|---|---|---|---|---|
| Mouse | 1.18 (0.84–1.67) | .34 | 1.54 (1.09–2.19) | .01 |
| Cockroach | 1.37 (1.01–1.86) | .05 | 0.95 (0.61–1.48) | .82 |
| Dust mite | 0.86 (0.44–1.70) | .67 | 1.05 (0.61–1.81) | .86 |
| Cat | 1.18 (0.73–1.91) | .50 | 1.25 (0.82–1.90) | .31 |
For dichotomous outcomes, such as acute care visit and reversibility, binomial regression models with generalized estimating equations and log link were used to obtain PRs. For continuous outcomes, such as FEV1/FVC ratio, linear regression models with generalized estimating equations were used. For continuous outcomes, predicted outcome values were generated from the regression models. All models were adjusted for age, sex, total IgE level, and type of insurance.
FIG 1.
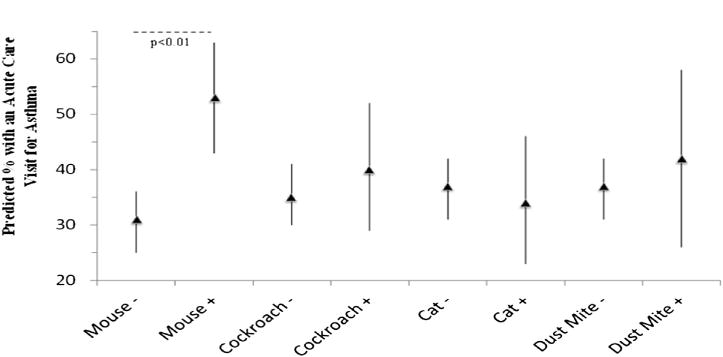
Predicted percentage of subjects with an acute care visit for asthma over a 3-month period. Sensitization and exposure groups using exposure data from bed dust samples are plotted on the x-axis. Mouse − represents those without the combination of sensitization and exposure for mouse allergen, and Mouse + represents those with the combination of sensitization and exposure to mouse allergen. The same is true for each of the other allergens. The predicted percentage of subjects with an acute care visit over 3 months is plotted on the y-axis. Significant comparisons are labeled with P values.
Specific IgE level as a marker of both sensitization and exposure
Because the allergen-specific IgE level has been proposed as a surrogate marker for the combination of sensitization and expo-sure,9 we evaluated the relationships between mouse-specific IgE and cockroach-specific IgE and clinical features of asthma. Table III displays results from a longitudinal analysis of the relationships between allergen-specific IgE levels and various clinical features. Mouse-specific IgE was associated with an increased prevalence of acute health care visit for asthma (PR, 1.07; 95% CI, 1.02–1.13; P = .01) and an increased prevalence of having bronchodilator reversibility (PR, 1.09; 95% CI, 1.00–1.18; P = .02). The relationship between mouse-specific IgE levels and increased prevalence of bronchodilator reversiblity was independent of cockroach-specific IgE levels. No significant relationships were seen between cockroach-specific IgE levels and the outcomes of interest.
TABLE III.
Associations of serum specific IgEs with clinical features of asthma
| For every 10 kU/L increase
in: |
||||
|---|---|---|---|---|
| Mouse-specific IgE |
Cockroach-specific IgE
|
|||
| Acute health care visits in 3 mo | PR (95% CI) | P value | PR (95% CI) | P value |
| Each allergen alone | 1.08 (1.02 to 1.13) | .01 | 1.00 (0.88 to 1.13) | .95 |
| Adjusted for other allergen | 1.03 (0.97 to 1.10) | .31 | 1.04 (0.92 to 1.17) | .53 |
|
| ||||
| FENO | Coefficient (95% CI) | P value | Coefficient (95% CI) | P value |
|
| ||||
| Each allergen alone | 3.10 (0.47 to 5.72) | .02 | 0.65 (−4.48 to 5.79) | .88 |
| Adjusted for other allergen | 2.59 (−0.14 to 5.33) | .06 | 0.55 (−4.68 to 5.78) | .87 |
|
| ||||
| FEV1/FVC (%) | Coefficient (95% CI) | P value | Coefficient (95% CI) | P value |
|
| ||||
| Each allergen alone | −0.70 (−0.13 to 0.01) | .03 | 0.03 (−1.29 to 1.35) | .96 |
| Adjusted for other allergen | −0.57 (21.25 to 0.11) | .10 | −0.03 (−1.36 to 1.30) | .96 |
|
| ||||
| Bronchodilator reversibility | PR (95% CI) | P value | PR (95% CI) | P value |
|
| ||||
| Each allergen alone | 1.22 (1.08 to 1.39) | <.01 | 0.94 (0.73 to 1.20) | .60 |
| Adjusted for other allergen | 1.22 (1.06 to 1.40) | <.01 | 0.91 (0.70 to 1.17) | .50 |
For dichotomous outcomes, such as acute care visit and reversibility, binomial regression models with generalized estimating equations and log link were used to obtain PRs. For continuous outcomes, such as FEV1/FVC ratio, linear regression models with generalized estimating equations were used. All models were adjusted for age, sex, total IgE level, and type of insurance.
Dual sensitization and exposure to mouse and cockroach
To examine the effects of being sensitized and exposed to both mouse and cockroach, we stratified the study population into 4 groups, as follows: (1) sensitized and exposed to neither cockroach nor mouse (n=525 observations among 105 subjects), (2) sensitized and exposed to cockroach but not mouse (n = 155 observations among 31 subjects), (3) sensitized and exposed to mouse but not cockroach (n = 230 observations among 46 subjects), and (4) sensitized and exposed to both cockroach and mouse (n = 90 observations among 18 subjects). For detailed results of this analysis, see Table E1 in this article’s Online Repository at www.jacionline.org.
Sensitization and exposure to both mouse and cockroach was associated with increased likelihood of health care use for asthma and higher predicted percentage of subjects with bronchodilator reversibility. There were also trends toward decreasing FEV1/FVC percentages and increased pulmonary inflammation (as measured based on FENO values) among the group sensitized and exposed to both mouse and cockroach. However, mouse allergen emerged as the stronger driver of the worse asthma outcomes, which were observed among those who were sensitized and exposed to both mouse and cockroach. For instance, using the exposure data from bed dust samples, the predicted percentage of subjects with an acute health care visit for asthma among the group with sensitization and exposure to both mouse and cockroach was 66% (95% CI, 49% to 82%). This was significantly higher than the predicted percentage of subjects with an acute health care visit for asthma among the group with sensitization and exposure to cockroach but not mouse (28%; 95% CI, 16% to 40%; P <.01) but not when compared with subjects with sensitization and exposure to mouse but not cockroach (52%; 95% CI, 42% to 63%; P =.10; see Fig E1 in this article’s Online Repository at www.jacionline.org). The predicted prevalence of bronchodilator reversibility among those sensitized and exposed to both cockroach and mouse was 38% (95% CI, 20% to 56%). This was much higher than the predicted prevalence of bronchodilator reversibility for those sensitized and exposed to cockroach but not mouse (13%; 95% CI, 3% to 23%; P =.03) but not significantly higher than for those sensitized and exposed to mouse but not cockroach (30%; 95% CI, 19% to 41%; P =.69).
DISCUSSION
Although multicenter studies have repeatedly identified both cockroach and mouse as the major allergens contributing to asthma morbidity in urban children,5, 6, 15 in this study we focused on a single urban community and found that, even though there are high concentrations of both mouse and cockroach allergens, mouse allergen has a greater effect on asthma health than cockroach allergen. These findings demonstrate that pest allergens that have the greatest public health relevance in one urban community might be less relevant in other communities and highlight the importance of understanding the community-specific allergen or allergens of public health relevance to inform both patient care and community-level strategies aimed at reducing asthma morbidity.
Although it is well documented that different allergens might be more or less abundant in different cities because of variations in climate and ecology, whether the abundant allergens are also the allergens of greatest public health relevance is unclear. Multicenter inner-city studies have found that cockroach allergen is most abundant in cities such as Chicago, New York, and the Bronx, whereas dust mite is the most prevalent allergen in Seattle and Tucson, and mouse allergen is nearly ubiquitous in Boston, New York, and Chicago.5, 6, 15 Allergens have even been shown to vary at the neighborhood level within a particular city.16 Clearly, if a particular allergen is not present or not very abundant in a particular city, it is not likely of great relevance. However, our findings suggest that identifying allergens of relevance for a particular city or community is more complex than simply identifying the most abundant allergens in a particular location. Specifically, previous work9, 15 suggests that both cockroach and mouse allergen exposure would be strongly associated with worse asthma in a community such as Baltimore, where these allergens are present in high levels and the prevalence of sensitization to these allergens is also high. However, we found that mouse allergen exposure and sensitization was strongly and consistently associated with worse asthma outcomes, whereas cockroach allergen exposure and sensitization had comparatively less effect on asthma.
In our study mouse allergen sensitization and exposure was most strongly correlated with asthma outcomes, such as increased health care use, worse lung function, pulmonary inflammation, and increased bronchodilator reversibility. The combination of sensitization and exposure to mouse allergen and cockroach allergen generally led to worse asthma outcomes than sensitization and exposure to either allergen individually. However, even among those who were sensitized and exposed to both cockroach and mouse, mouse appeared to be the stronger driver of worse asthma. The importance of mouse allergen was also supported by the consistent and strong associations between mouse-specific IgE levels and a range of asthma outcomes, whereas there were no associations between cockroach-specific IgE levels and these outcomes. Although the reasons for the importance of mouse allergen exposure are not entirely clear, it is noteworthy that mouse allergen levels are comparatively higher in bed dust samples than cockroach allergen levels and that the effects of bed-related mouse allergen exposure are more striking than the effects of bedroom floor exposure, suggesting that the site of exposure might have an important role in determining the health effects of an allergen.19
Although several inner-city studies have reported associations between cockroach allergen and asthma morbidity,15, 17 most were multicenter studies that did not report on the variability in relationships between cockroach sensitization and exposure and asthma morbidity across sites. Therefore it is not clear whether the relationships between sensitization and exposure to cockroach and asthma morbidity were present across all sites. Furthermore, these studies did not control for the presence of sensitization and exposure to mouse allergen, suggesting that perhaps cockroach allergen has a less substantial effect on asthma morbidity than previously thought. Because mouse allergen has also been associated with asthma morbidity in other studies (even after controlling for the presence of cockroach allergen in one study6), it is possible that controlling for the presence of mouse allergen might have altered the results of these previous studies.
Identification of the allergens of greatest public health relevance in a community has important implications. In addition to informing the care of patients from that community, this information also serves as a foundation for intervening at the community level in communities with a high asthma burden. Building on our study’s findings in Baltimore, for example, community-wide intervention programs for pest control might help diminish major allergic triggers for asthma exacerbations. Specifically, our study suggests that in Baltimore the greatest benefit would be achieved by targeting mouse infestation, and additionally, targeting cockroach allergen might have some added benefit.
This study had the advantage of being a prospective cohort study with analysis of both sensitization and exposure to allergens that are commonly implicated in causing worse asthma outcomes. Because we had exposure assessments concurrent with asthma outcomes assessments every 3 months, we captured variability in subjects’ asthma outcomes that correlated with variations in exposure. This study was limited to a Baltimore City pediatric and adolescent population with asthma and, as such, might not be generalizable to the entire country. However, determining the community-level specificity of relevant allergens for sensitized children with asthma was the very goal of this study. Furthermore, this study illustrates the importance of identifying the allergens of clinical relevance in an urban community when analyzing the health effects of allergens in asthmatic patients. Our study identifies mouse allergen as a stronger driver of worse asthma than other allergens, even cockroach, in Baltimore City. Because our study population was recruited primarily from a pediatric emergency department and a recruitment database, it might not be representative of Baltimore City children with asthma. However, in another population of Baltimore City children with asthma that was recruited through a health care system and therefore presumably more representative of children with asthma in Baltimore, the health effects of sensitization and exposure to high levels of mouse and cockroach allergen were similar to those seen in this population, although the relative contributions of mouse and cockroach allergen were not explicitly compared.4
In summary, this study provides strong evidence that mouse allergen is the major indoor allergen responsible for asthma morbidity among Baltimore City children. Although cockroach allergen might have some effects on asthma in this population, mouse allergen appears be the stronger driver of worse asthma because it was strongly associated with a range of outcomes, including acute asthma visits, pulmonary inflammation, and lung function. Furthermore, this study underscores the importance of evaluating relevant allergens for asthma health at a community level because not every urban community will have the same allergen profile, as reported in multicenter studies. After identifying relevant allergens for a community, not only can we better identify important triggers for asthma morbidity in specific patient populations, but also we can begin to consider community-level public health interventions aimed at reducing asthma morbidity by targeting the allergen or allergens of greatest public health relevance.
Supplementary Material
FIG E1. Predicted percentage of subjects with an acute care visit in 3 months across cockroach and mouse sensitization and exposure groups. Sensitization and exposure groups using exposure data from bed dust samples are plotted on the x-axis. The predicted percentage of subjects with an acute care visit over 3 months is plotted on the y-axis. Significant comparisons are marked with dashed lines and P values.
TABLE E1. Clinical features of asthma across mouse and cockroach sensitization/exposure groups.
Clinical implications: This study highlights the importance of determining relevant allergens for asthma health at the community level because not every urban community will have the same allergen profile as reported in multicenter studies.
Acknowledgments
Supported by the National Institute of Environmental Health Sciences (P50ES015903, P01ES018176), the Environmental Protection Agency (R832139), the National Institute of Allergy and Infectious Diseases (R01AI070630 and U01AI083238), and the Johns Hopkins University School of Medicine General Clinical Research Center (grant no. M01-RR00052) from the National Center for Research Resources/National Institutes of Health.
Abbreviations
- FENO
Fraction of exhaled nitric oxide
- FVC
Forced vital capacity
- PR
Prevalence ratio
Footnotes
Disclosure of potential conflict of interest: R. D. Peng has received royalties from Springer Publishing. G. B. Diette has been supported by one or more grants from the National Institutes of Health (NIH)/National Institute of Environmental Health Sciences/Environmental Protection Agency and has consultancy arrangements with GlaxoSmithKline and Fenzian. E. C. Matsui has been supported by one or more grants from the NIH and has received a Phadia Research Form Award. The rest of the authors declare that they have no relevant conflicts of interest.
References
- 1.Moorman JE, Zahran H, Truman BI, Molla MT, Centers for Disease Control and Prevention (CDC) Current asthma prevalence—United States, 2006–2008. MMWR Surveill Summ. 2011;60(suppl):84–6. [PubMed] [Google Scholar]
- 2.Centers for Disease Control and Prevention. Vital signs: asthma prevalence, disease characteristics, and self-management education—United States, 2001–2009. MMWR Morb Mortal Wkly Rep. 2011;60:547–52. [PubMed] [Google Scholar]
- 3.Torjusen E, Saams J, Peng R, Breysse P, Diette G, Matsui EC. Mouse allergen exposure is associated with increased exhaled nitric oxide levels and decreased lung function among mouse sensitized children with asthma [abstract] J Allergy Clin Immunol. 2010;125(Suppl 2):AB125. [Google Scholar]
- 4.Matsui EC, Eggleston PA, Buckley TJ, Krishnan JA, Breysse PN, Rand CS, et al. Household mouse allergen exposure and asthma morbidity in inner-city preschool children. Ann Allergy Asthma Immunol. 2006;97:514–20. doi: 10.1016/S1081-1206(10)60943-X. [DOI] [PubMed] [Google Scholar]
- 5.Phipatanakaul W, Eggleston PA, Wright EC, Wood RA, National Cooperative Inner-City Asthma Study Mouse allergen II. The relationship of mouse allergen exposure to mouse sensitization and asthma morbidity in inner-city children with asthma. J Allergy Clin Immunol. 2000;106:1075–80. [Google Scholar]
- 6.Pongracic JA, Visness CM, Gruchalla RS, Evans R, 3rd, Mitchell HE. Effect of mouse allergen and rodent environment intervention on asthma in inner-city children. Ann Allergy Asthma Immunol. 2008;101:35–41. doi: 10.1016/S1081-1206(10)60832-0. [DOI] [PubMed] [Google Scholar]
- 7.Donohue KM, Al-alem U, Perzanowski MS, Chew GL, Johnson A, Divjan A, et al. Anti-cockroach and anti-mouse IgE are associated with early wheeze and atopy in an inner-city birth cohort. J Allergy Clin Immunol. 2008;122:914–20. doi: 10.1016/j.jaci.2008.08.034. [DOI] [PMC free article] [PubMed] [Google Scholar]
- 8.Squillace SP, Sporik RB, Rakes G, Couture N, Lawrence A, Merriam S, et al. Sensitization to dust mites as a dominant risk factor for asthma among adolescents living in central Virginia. Multiple regression analysis of a population-based study. Am J Respir Crit Care Med. 1997;156:1760–4. doi: 10.1164/ajrccm.156.6.9704026. [DOI] [PubMed] [Google Scholar]
- 9.Wang J, Visness CM, Calatroni A, Gergen PJ, Mitchell HE, Sampson HA. Effect of environmental allergen sensitization on asthma morbidity in inner-city asthmatic children. Clin Exp Allergy. 2009;39:1381–9. doi: 10.1111/j.1365-2222.2009.03225.x. [DOI] [PMC free article] [PubMed] [Google Scholar]
- 10.Almqvist C, Larrson PH, Egmar AC, Hedren M, Malmberg P, Wickman M. School as a risk environment for children allergic to cats and a site for transfer of cat allergen to homes. J Allergy Clin Immunol. 1999;103:1012–7. doi: 10.1016/s0091-6749(99)70172-7. [DOI] [PubMed] [Google Scholar]
- 11.Almqvist C, Wickman M, Perfetti L, Berglind M, Renström A, Hedren M, et al. Worsening of asthma in children allergic to cats, after indirect exposure to cat at school. Am J Respir Crit Care Med. 2001;163:694–8. doi: 10.1164/ajrccm.163.3.2006114. [DOI] [PubMed] [Google Scholar]
- 12.Bollinger MA, Eggleston PA, Flanagan E, Wood RA. Cat antigen in homes with and without cats may induce allergic symptoms. J Allergy Clin Immunol. 1996;97:907–14. doi: 10.1016/s0091-6749(96)80064-9. [DOI] [PubMed] [Google Scholar]
- 13.Institute of Medicine Committee on the Assessment of Asthma and Indoor. Clearing the air: asthma and indoor air exposures. Washington (DC): Institute of Medicine; 2000. [Google Scholar]
- 14.Sporik R, Holgate ST, Platts-Mills TA, Cogswell JJ. Exposure to house-dust mite allergen (Der p I) and the development of asthma in childhood. A prospective study. N Engl J Med. 1990;323:502–7. doi: 10.1056/NEJM199008233230802. [DOI] [PubMed] [Google Scholar]
- 15.Gruchalla RS, Pongracic J, Plaut M, Evans R, 3rd, Visness CM, Walter M, et al. Inner City Asthma Study: relationships among sensitivity, allergen exposure, and asthma morbidity. J Allergy Clin Immunol. 2005;115:476–85. doi: 10.1016/j.jaci.2004.12.006. [DOI] [PubMed] [Google Scholar]
- 16.Olmedo O, Goldstein IF, Acosta L, Divjan A, Rundle AG, Chew GL, et al. Neighborhood differences in exposure and sensitization to cockroach, mouse, dust mite, cat, and dog allergens in New York city. J Allergy Clin Immunol. 2011;128:284–92.e7. doi: 10.1016/j.jaci.2011.02.044. [DOI] [PMC free article] [PubMed] [Google Scholar]
- 17.Sheehan WJ, Rangsithienchai PA, Wood RA, Rivard D, Chinratanapisit S, Perzanowski MS, et al. Pest and allergen exposure and abatement in inner-city asthma: a work group report of the American Academy of Allergy, Asthma & Immunology Indoor Allergy/Air Pollution Committee. J Allergy Clin Immunol. 2010;125:575–81. doi: 10.1016/j.jaci.2010.01.023. [DOI] [PMC free article] [PubMed] [Google Scholar]
- 18.Rosenstreich DL, Eggleston P, Kattan M, Baker D, Slavin RG, Gergen P, et al. The role of cockroach allergy and exposure to cockroach allergen in causing morbidity among inner-city children with asthma. N Engl J Med. 1997;336:1356–63. doi: 10.1056/NEJM199705083361904. [DOI] [PubMed] [Google Scholar]
- 19.Torjusen EN, Diette GB, Breysse PN, Curtin-Brosnan J, Aloe C, Matsui EC. Dose-response relationships between mouse allergen exposure and asthma morbidity among urban children and adolescents. Indoor Air. 2012 doi: 10.1111/ina.12009. [Epub ahead of print] [DOI] [PMC free article] [PubMed] [Google Scholar]
- 20.Eggleston PA, Rosenstreich D, Lynn H, Gergen P, Baker D, Kattan M, et al. Relationship of indoor allergen exposure to skin test sensitivity in inner-city children with asthma. J Allergy Clin Immunol. 1998;102:563–70. doi: 10.1016/s0091-6749(98)70272-6. [DOI] [PubMed] [Google Scholar]
- 21.Matsui EC, Wood RA, Rand C, Kanchanaraksa S, Swartz L, Curtin-Brosnan J, et al. Cockroach allergen exposure and sensitization in suburban middle-class children with asthma. J Allergy Clin Immunol. 2003;112:87–92. doi: 10.1067/mai.2003.1588. [DOI] [PubMed] [Google Scholar]
- 22.Ingram JM, Sporik R, Rose G, Hosinger R, Chapman MD, Platts-Mills PA. Quantitative assessment of exposure to dog (Can f 1) and cat (Fel d 1) allergens: relationship to sensitization and asthma among children living in Los Alamos, New Mexico. J Allergy Clin Immunol. 1995;96:449–56. doi: 10.1016/s0091-6749(95)70286-5. [DOI] [PubMed] [Google Scholar]
Associated Data
This section collects any data citations, data availability statements, or supplementary materials included in this article.
Supplementary Materials
FIG E1. Predicted percentage of subjects with an acute care visit in 3 months across cockroach and mouse sensitization and exposure groups. Sensitization and exposure groups using exposure data from bed dust samples are plotted on the x-axis. The predicted percentage of subjects with an acute care visit over 3 months is plotted on the y-axis. Significant comparisons are marked with dashed lines and P values.
TABLE E1. Clinical features of asthma across mouse and cockroach sensitization/exposure groups.