

Abstract
Over the past decade chemical tags have been developed to complement the use of fluorescent proteins in live cell imaging. Chemical tags retain the specificity of protein labeling achieved with fluorescent proteins through genetic encoding, but provide smaller, more robust tags and modular use of organic fluorophores with high photon-output and tailored functionalities. The trimethoprim-based chemical tag (TMP-tag) was initially developed based on the high affinity interaction between E.coli dihydrofolatereductase and the antibiotic trimethoprim and subsequently rendered covalent and fluorogenic via proximity-induced protein labeling reactions. To date, the TMP-tag is one of the few chemical tags that enable intracellular protein labeling and high-resolution live cell imaging. Here we describe the general design, chemical synthesis, and application of TMP-tag for live cell imaging. Alternative protocols for synthesizing and using the covalent and the fluorogenic TMP-tags are also included.
Keywords: chemical tag, fluorescence microscopy, live cell imaging, protein label
INTRODUCTION
Over the past two decades the development of fluorescent proteins (FPs) as selective, genetic protein tags has revolutionized the way protein function and dynamics is studied in intact cells (Chalfie et al. 1994, Heim et al. 1994). The original green fluorescent protein (GFP) from A. victoria is a 238 amino acid protein, which, upon folding, spontaneously forms a fluorescent chromophore by rearrangement and oxidation of Ser, Tyr, and Gly residues in the core of the eleven-stranded β-barrel (Ormo et al. 1996, Tsien 1998). Since these original reports, naturally occurring and engineered FPs have been routinely used to observe the timing and location of protein expression in living cells, often providing significant mechanistic insight (Tsien 1998, Giepmans et al. 2006, Shaner et al. 2007). Although FPs continue to be invaluable tools for cell biology, they have limitations for more sophisticated biophysical and mechanistic studies. Thus, chemical tags have been developed as an alternative for labeling proteins with modular organic fluorophores directly in living cells, opening the possibility of labeling proteins with fluorophores that have high photon output and/or special photophysical properties (Jing and Cornish 2011).
With chemical tags, rather than tagging the target protein with a FP, the protein is tagged with a polypeptide, which is subsequently modified with an organic fluorophore (Griffin et al. 1998, Keppler et al. 2003, Fernandez-Suarez et al. 2008). The trimethoprim-based chemical tag (TMP-tag, see Figure 1A) relies on the high-affinity interaction between E. coli dihydrofolatereductase (eDHFR) and the folate analogtrimethoprim (TMP) (Miller et al. 2005, Calloway et al. 2007). In brief, the target protein is tagged with eDHFR, which binds TMP with high affinity (~ 1 nM KD) and selectivity (affinities for mammalian DHFRs are KD> 1 μM) (Roth et al. 1981, Baccanari et al. 1982). Organic fluorophores can be conjugated to TMP with only minor perturbation of the high-affinity binding to eDHFR (Miller et al. 2005). Among numerous chemical tags reported in the past decade, TMP-tag is one of the few chemical tags that can label proteins with high efficiency and selectivity both in vitro and inside of live cells.
Figure 1.
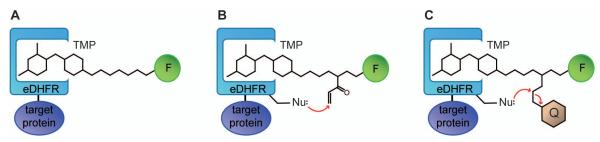
Cartoon of TMP-tags. (A) Non-covalent TMP-tag is based on the high-affinity interaction between E. coli dihydrofolatereductase (eDHFR) and the antibiotic trimethoprim (TMP). The target protein (purple) is tagged with eDHFR (blue) and then labeled with a cell-permeable TMP-fluorophore (F) heterodimer. (B) The TMP-tag is rendered covalent by installing a nucleophilic amino acid near the binding pocket to react with a latent electrophile (acrylamide) when TMP binds to eDHFR. (C) The fluorogenic TMP-tag centers a TMP-quencher (Q) –fluorophore (F) heterotrimer. When TMP binds to eDHFR, the nucleophilic amino acid near the binding pocket initiated a proximity-induced SN2 reaction that cleaves the electrophile attached to the quencher and thus switches on the fluorophore.
To complement the use of the original non-covalent TMP-tag, a covalent variant was later engineered by installing a unique Cys residue on eDHFR in position to react with a latent acrylamide electrophile added to the TMP-probe molecule via a classic proximity-induced Michael addition (Figure 1B) (Gallagher et al. 2009). Upon optimization, the second generation covalent TMP-tag undergoes rapidly, quantitative covalent labeling (in vivo t1/2 ~ 10 min) and enables imaging of various intracellular proteins with distinct subcellular localization (Chen et al. 2012). Moreover, the covalent TMP-tag has also been shown to be compatible with a series of fluorophores with different colors and enable specific labeling in both live and fixed cells. See Strategic Planning for a discussion of advantages of the various types of covalent vs. non-covalent tags.
For another remarkable advancement, the TMP-tag has recently been rendered fluorogenic (also covalently linked to the target protein) via a proximity-induced SN2 reaction initiated by the same Cys nucleophile on eDHFR, replacing an electrophilic leaving group attached to a quencher in the TMP-quencher-fluorophore heterotrimer (Figure 1C) (Jing and Cornish, manuscript in revision). In vitro characterization confirmed the covalent labeling and fluorescence switching is highly specific and efficient, with in vitro t1/2 ~ 10 min and 20-fold fluorescence enhancement. In live cell imaging experiments the fluorogenic TMP-tag displays significantly reduced background fluorescence from unbound or non-specifically bound fluorophores and thus increases the signal-to-background, crucial for high-resolution imaging. Notably, the fluorogenic TMP-tag achieved the demanding goal of not only labeling highly abundant, localized intracellular proteins, but also less abundant, more dynamic cytoplasmic proteins.
As a viable surrogate to FPs, the TMP-tag labels intracellular proteins with modular synthetic probes, enabling sophisticated biophysical experiments that are hard or impossible with FPs. The TMP-tag has been successfully applied for super-resolution imaging of histone dynamics in live cells (Wombacher et al. 2010); single molecule detection of spliceosome assembly in yeast cell extract (Hoskins et al. 2011); and chromophore-assisted laser inactivation of intracellular protein (Cai et al. 2010). Beyond fluorescent microscopy, the TMP-tag has also been used to construct chemically induced protein dimerizer and conjugated to magnetic nanoparticles for protein and cell manipulation (Czlapinski et al. 2008, Long et al. 2011). Several examples of biological applications are further discussed in the Commentary.
In this unit we present the general design as well as detailed protocols for synthesizing and using the TMP-tag for live cell imaging. In the Strategic Planning section a generic workflow is laid out with focus on choosing the appropriate TMP-tag for the specific biophysical application. Then in the Basic Protocol we describe the synthesis and application of the non-covalent TMP-tag with a far-red fluorescent probe. Two variations, the synthesis and application of covalent and fluorogenic TMP-tags with different fluorophores are included in Alternate Protocols. Since the TMP-tag is modular, these protocols can be readily adapted to incorporate virtually any synthetic probe. Examples of biological applications of TMP-tag along with potential variations on critical parameters are covered in the Commentary section.
STRATEGIC PLANNING
Technically, labeling a target protein with the TMP-tag is very similar to labeling with FPs (Figure 2): a plasmid encoding a fusion target protein with eDHFR is constructed using standard molecular cloning techniques and then is introduced into the desired cell. The transfected cells are briefly incubated with the TMP-fluorophore conjugate, which diffuses into cells and is then specifically bound by or conjugated to the eDHFR tag. Together, the TMP-tag retains the specificity of protein labeling achieved with FPs through genetic encoding, but provides a slightly smaller, more robust tag and modular use of organic fluorophores with high photon output and tailored functionalities.
Figure 2.

General workflow of live cell imaging with TMP-tag.
Choice of TMP-tags
Three types of TMP-tags have been developed to enable selective protein labeling both in vitro and inside of living cells: the non-covalent TMP-tag, the covalent TMP-tag, and the covalent fluorogenic TMP-tag. Choice of the appropriate form of TMP-tag depends on the specific biological application.
To tag a protein using the non-covalent TMP-tag, the target protein is fused to wild type eDHFR which binds TMP-fluorophore via non-covalent interaction (Figure 1A). The advantage of non-covalent TMP-tag is that the TMP-fluorophore is straightforward to prepare and optimize. Important for adoption by laboratories not specializing in organic synthesis, some TMP-fluorophore heterodimers are commercially available from Active Motif. The non-covalent TMP-tag has been demonstrated to be a robust reagent for a variety of live cell imaging (see Commetary section for examples). Nevertheless, because the TMP-fluorophore slowly dissociates from eDHFR (dissociation t1/2 ~ tens of minutes), the fluorescence signal from non-covalent TMP-tag gradually diminishes after washout. Therefore, to monitor a target protein in live cells for long period of time (> 24 h), it is recommended to use the covalent TMP-tag instead. Additionally, the non-covalent TMP-tag is not compatible with cell fixation or other treatment that may interrupt the TMP/eDHFR interaction.
The covalent TMP-tag relies on the proximity-induced Michael addition between the eDHFR:L28C variant and the acrylamide-TMP-fluorophoreheterotrimer (A-TMP-fluorophore). After A-TMP-fluorophore binds to eDHFR:L28C, the Cys nucleophile specifically attacks the acrylamide group to create a covalent bond (Figure 1B). The covalent TMP-tag may provide higher labeling efficiency and thus higher signal-to-background compared to the non-covalent TMP-tag. Moreover, the covalent TMP-tag is especially favorable for those applications that require permanent labeling, such as time-lapse imaging, pulse-chase experiment, pull-down assay, and fixed cell imaging etc. On the other hand, the covalent TMP-tag with high reactivity is currently not commercially available. And several extra steps are required to prepare both A-TMP-fluorophore and eDHFR:L28C vector, compared to the non-covalent TMP-tag.
The fluorogenic TMP-tag centers a trimeric TMP-quencher-fluorophoremolecule (TMP-Q-fluorophore) with the Black Hole Quencher 1 (BHQ1) attached to an electrophilic leaving group that, upon TMP binding to eDHFR:L28C, would be cleaved by the Cys nucleophile (Figure 1C). The fluorogenic TMP-tag provides a covalent label with reduced background fluorescence, which particularly benefits high resolution live cell imaging. Significantly, the fluorogenic design minimizes non-specific background staining of cellular compartments often observed for the highly charged, high photon-output fluorophores (see following section). For maximal efficiency and signal-to-background, the fluorogenic TMP-tag needs to be carefully designed and optimized. Additionally, the fluorogenic TMP-tag tends to hydrolyze in alkaline condition and thus requires specific precautions during synthesis and handling. (See Alternate Protocol 2 for details.)
Choice of fluorophores
Although hundreds of organic fluorophores have been developed for in vitro biophysical studies, very few of them are suitable for live cell imaging. Generally, a robust fluorophore for high resolution live cell imaging should have (1) sharp excitation and emission spectra in the visible or infra-red (IR) region; (2) high photon output (the total number of photons emitted by a fluorophore before photo-bleaching); (3) photo-physical properties compatible with the cellular environment; and (4) excellent cell permeability and, perhaps even more important although less well understood, specific behavior once inside the cell, i.e. not binding to cellular components or partitioning to lipid-rich or charged compartments. For most commercially available fluorophores, photo-physical data such as excitation and emission spectra, extinction coefficient and quantum yield are available in literature (Lavis and Raines 2008, Dempsey et al. 2011) or from suppliers. The cell permeability of a dye and its behavior inside of cells, on the other hand, usually needs to be evaluated practically (Longmire et al. 2008).
An ideal fluorophore for live cell imaging should have sharp excitation and emission spectra in the visible to IR region with a large Stokes shift (> 20 nm). Ultraviolet (UV) light can be used for excitation but may cause photo-damage to cells. Far-red and IR fluorophores are favorable for deep tissue imaging. However, some commercial fluorescence microscopes do not have built-in IR lasers and detectors and thus need to be customized for fluorophores with λex exceeding 700 nm. For multi-color imaging it is desirable to use a set of spectrally resolvable fluorophores. If spectral crosstalk is unavoidable, a multispectral imaging fluorescence microscope can help to distinguish fluorophores with overlapping excitation and emission spectra while potentially compromising temporal- and/or spatial-resolution.
A high photon output dye is crucial for high resolution live cell imaging, especially when labeling low-abundance cytosolic proteins. Unfortunately, rigorous and systematic evaluations of total photon output under conditions compatible with live cell imaging have only been reported for very few synthetic fluorophores (Kasper 2007). In practice most organic fluorophores are usually characterized in terms of the extinction coefficient (ε), the quantum yield (QY), photon flux (number of photons emitted during a given period of time) and photo-stability (measured as survival rate after a certain period of time or photo-bleaching decay constant). For most commercially available fluorophores ε and QY values are available from suppliers. The photon flux and photo-stability data, on the other hand, strongly depends on the experimental setup (laser power, buffer, O2 concentration etc.) and therefore are only comparable if two dyes are measured under exactly the same condition (Dempsey et al. 2011). In general, the cyanine dyes (e.g. Cy3, Cy5, Alexa647); rhodamines (e.g. Rhodamine 6G, Tetramethylrhodamine, TexasRed); and oxazine dyes (e.g. Atto655, Atto680) are considered to be among the brightest and most photo-stable fluorophores, while some organic fluorophores, e.g. fluorescein, may have remarkable ε and QY but are prone to photo-bleaching, and thus are not recommended for single-molecule imaging or particle tracking.
Unlike photo-physical parameters, there is no well-established measurement for cell permeability or dye behavior inside of cells, and these properties vary significantly from one cell line to another. Generally, a small hydrophobic probe with positive charge or no net charge under physiological condition is potentially cell permeable. Therefore it is recommended to transform the carboxyl groups to esters that can be enzymatically cleaved inside live cells (see Alternate Protocol 1 for example). Notably, a hydrophobic probe with positive charge may be readily cell permeable, but tends to aggregate and bind to subcellular compartments and thus develop high level of background fluorescence. In such case it is suggested to use the fluorogenic TMP-tag that minimizes non-specific staining.
Finally, the photo-physical properties and biological activities of a fluorophore may be significantly influenced by the chemical tag, target protein and cell line used. For a particular biological application, a trial-and-error process may be necessary to find the best chemical tag-dye combination. Therefore we recommend starting with TMP-tags that have been proven to label intracellular proteins with high signal-to-background (see Table 1 in the Commentary section). When trying a new fluorophore, a general guide for optimization is provided in the Commentary section.
Table 1.
TMP-tags with various fluorophores for live cell imaging.
| Chemical Tag | Fluorophore | Protein of Interest | Reference |
|---|---|---|---|
|
Non-covalent
TMP-tag |
BODIPY texas red | Plasma membrane (inner surface); cell nucleus. |
(Miller et al. 2005) |
| Fluorescein (protected) |
Myosin light chain (MLC); cell nucleus. |
(Miller et al. 2005, Cai et al. 2010) | |
| Hexachlorofluorescein (protected) |
Myosin light chain kinase; α-tubulin. |
(Calloway et al. 2007) | |
| Atto655 | Histone protein 2B (H2B). |
(Wombacher et al. 2010) | |
| Cy3 | Spliceosome in yeast cell extract. |
(Hoskins et al. 2011) | |
| Terbium complex | Plasma membrane (outer surface). |
(Rajapakse et al. 2009) | |
|
| |||
|
Covalent
TMP-tag |
Fluorescein (protected) |
H2B; TOMM20; MLC, α- actinine. |
(Gallagher et al. 2009, Chen et al. 2012) |
| Dapoxyl | H2B; plasma membrane. |
(Chen et al. 2012) | |
| Atto655 | H2B; plasma membrane. |
(Shaner et al. 2007) | |
|
| |||
|
Fluorogenic
(and covalent) TMP-tag |
Fluorescein (protected) |
H2B; plasma membrane (inner surface). |
(manuscript in revision) |
| Atto520 | H2B; TOMM20; MLC, α- actinine. |
(manuscript in revision) | |
Construction of target protein-eDHFR fusion
The eDHFR label can be fused to target protein on either N- or C-terminus, whichever does not interrupt the function and dynamics of the target protein. A flexible linker such as Gly- and Ser-rich sequence (GSG)n is usually placed between the eDHFR and target protein. The vector DNA encoding the target protein-eDHFR fusion can be constructed using standard molecular cloning techniques as outlined below. The eDHFR gene is available from multiple commercial sources (e.g. Addgene Cat# 20214; Active Motif Cat#34001).
Cell transfection
A variety of commercial reagent kits are available for both transient and stable transfection of mammalian cells. For a particular cell line the transfection protocol needs to be individually optimized following the manufacturer’s instruction. We recommend FuGene HD transfection kit for HEK 293T, HeLa, and COS7 cells, while for NIH 3T3, MEF, and CV1 cells electroporation usually gives much higher transfection efficiency than transfection reagents. A plasmid encoding nuclear-localized GFP (such as H2B-EGFP) is a useful control for optimizing the transfection protocol. Generally speaking, once a transfection protocol is optimized for a certain cell line, it should allow all kinds of plasmids to be introduced. When labeling cytosolic proteins with the TMP-tag it is also recommended to co-transfect the cells with H2B-EGFP or H2B-mCherry, whichever is spectrally resolvable with the TMP-tag, to indicate the transfection efficiency.
BASIC PROTOCOL: SYNTHESIS AND APPLICATION OF NON-COVALENT TMP-TAG FOR LIVE CELL IMAGING
Introduction
This protocol describes the synthesis of non-covalent TMP-Atto655 (compound1), the construction of an H2B-eDHFR vector, and live cell imaging in HEK 293T cells. The chemical synthesis is summarized in Figure 3. An example of anticipated image is displayed in Figure 4. The general procedures also apply to other fluorophores, target proteins and cell lines, potentially with some modification in details, as discussed in the Strategic Planning and Commentary sections.
Figure 3.

Synthetic route of compound 1 TMP-Atto655.
Figure 4.
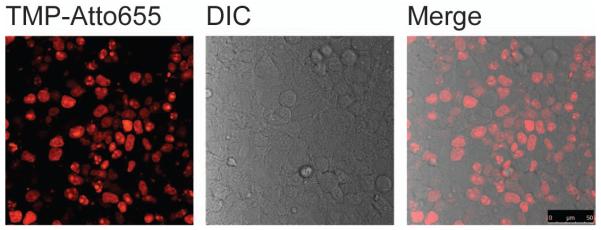
Live cell imaging of H2B labeled with non-covalent TMP-tag. The left image shows expected result of fluorescence imaging of H2B in live HEK 293T cells using TMP-Atto655. The middle image is from differential interference contrast (DIC) channel. The right image is obtained by merging the Atto655 channel with the DIC channel. Scale bar is 50 μm.
Material List
Synthesis reagents
Trimethoprim (Sigma-Aldrich Cat#T7883)
Hydrobromic acid (HBr)
Sodium hydroxide
Ammonium hydroxide
pH papers
Deuterated methanol (CD3OD)
Ethyl 5-bromovalerate
Anhydous N,N-dimethylformamide (DMF) in sure-seal bottle
Potassium carbonate (K2CO3)
Brine (saturated NaCl water solution)
Sodium sulfate (Na2SO4)
Ethyl acetate (EtOAc) for chromatography
Methanol (MeOH) for chromatography
Dichloromethane (DCM) for chromatography
Hydrochloric acid (HCl)
Deuterated dimethyl sulfoxide (DMSO-d6)
Boc-1-amino-4,7,10-trioxa-13-tridecanamine (BocNH-PEG-NH2), CAS: 194920-62-2
Benzotriazol-1-yl-oxytripyrrolidinophosphonium hexafluorophosphate (PyBOP)
N,N-Diisopropylethylamine (DIEA)
Trifluoroacetic acid (TFA)
Atto655-NHS ester (Sigma-Aldrich Cat#76245)
Acetonitrile (MeCN) for HPLC
Millipore-purified water
Silica gel
Compressed Ar
Other reagents
PCR primers
DNA polymerase (PfuUltra II, Agilent Technologies Cat#600670)
PCR buffer (supplied with DNA polymerase)
Deoxynucleoside triphosphate (dNTPs)
H2B-GFP vector (Addgene Cat#11680)
AgeI and NotI restriction endonucleases
Agarose for electrophoresis
TAE buffer (see Regaents and Solutions for recipe)
T4 DNA ligase
E.coli (TG1) competent cells (Lucigen Cat#60502)
LB agar plates with 50 mg/L Kanamycin
LB media with 50 mg/L Kanamycin
Plasmid mini-prep and maxi-prep kits (Qiagen Cat#27106; #12663)
HEK 293T cells
Cell transfection kit
DMEM - Dulbecco’s Modified Eagle Medium (Gibco Cat#11995)
Fetal bovine serum (FBS)
100X Penicillin/Streptomycin solution
Phosphate buffered saline (PBS, see Reagents and Solutions for recipe)
Trypsin
Chemical synthesis apparatus
Round-bottomed flasks (50–500 mL) and rubber septa
Graduated cylinders
Erlenmeyer flasks (100 – 500 mL)
Beakers (100 – 500 mL)
Disposable glass Pasteur pipettes and pipette bulbs
Water-cooled condensation tube
Hot plate magnetic stirrer with contact thermometer oil bath
Fume hood
Columns for chromatography
Analytical thin-layer chromatography (TLC) plates (250-μm thickness)
Fritted filter funnel
Dual nitrogen-vacuum manifold with vacuum pump
Separatory Funnels (100 – 300 mL)
Rotary evaporator
Electronic oven
Syringes and needles
Aluminum foil
Stirbars of various sizes
Other instruments and materials
Pipet and tips
Thermal cycler (PCR machine)
Gel electrophoresis apparatus and power supply
37 °C E.coli incubator
37 °C TC incubator supplied with 5% CO2
Tissue culture hood
10-cm petri dishes for tissue culture
8-well chambered cover slip
Fluorescence microscope
Synthesis of TMP-Atto655 conjugate
Appropriate personal protective equipment (eg. gloves, lab coats, goggles and fume hoods) must be used for all synthetic works
1. Synthesis of intermediate 2 TMP-OH
To a 500 mL two-neck round-bottomed flask equipped with water-cooled condenser and a thermometer, add HBr (214 mL, 48 % w/w in water) followed by trimethoprim (17.15 g, 60 mmol). Reflux the solution under air for 20 min while maintaining the reaction temperature at 95 °C. Then transfer the flask to an ice bath and partially neutralize the solution by carefully adding NaOH (51 mL, 50 %, w/w) while actively stirring. Stop the agitation and allow the solution to cool to room temperature and then place at 4 °C overnight; this should result in beige needle-like crystals. Filter the crystals from solution and recrystallize by dissolving in a minimal amount of cold water, which is then neutralized to pH 7 with NH3·H2O. Chill the solution at 4 °C, and filter the resulting pure crystals to yield compound 2 (expected 9.130 g, 33.0 mmol, 56 % yield). 1H NMR (400 MHz, CD3OD, 25 °C): δ=7.51 (s, 1 H), 6.63 (s, 2 H), 3.85 (s, 6 H), 3.65 (s, 2H). HSMS (FAB+) m/z Calcd. for C13H16O3N4 [M+H]+:277.1222. Found: 277.1312.
It is crucial to control the reaction condition so that trimethoprim is not over-hydrolyzed. The key factors are reaction temperature (95 °C), reaction time (< 20 min), and pH for recrystallization (7.0). Multiple rounds of recrystallization may be necessary in order to obtain pure product. Impurities can be readily detected by NMR. Only two singlet peaks (δ=7.51, 1 H; 6.63, 2H) should show up in the aromatic region for pure product. Extra aromatic protons may indicate by-products.
The 48% HBr and 50% NaOH solutions are extremely corrosive and must be handled and prepared with extra caution. Do not store 50% NaOH solution in glass container for long-term storage. The neutralization of HBr by NaOH is highly exothermic and must be performed carefully with the reaction misture actively stirred in ice bath.
2. Synthesis of intermediate 3 TMP-COOEt
In a 100 mL round-bottomed flask, dissolve intermediate 2 (1.381 g, 5 mmol) in DMF (15 mL) and then add K2CO3 (3.46 g, 25 mmol) and ethyl 5-bromovalerate (1.58 mL, 10 mmol). The TMP-OH and ethyl 5-bromovalerate will dissolve in DMF while the K2CO3 only partially dissolves, resulting a white suspension. Heat the reaction mixture in 70 °C oil bath under Ar for 5 h while stirring, during which the solution may turn yellow or slightly brown. After cooling to room temperature, extract the reaction mixture with brine (100 mL) and EtOAc (3 × 40 mL). Combine the organic phase; dry over MgSO4 and remove EtOAc by rotary evaporation. Purify the crude product by flash chromatography (MeOH/DCM, 1:10 v/v over silica gel) to yield compound 3 (expected 1.1 g, 2 mmol, 54 % yield; Rf = 0.48 in MeOH/DCM, 1:10 v/v). 1H NMR (400 MHz, CD3OD, 25 °C): δ=7.50 (s, 1 H), 6.51 (s, 2 H), 4.11 (q, J = 9.6 Hz, 2H), 3.89 (t, J = 8.0 Hz, 2H) 3.77 (s, 6 H), 3.63 (s, 2H), 2.39 (t, J = 8.8 Hz, 2H), 1.86 – 1.65 (m, 4H), 1.23 (t, J = 9.6 Hz, 3H). MS (FAB+) m/z Calcd. for C 20H28O5N4 [M+H]+:405.21. Found: 405.31.
3. Synthesis of intermediate 4 TMP-COOH
In a 100 mL round-bottomed flask, dissolve compound 3 (404 mg, 1 mmol) in methanol (25 mL). Then add NaOH in water (1 N, estimated volume 3 mL) to this solution until a small amount of beige precipitate is formed. Then stir the reaction mixture under air for 4 h and the precipitate should disappear. Then titrate the reaction mixture to pH 4 with HCl (1 N, estimated volume 3 mL) and beige crystals will form from solution. Filter the crystal and wash with brine and water (cooled at 4 °C) to yield compound 4 (expected 290 mg, 0.77mmol, 77%). 1H NMR (DMSO-d6): δ=7.51 (s, 1 H), 6.54 (s, 2 H), 3.77 (t,J = 8.0 Hz, 2 H), 3.70 (s, 6 H), 3.51 (s, 2H), 2.26 (t, J = 9.2 Hz, 2H), 1.67 – 1.62 (m, 4H).MS (FAB+) m/z Calcd. for C18H24O5N4 [M+H]+:377.17. Found:377.42.
4. Synthesis of intermediate 6 TMP-PEG-NH2
Prior to the synthesis, bake a 25 mL round-bottomed flask at 95 °C for 48 h. Right before setting up the reaction, the flask should be further dried by propane flame. Add compound 4 (56 mg, 0.15mmol), BocNH-PEG-NH2 (96 mg, 0.3 mmol, 2 equiv) and PyBOP (155 mg, 0.3mmol, 2 equiv.) to the hot flask and put under vacuum. After the flask cools to room temperature (after approximately 1 h), add DMF (10 mL) and DIEA (130 μL, 0.745 mmol, 5 equiv) to the flask under Ar. Stir the reaction mixture at room temperature overnight and then remove solvent by rotary evaporation and purify the crude product by flash chromatography (MeOH/DCM, 1:30 over silica gel) to yield compound 5 (Rf = 0.33 in DCM/MeOH 15:1 v/v). Then deprotect the BOC group by stirring in TFA in DCM (50 %, v/v) for 1 h and remove solvent by rotary evaporation. The deprotection reaction is quantitative so that the resulting compound 6 (expected 31 mg, 36 % yield in 2 steps) is used for the next step without further purification. 1H NMR for compound 5 (400 MHz, CD3OD, 25 °C): δ=7.24 (s, 1 H), 6.56 (s, 2 H), 3.93 (m, 2 H), 3.81 (s, 6 H), 3.52 (s, 2 H), 3.52–3.50 (m, 12 H), 3.26 (t, J = 6.8 Hz, 2 H), 3.12 (t, J = 6.4 Hz), 2.26 (t, J = 7.2 Hz, 2 H), 1.80 – 1.70 (m, 8 H), 1.43 (s, 9 H). HRMS (FAB+) m/z Calcd. for compound 5 C33H54O9N6 [M+H]+: 679.40. Found: 679.40.
5. Synthesis of compound 1 TMP-Atto655
In a 25 mL round-bottomed flask, mix compound 6 (2.3 mg, 3.9 μmol) with Atto655-NHS ester (1 mg, 1.6 μmol) and DIEA (2.8 μL, 16 μmol) in DMF (1 mL). Stir the reaction mixture overnight under Ar and remove solvent with rotary evaporation. Subsequently purify the crude product (~ 5 mg) by reverse phase HPLC to yield compound 1 (expected 1 mg, 0.95 μmol, 57 %). HPLC condition for C18 semi-prep column: start with 10:90 acetonitrile:water (v/v), gradient elution for 80 min, end with 60:40 acetonitrile:water (v/v). Retention time: 33 – 34 min. 1H NMR (400 MHz, CD3OD, 25 °C) δ=7.79 (d, J = 1.7 Hz, 1H), 7.47 (d, J = 1.5 Hz, 1H), 7.24 (s, 1H), 7.07 (s, 1H), 6.94 (s, 1H), 6.45 (s, 2H), 3.82 (t, J = 6.2 Hz, 1H), 3.77 (m, 2H), 3.7 (s, 6H), 3.67 – 3.53 (m, 18H), 3.51 (m, 2H), 3.23 (m, 2H), 3.06 – 2.90 (m, 4H), 2.52 (dd, J = 13.6, 4.4 Hz, 1H), 2.45 – 2.36 (m, 2H), 2.24 (t, J = 7.4 Hz, 2H), 2.06 (m, 4H), 1.85 – 1.70 (m, 8H), 1.70 – 1.61 (m, 2H), 1.52 (s, 3H), 1.43 (s, 3H), 1.38 (t, J = 7.2 Hz, 7H). MS (FAB+) m/z Calcd. for C55H78O12N9S [M]+: 1088.55. Found: 1089.15
6. Dissolve the final product TMP-Atto655 in DMF or DMSO and determine the concentration by measuring absorbance at 663 nm. The extinction coefficient of Atto655 at 663 nm ε663 = 1.25×10⁵ mol−1cm−1, measured in PBS. It is recommended to prepare a stock solution in DMF or DMSO with concentration of 1 – 5 mM.
The DMSO is less toxic to cells compared to DMF. However, DMF has a low boiling point so that the compound dissolved in DMF can be more easily recovered by rotary evaporation.
The TMP-Atto655 stock solution in DMF or DMSO can be stored at −80 °C for long-term storage or −20 °C for short-term storage (up to 6 months). It is recommended to use amber glass vials sealed by parafilm. Do not store the compound in aqueous solution.
Construction of H2B-eDHFR vector
This is a general workflow for constructing the H2B-eDHFR plasmid using standard molecular cloning technology. For detailed technique please refer to related protocols (Bloch 2001, Kramer and Coen 2001, Voytas 2001, Lohman et al. 2011).
7. Amplify the eDHFR gene via PCR.
Primers:
Forward: 5′ACGTCACCGGTCGCCACCATGGTGGGTTCTGGTGGTTCTGGTATCAGTCTGATTGCGGCG3′ (AgeI); Reverse: 5′ACGTCGCGGCCGCTTTAGTGATGGTGATGGTGATGCCGCCGCTCCAGAATCT3′ (NotI).
The eDHFR gene is commercially available from Active Motif, Inc. (LigandLink pLL-1 kit, Cat#34001) and Addgene (DHFR-myc, Cat#20214)8. Digest the H2B-GFP vector and the amplified eDHFR gene with AgeI and NotI restriction endonucleases. Purify the digested DNA by agarose gel electrophoresis. The expected length for the digested H2B-GFP vector is 5 kb; the eDHFR gene is 500 bp.
9. Ligate the digested vector and eDHFR gene using T4 DNA ligase. Then transform E.coli by electroporation with the ligated vector and plate the cells on LB-Kanamycin plates.
10. Amplify the H2B-eDHFR plasmid and confirm the construction by sequencing (Genewiz, Inc.) the open reading frame region using CMV forward primer (5′ CGCAAATGGGCGGTAGGCGTG 3′). Make sure there is no stop codon or frame shift between H2B and eDHFR.
11. Perform an endo-free plasmid maxi-prep to obtain plasmid in high concentration (~ 1 μg/μL) for mammalian cell transfection.
Cell staining and sample preparation
12. Culture HEK 293T cells in Dulbecco’s Modified Eagle Medium (DMEM, Gibco #11995) supplemented with 10% v/v fetal bovine serum (FBS) and 1% Penicillin/Streptomycin (v/v). All cells are maintained under 5% CO2 at 37 °C.
For standard operation procedure of tissue culture see (Xu 2005)
13. Reseed cells in 8-well chambered cover glass one day prior to transfection. The recommended cell density is ~ 30,000 cells / cm2.
14. Transfect cells by adding the mixture of transfection reagent and DNA into the media. Incubate for 12 – 24 h.
Several commercially available cell transfection kits are known to be highly efficient for HEK 293T cells, including the Lipofectamine (Invitrogen), the XtrmeGene (Roche), and the Fugene HD (Promega). Follow the manufacturer’s instruction to optimize the transfection condition.
15. Prior to cell staining, dilute the TMP-Atto655 to 2 μM in supplemented media (see step 12). Prepare ~ 100 μL TMP-Atto655 in media for every 1 cm2 cell culture.
16. Remove the old media with transfection reagent from the cell culture by aspiration. Gently add the media containing 2 μM TMP-Atto655 to cells. Make sure the solution covers the bottom of the chamber. Then incubate at 37 °C for 1 h. It is recommended to stain cells at 50% – 80% confluence.
The HEK 293T cells do not adhere tightly on the cover slip. Therefore, it is recommended to add and remove media very gently to avoid washing off the cells.
17. Remove the TMP-Atto655 solution by aspirator. Wash the cells by adding 200 μL of fresh media for every 1 cm2 cell culture and incubate at 37 °C for 10 min.
18. Remove the washing media and repeat step 17. Leave 200 μL of fresh media for every 1 cm2 cell culture and the cells are ready for imaging.
It is crucial to keep the cells sterilized during the whole procedure. Contamination with bacteria is harmful to the cells and may introduce non-specific fluorescence, because the TMP-tag binds to E.coli endogenous DHFR with high affinity.
Fluorescence imaging
This is a general guideline for imaging nuclear-localized eDHFR/TMP-Atto655 using the LEICA TCS SP5 confocal microscope with a HCX PL APO CS 20× 0.70 DRY UV objective or a HCX PL APO CS 100× 1.46 OIL objective. The TMP-tag can also be imaged with various confocal, epi-fluorescence, and total internal reflection fluorescence (TIRF) microscopes; variations on the procedures may apply. Refer to manufacturer’s direction for details setting up and using the microscope.
19. Turn on the thermostat and CO2 valve on the CO2 chamber installed on the microscope.
HEK 293T cells can survive at room temperature for a couple of hours without CO2 supply. However, to maintain healthy cells for sophisticated cell biology experiments, it is very important to maintain the temperature (37 °C) and CO2 (5%) concentration during imaging.
20. Turn on the laser cooling system, the laser, the Hg lamp, the microscope, and then start the LAS AF software.
21. Start from 20X dry objective and focus on cells using white light and eyepiece.
22. On the software select 633 nm He-Ne laser and set the photon multiplier tube (PMT) to collect emission light from 660 – 750 nm. Also activate the differential interference contrast (DIC) channel.
23. In the fast scanning mode (400 Hz), fine-tune the focus, the laser intensity and the PMT gain voltage until clear image is obtained in both far-red fluorescence and DIC channels.
24. Take high-resolution images by switching to slow scanning (10 Hz) mode and/or using 100X oil immersion objective.
25. The fluorescence images can be processed using the LAS AF software or other image processing software. See Figure 4 for anticipated results.
ALTERNATE PROTOCOL 1: SYNTHESIS AND APPLICATION OF COVALENT TMP-TAG FOR LIVE CELL IMAGING
This protocol describes the synthesis of covalent A-TMP-fluorescein (compound 14 in Figure 5), the construction of H2B-eDHFR:L28C vector, and live cell imaging in HEK 293T cells. The chemical synthesis is summarized in Figure 5. An example of anticipated images is displayed in Figure 6. The general procedures also apply to other fluorophores, target proteins and cell lines, potentially with some modification in details, as discussed in the Strategic Planning and Commentary sections.
Figure 5.

Synthetic route of compound 14 A-TMP-fluorescein.
Figure 6.
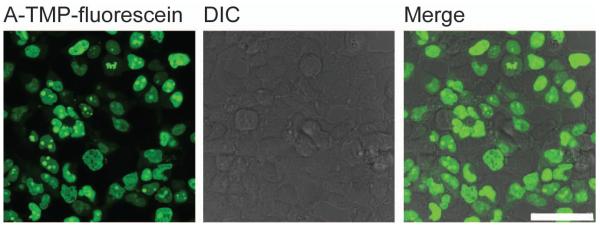
Live cell imaging of H2B labeled with covalent TMP-tag. The left image shows expected result of fluorescence imaging of H2B in live HEK 293T cells using A-TMP-fluorescein. The middle image is from differential interference contrast (DIC) channel. The right image is obtained by merging the fluorescein channel with the DIC channel. Scale bar is 50 μm.
Additional Materials
Compound 2 TMP-OH (from Basic Protocol 1)
L-Aspartic acid 4-tert-butyl ester, CAS No.: 3057-74-7
Sodium carbonate
Acryloyl chloride
Sodium bisulfate (NaHSO4)
tert-butylN-(3-iodopropyl)carbamate, CAS No. 167479-01-8
Cesium carbonate
Reverse phase C18 silica gel
1-Ethyl-3-(3-dimethyllaminopropyl)carbodiimide hydrochloride (EDCI)
6-Carboxyfluorescein N-hydroxysuccinimide ester (6-Carboxyfluorescein-NHS ester), CAS No. 92557-81-8
Isobutyric anhydride
Pyridine
Toluene
Synthesis of A-TMP-fluorescein heterotrimer
1. Synthesis of compound 7
In a 100 mL round-bottomed flask, chill a solution of L-Aspartic acid 4-tert-butyl ester (1.00 g, 5.28 mmol) and sodium carbonate (840 mg, 7.93 mmol) in 20 mL water on an ice bath. Then add acryloyl chloride (502 mg, 449 μL, 5.55 mmol) dropwise to this ice-cold solution and subsequently remove ice bath to warm the reaction mixture to room temperature and stir for another 1 h. Adjust pH of the solution to 2.0 by addition of 1M NaHSO4 aqueous solution. Then extract the mixture with EtOAc (2 × 100 mL) and combine the organic layers. Dry the organic layer over anhydrous Na2SO4 and remove solvent by rotary evaporation to yield compound7 (expected 0.93 g, 3.85 mmol, 73%. Rf = 0.82 in MeOH) as a colorless oil. 1H NMR (300 MHz, CDCl3) δ ppm: 6.80 (d, J = 7.5 Hz, 1 H); 6.35 (dd, J = 16.8 Hz, 1.2 Hz, 1 H); 6.16 (dd, J = 16.8 Hz, 10.2 Hz, 1 H); 5.75 (dd, J = 10.2 Hz, 1.2 Hz, 1 H); 4.89(m, 1 H); 3.02 (dd, J = 17.1 Hz, 4.2 Hz, 1 H); 2.78 (dd, J = 17.1 Hz, 5.4 Hz, 1 H); 1.44 (s, 9 H). HRMS (FAB+) m/z Calcd. for C11H18O5N [M+H]+: 244.1185. Found: 244.1181.
2. Synthesis of compound 9 TMP-NH2
In a 100 mL round-bottomed flask, dissolve compound 2 TMPOH (600 mg, 2.16 mmol), tert-butyl N-(3-iodopropyl)carbamate (618 mg, 2.16 mmol) and cesium carbonate (1.41 g, 4.32 mmol) in anhydrous DMF (30 mL). Heat the reaction mixture to 70 °C and stir for 5 h under Ar, followed by the removal of solvent by rotary evaporation. Then purify the crude product by column chromatography with silica gel (elutant: DCM/MeOH, 9:1 v/v) to yield compound 8 (Rf = 0.33 in DCM/MeOH, 9:1 v/v), which is subsequently deprotected by directly dissolving in 5 ml TFA and 5 mL DCM while stirring at room temperature. After 4 h, remove the TFA by rotary evaporation to yield compound 9 in the form of its TFA salt (expected 715 mg, 1.66 mmol, 77%) as colorless oil. 1H NMR (300 MHz, CD3OD) δ ppm: 7.28 (s, 1 H); 6.64 (s, 2 H); 4.12 (t, J = 5.4 Hz, 2 H); 3.87 (s, 6 H); 3.70 (s, 2 H); 3.30 (t, J = 6.0 Hz, 2 H); 2.08 (m, 2 H). HRMS (FAB+) m/z Calcd. for C16H24O3N5 [M+H]+: 334.1879. Found: 334.1883.
3. Synthesis of compound 11 A-TMP-COOH
Prior to the synthesis, bake a 50 mL round-bottomed flask at 95 °C for 48 h. Right before setting up the reaction, the flask should be further dried by propane flame. Add compound 7 (187 mg, 0.77 mmol), compound 9 (271 mg, 0.63 mmol, in the form of TFA salt), DMAP (39 mg, 0.30 mmol) and EDCI (241 mg, 1.26 mmol) to the hot flask and put under vacuum. After the flask cools to room temperature (after approximately 1 h), add DMF (10 mL) and DIEA (348 μL, 2.00 mmol) to the flask under Ar. Stir the reaction mixture for 12 h at room temperature and remove solvent by rotary evaporation. The crude product is purified by silica gel flash chromatography (10% MeOH in DCM v/v) to yield the coupling product compound10 (Rf = 0.43 in DCM/MeOH, 6:1 v/v), which is subsequently dissolved in 20 ml TFA-DCM (1:1, v/v) and stirred for 4 h at room temperature. Then remove solvent by rotary evaporation and further purify the deprotection product by column chromatography on silica gel (30% MeOH in DCM v/v) to give compound 11 (expected 127 mg, 253 μmol, 46%) as colorless oil. 1H NMR (300 MHz, CD3OD) δ ppm: 7.25 (s, 1 H); 6.57 (s, 2 H); 6.24 (dd, J = 17.1 Hz, 9.0 Hz, 1 H); 6.16 (dd, J = 17.1 Hz, 3.0 Hz, 1 H); 5.61 (dd, J = 9.0 Hz, 3.0 Hz, 1 H); 4.80 (m, 1 H); 3.98 (m, 2 H); 3.82 (s, 6 H); 3.68 (s, 2 H); 3.46 (t, J = 6.0 Hz, 2 H); 2.87 (dd, J = 16.8 Hz, 6.0 Hz, 1 H); 2.72 (dd, J = 16.8 Hz, 7.5 Hz, 1 H); 1.88 (m, 2 H). HRMS (FAB+) m/z Calcd. for C23H31O7N6 [M+H]+: 503.2254. Found: 503.2273.
4. Synthesis of compound 13 A-TMP-NH2
Dissolve compound 11 (40 mg, 80 μmol), NHBoc-PEG-NH2 (38 mg, 119 μmol), and DMAP (5 mg, 40 μmol) in 10 mL anhydrous DMF and then add EDCI (31 mg, 160 μmol) and DIEA (70 μL, 0.4 mmol) at room temperature. Stir the reaction mixture for 12 h at room temperature before concentrating by rotary evaporation. Purify the crude product by silica gel flash chromatography (10% MeOH in DCM v/v) to yield compound 12 (Rf = 0.33 in DCM/MeOH, 3:1 v/v), which is subsequently dissolved in 5 mL TFA and 5 mL DCM and stirred for 4 h at room temperature. Remove solvent by rotary evaporation and further purify the crude product by column chromatography on reverse phase C18 silica gel with 10% acetonitrile in water to yield compound 13 (expected 16 mg, 20 μmol, in the form of TFA salt, 25% yield) as white solid.1H NMR (400 MHz, CD3OD) δ ppm: 7.25 (s, 1 H); 6.57 (s, 2 H); 6.22 (dd, J = 17.2 Hz, 9.6 Hz, 1 H); 6.15 (dd, J = 17.2 Hz, 2.8 Hz, 1 H); 5.61 (dd, J = 9.6 Hz, 2.8 Hz, 1 H); 4.83 (m, 1 H); 3.96 (m, 2 H); 3.81 (s, 6 H); 3.69-3.62 (m, 10 H); 3.59-3.55(m, 2 H); 3.49 (t, J = 6.0 Hz, 2 H); 3.48-3.40 (m, 2 H); 3.24 (dt, J = 7.2 Hz, 3.2 Hz, 2 H); 3.10 (t, J = 6.4 Hz, 2 H); 2.76 (dd, J = 14.8 Hz, 5.6 Hz, 1 H); 2.58 (dd, J = 14.8 Hz, 7.6 Hz, 1 H); 1.92 (m, 2 H); 1.87 (m, 2 H); 1.73 (m, 2 H). HRMS (FAB+) m/z Calcd. for C33H53O9N8 [M+H]+: 705.3936. Found: 705.3917.
5. Synthesis of compound 14 A-TMP-fluorescein
In a 25 mL round-bottomed flask, dissolve compound 13 (3.0 mg, 3.7 μmol) and 6-carboxyfluorescein-NHS ester (3.1 mg, 6.5 μmol) in 1 ml anhydrous DMF and then add triethylamine (5 μL, 36 μmol). Stir the reaction mixture at room temperature for 12 h before concentrating by rotary evaporation. Then redissolve the crude product in pyridine (0.40 mL) and add isobutyric anhydride (62μL, 0.37mmol). Stir the reaction mixture at room temperature for 2 hours, during which the color and fluorescence disappeared. Add water (20 μL) to the mixture and incubate for 5 minutes. Then remove solvent by rotary evaporation and further evaporate the crude product twice with toluene. Finally, purify the reaction residue (~ 10 mg) by reverse phase HPLC to yield compound 14(expected 1.7 mg, 1.4 μmol, 38%). Recommended HPLC condition for C18 semi-prep column: starting with 33:67 acetonitrile:water, gradient elution for 50 min, end with 50:50 acetonitrile:water. Retention time: 42 – 43 min. 1H NMR (400 MHz, CD3OD) δ ppm: 8.46 (d, J = 0.8 Hz, 1 H ), 8.22 (dd, J = 8.0 Hz, 1.6 Hz, 1 H); 7.38(d, J = 8.0 Hz, 1 H); 7.23 (s, 1 H); 7.19 (m, 2 H); 6.90 (m, 4 H); 6.22 (dd, J = 16.8 Hz, 9.6 Hz, 1 H); 6.14 (dd, J = 16.8 Hz, 2.4 Hz, 1 H); 5.59 (dd, J = 9.6 Hz, 2.4 Hz, 1 H); 4.78 (t, J = 6.4 Hz, 1 H); 3.94 (t, J = 5.6 Hz, 2 H); 3.79 (s, 6 H); 3.66-3.60 (m, 10 H); 3.55-3.52 (m, 4 H); 3.47-3.40 (m, 4 H); 3.20 (m, 2 H); 2.85 (m, 2 H); 2.71 (dd, J = 15.2 Hz, 6.0 Hz, 1 H); 2.60 (dd, J = 15.2 Hz, 7.2 Hz, 1 H); 1.92 (m, 2 H); 1.83 (m, 2 H); 1.68 (m, 2 H); 1.30 (d, J = 7.2 Hz, 12 H). MS (FAB+) m/z Calcd. for C62H75O17N8 [M+H]+: 1203.53. Found: 1203.63.
6. Dissolve the final product A-TMP-fluorescein in DMF or DMSO and determine the concentration by measuring absorbance at 285 nm. The extinction coefficient of molecule 14 at 285 nm ε285 = 1.35×10⁴mol−1cm−1, measured in DMF. It is recommended to make a stock solution in DMF of DMSO with concentration of 1 – 5 mM.
Construction of H2B-eDHFR vector
This is a general workflow for constructing the H2B-eDHFR:L28C plasmid using standard site-directed mutagenesis (SDM) technology. For detailed technique please refer to related protocols(Kunkel 2001).
7. Amplify the H2B-eDHFR plasmid by PCR using mutagenesis primers 5′- GGA ACC TGC CTG CCG ATT GCG CAT GGT TTA AAC GCA AC -3′ and 5′- GTT GCG TTT AAA CCA TGC GCA ATC GGC AGG CAG GTT CC-3′. There are multiple commercially available SDM kits. The PCR condition can be optimized according to manufacturers’ instructions.
8. Digest the mutagenesis PCR product by DpnI. All methylated DNA (i.e. wild type plasmid DNA) will be fragmented, leaving only the mutated DNA.
9. Transform E.coli with the mutated vector by electroporation and grow on LB-Kanamycin plate.
10. Amplify the H2B-eDHFR:L28C plasmid and confirm the mutation by sequencing the open reading frame region using CMV forward primer.
11. Prepare endo-free Maxi-prep of plasmid (~1 μg/μL) for mammalian cell transfection.
Cell staining and fluorescence imaging
Transfect HEK 293T cells with plasmids encoding H2B-eDHFR:L28C and stain with A-TMP-fluorescein for live cell imaging with confocal microscope, of which the procedures are the same as with TMP-Atto655 in the Basic Protocol, with variations that : (1) since the protected fluorescein is highly cell-permeable, HEK 293T cells only need to be stained for 5 min before proceeding to washing and imaging; (2) For fluorescence imaging select 488 nm Ar laser and set the photon multiplier tube (PMT) to collect emission light from 520 - 600 nm. See Figure 6 for anticipated results.
ALTERNATE PROTOCOL 2: SYNTHESIS AND APPLICATION OF FLUOROGENIC TMP-TAG FOR LIVE CELL IMAGING
This protocol describes the synthesis of fluorogenic TMP-Q-Atto520 (compound 23) and live cell imaging in HEK 293T cells. The chemical synthesis is summarized in Figure 7 and Figure 8. An example of expected image is displayed in Figure 9. The general procedures also apply to other fluorophores, target proteins and cell lines, potentially with some modification in details, as discussed in the Strategic Planning and Commentary sections.
Figure 7.

Synthetic route of compound 17.
Figure 8.

Synthetic route of compound 23 TMP-Q-Atto520.
Figure 9.
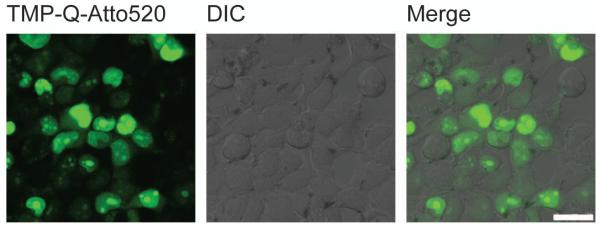
Live cell imaging of H2B labeled with fluorogenic TMP-tag. The left image shows expected result of fluorescence imaging of H2B in live HEK 293T cells using TMP-Q-Atto520. The middle image is from differential interference contrast (DIC) channel. The right image is obtained by merging the fluorescein channel with the DIC channel. Scale bar is 25 μm.
Additional Materials
Compound 9 TMP-NH2 (From Alternate Protocol 2)
N-Boc-propargylglycine
Hydroxybenzotriazole (HOBt)
1-Ethyl-3-(3-dimethyllaminopropyl)carbodiimide hydrochloride (EDCI)
Atto520-NHS ester
N-(3-aminopropyl)-N-methylaniline
Di-tert-butyl dicarbonate
Fast Corinth V Salt
Sodium carbonate
3-(Chlorosulfonyl)benzoyl chloride
2-Azidoethanol
Ascorbic acid
CuSO4·5H2O
Synthesis of TMP-Q-Atto520 heterotrimer
1. Synthesis of compound 16 TMP-alkyne
In a 25 mL round-bottomed flask, dissolve compound 9(192 mg, 0.4 mmol, in the form of TFA salt), N-Boc-propargylglycine (85.3 mg, 0.4 mmol), HOBt (16.2 mg, 0.12 mmol) and EDCI (230 mg, 1.2 mmol) in 3 ml anhydrous DMF at RT. Then add DIEA (871 μL, 4 mmol) and stir the reaction under Ar for 12 h at RT and then concentrate by rotary evaporation. Purify the crude product by silica gel flash chromatography (1:6 methanol:DCM, v/v) to yield the coupling product compound 15 (Rf = 0.45 in 1:6 methanol:DCM, v/v), which is subsequently dissolved in 20 ml TFA-DCM (1:1, v/v) and stirred for 4 h at RT. Remove the solvent by rotary evaporation to yield compound 16 (expected 140 mg as TFA salt, 257 μmol, 64% yield in two steps) as a colorless solid. Rf = 0.05 in 1:6 methonal:DCM. Compound 151H NMR (400 MHz, CD3OD) δ ppm: 7.66 (s, 1H), 6.39 (s, 2H), 5.43 (d, J = 8 Hz, 1H), 5.06 (s, 1H), 4.29 (q, J = 8, 6.5 Hz, 1H), 4.03 (m, 2H), 3.80 (s, 6H), 3.64 (S, 2H), 3.53 (m, 2H), 2.74 (d, J = 17.1 Hz, 1H), 2.59 (m, 1H), 1.99 (m, 2H), 1.91 (m, 2H), 1.37 (s, 9H). Compound 16 MS (FAB+) m/z Calcd. for C21H28O6N4 [M+H]+ : 429.22. Found: 429.81.
2. Synthesis of compound 17 TMP-alkyne-Atto520
Dissolve compound 16(7 mg, 13 μmol) and Atto520-NHS ester (5.0 mg, 8.9 μmol) in 0.5 ml anhydrous DMF in a round-bottomed flask and then add DIEA (15 μL, 89 μmol). Stir the mixture under Ar at room temperature for 12 h before concentrating by rotary evaporation. Purify the reaction residue by reverse phase HPLC to yield compound 17 (expected 6 mg as TFA salt, 6.7 μmol, 76% yield). 1H NMR (400 MHz, CD3OD) δ ppm: 7.91 (s, 2H), 7.23 (s, 1H), 6.85 (s, 2H), 6.56 (s, 2H), 4.40 (dd, J = 7.2, 4.8 Hz, 1H), 3.98 (t, J = 5.9 Hz, 2H), 3.81 (s, 6H), 3.73 (m, 2H), 3.65 (s, 2H), 3.52 (q, J = 7.2 Hz, 6H), 3.22 (m, 2H), 2.87 (s, 1H), 2.67 (m, 2H), 2.52 (m, 2H), 2.35 (s, 6H), 2.30 (m, 1H), 1.87 (p, J = 6.3 Hz, 2H), 1.33 (m, 6H). HRMS (FAB+) m/z Calcd. for C43H52O8N8[M+H]+: 777.41. Found: 777.41.
Recommended HPLC condition for C18 column: start with 10:90 acetonitrile:water (v/v), gradient elution for 80 min, end with 60:40 acetonitrile:water (v/v). Retention time: 40 – 41 min.
3. Synthesis of compound 18
In a 100 mL round-bottomed flask dissolve N-(3-aminopropyl)-N-methylaniline (1 mL, 6.09 mmol) in 10 mL DCM and then add DIEA (2.1 mL, 12.18 mmol) and Di-tert-butyl dicarbonate (7 mL, 30.45 mmol) to the solution dropwise. Stir the reaction under Ar for 20 minutes. Remove solvent by rotary evaporation and then purify the product by flash column chromatography on silica gel (1:5 EtOAc:hexane, v/v) to yield compound 18 (expected 1.6 g, 6.05 mmol, 99% yield) as colorless oil. Rf = 0.35 in 1:5 EtOAc:hexane (v/v). 1H NMR (400 MHz, CDCl3) δ ppm: 7.23 (m, 2H), 6.70 (m, 3H), 4.56 (s, 1H), 3.40 – 3.32 (t, J = 7.2 Hz, 2H), 3.17 (q, J = 6.8 Hz, 2H), 2.92 (s, 3H), 1.77 (p, J = 7.0 Hz, 2H), 1.45 (s, 9H). MS (FAB+) m/z Calcd. for C15H24O2N2 [M+H]+ :265.18. Found: 265.22.
The amine group on N-(3-aminopropyl)-N-methylaniline must be protected so that the next step – the azo coupling can proceed smoothly without excessive side reactions.
4. Synthesis of compound20 BHQ1-NH2
In a 100 mL round-bottomed flask suspend Fast Corinth V Salt (472 mg, dye content 90%, 1.02 mmol) in 8 mL water and chill to 0 °C in ice bath. In another container dissolve compound 18 (600 mg, 2.27 mmol) in 8 mL methanol and add 6 mL 5% Na2CO3(w/v) aqueous solution. The compound 18 solution will turn milky. Add the compound 18 suspension dropwiseto the Fast Corinth V Salt suspension while stirring in ice bath. Continue stirring the reaction mixture for another 2 h during which the color should change from orange to dark red. Filter the reaction mixture to obtain crude product as dark red solid and wash with 3 × 10 mL cold water and then dry under vacuum. Purify the crude product by column chromatography on silica gel (4:6 EtOAc:hexane) to yield compound 19 as dark red solid. Subsequently deprotect the Boc group by dissolving compound 19in 10 ml 30% TFA in DCM (v/v) and stirring for 1 h; the color changes from red to dark blue. Remove solvent by rotary evaporation to obtain compound 20 (expected 360 mg as TFA salt, 0.61 mmol, 60% yield in 2 steps) as dark purple solid. Rf = 0.3 in 1:2 EtOAc:hexane. Compound 191H NMR (400 MHz, CDCl3) δ ppm: 7.91 (m, 2H), 7.77 (s, 1H), 7.66 (d, J = 8.0 Hz, 2H), 7.58 (s, 1H), 7.47 (m, 2H), 7.40 (s, 1H), 6.4 (m, 2H), 4.57 (s, 1H), 4.02 (s, 3H), 3.49 (t, J = 7.3 Hz, 2H), 3.20 (q, J = 6.7 Hz, 2H), 3.08 (s, 3H), 2.70 (s, 3H), 2.51 (s, 3H), 1.84 (p, J = 7.1 Hz, 2H), 1.46 (s, 9H). Compound 20 MS (FAB+) m/z Calcd. for C25H29O7N3 [M+H]+: 476.23. Found: 476.58.
5. Synthesis of compound 21
In a round-bottomed flask dissolve compound 20 (TFA salt, 100 mg, 0.173 mmol) in anhydrous DCM and chill to 0 °C in ice bath. Then add 3-(chlorosulfonyl)benzoyl chloride (55 μL, 0.346 mmol) to the solution, followed by DIEA (0.3 mL, 1.73 mmol). Stir the reaction mixture in ice bath under Ar for 15 min, and then warm to room temperature and stir for another 1 h. Collect the crude product by evaporating the solvent and then purify by column chromatography on silica gel (7:3 EtOAc:hexane, v/v) to yield compound 21 (expected 99 mg, 0.145 mmol, 84% yield) as dark red solid. Rf = 0.42 in 2:1 EtOAc:hexane, v/v. 1H NMR (400 MHz, CDCl3) δ ppm: 8.38 (t, J = 1.8 Hz, 1H), 8.16 (ddd, J = 8.0, 2.0, 1.1 Hz, 1H), 8.10 (dt, J = 8.0, 1.4 Hz, 1H), 7.91 (m, 2H), 7.70 (m, 2H), 7.66 (d, J = 8.2 Hz, 1H), 7.6 (s, 1H), 7.47 (ddd, J = 8.1, 1.8, 0.9 Hz, 1H), 7.39 (s, 1H), 6.78 (d, J = 8.8 Hz, 2H), 4.01 (s, 3H), 3.59 (m, 4H), 3.10 (s, 3H), 2.70 (s, 3H), 2.51 (s, 3H), 2.03 (p, J = 7.2 Hz, 3H). MS (FAB+) m/z Calcd. for C32H32ClO7N6S [M+H]+: 678.18. Found: 660.27 (hydrolysis product).
For this reaction it is very important to keep all the solvents (DCM, EtOAc and hexane) and containers dry. It is highly recommended to take anhydrous DCM and DIEA from sure-seal bottles using oven-dried glass syringes and needles.
Add 3-(chlorosulfonyl)benzoyl chloride and DIEA dropwise to the reaction mixture and monitor the temperature by using thermometer or touching the flask by hand. Make sure the reaction temperature is kept near 0 °C while adding the reagents. High temperature may promote side reaction in which the BHQ1-NH2 reacts with 3-(chlorosulfonyl)benzoyl chloride on the sulfonyl chloride side.
6. Synthesis of compound 22 BHQ1-azide
In a 50 mL round-bottomed flask dissolve compound 20 (99 mg, 0.146 mmol) and DMAP (18 mg, 0.164 mmol) in 2 mL anhydrous DCM and then add 2-azidoethanol (25 μL, 0.292 mmol) followed by DIEA (128 μL, 0.73 mmol). Stir the reaction under Ar at room temperature for 4 h. After removing the solvent by rotary evaporation, purify the crude product by column chromatography on silica gel (100% EtOAc) to yield compound 22 (expected 65 mg, 89 μmol, 61% yield) as dark red solid. Rf = 0.58 in 100% EtOAc. 1H NMR (400 MHz, CDCl3) δ ppm: 8.30 (s, 1H), 8.11 (m, 1H), 8.07 (m, 1H), 7.93 (m, 3H), 7.71 (m, 2H), 7.66 (m, 2H), 7.58 (s, 1H), 7.48 (m, 1H), 7.39 (s, 1H), 4.24 (t, J = 4.8 Hz, 2H), 4.02 (s, 3H), 3.78 (t, J = 5.0 Hz, 1H), 3.59 (m, 4H), 3.50 (t, J = 4.8 Hz, 2H), 3.12 (s, 3H), 2.70 (s, 3H), 2.52 (s, 3H), 2.02 (m, 2H). MS (FAB+) m/z Calcd. for C34H36O10N7S [M+H]+: 729.25. Found: 729.30.
7. Synthesis of compound 23 TMP-Q-Atto520
Transfer compound 22 (TFA salt, 6 mg, 6.7 μmol) and compound 17 (9 mg, 12.3 μmol) to a 10 mL round-bottomed flask and dissolve in 0.2 mL DMF. Then add ascorbic acid (0.68 mg, 3.86 μmol) and CuSO4·5H2O (0.19 mg, 0.771 μmol) and stir the reaction mixture under Ar at room temperature for 24 h. After removing the solvent by rotary evaporation, purify the product by HPLC to yield compound 23 (1.3 mg, 0.86 μmol, 11% yield) as dark purple solid, Rf = 0.72 in 1:4 methanol:DCM with 0.5% acetic acid (v/v). 1H NMR (400 MHz, CD3OD) δ ppm: 8.86 (t, J = 5.7 Hz, 1H), 8.24 – 8.14 (m, 3H), 8.05 (t, J = 5.6 Hz, 1H), 7.93 (m, 1H), 7.79 (dd, J = 1.8, 0.9 Hz, 1H), 7.73 – 7.58 (m, 7H), 7.28 (d, J = 0.8 Hz, 1H), 7.22 (d, J = 1.1 Hz, 1H), 7.17 (s, 1H), 6.61 (s, 2H), 6.56 (s, 2H), 4.66 – 4.56 (m, 3H), 4.50 (m, 2H), 3.92 (m, 2H), 3.86 (s, 3H), 3.80 (s, 6H), 3.63 (s, 2H), 3.62 – 3.56 (m, 3H), 3.55 – 3.50 (m, 2H), 3.38 (q, J = 7.2 Hz, 4H), 3.33 (d, J = 1.6 Hz, 2H), 3.11 (s, 3H), 3.06 (dd, J = 14.9, 5.7 Hz, 1H), 2.90 (dd, J = 14.9, 8.3 Hz, 1H), 2.57 (s, 3H), 2.54 (s, 3H), 2.18 (s, 6H), 2.01 (m, 2H), 1.82 (m, 2H), 1.29 (t, J = 7.2 Hz, 6H). MS (ESI) m/z Calcd. for C77H88O18N3S [M+H]+: 1506.66. Found: 1506.5.
Recommended HPLC condition for C18 column: start with 30:70 acetonitrile:water (v/v), gradient elution for 80 min, end with 80:20 acetonitrile:water (v/v). Retention time: 49 – 51 min.
If it is hard to weigh and transfer the small amount of ascorbic acid and CuSO4·5H2O, it is suggested to first dissolve these reagents in DMF to make 0.1 M solutions and then transfer to the reaction mixture using syringe.
8. Dissolve the final product TMP-Q-Atto520 in DMF or DMSO and determine the concentration by measuring absorbance at 580 nm. The extinction coefficient of molecule 23 at 580 nm ε580 = 1.97×10⁴mol−1cm−1, measured in DMF. It is recommended to make a stock solution in DMF of DMSO with concentration of 1 – 5 mM.
Cell staining and fluorescence imaging
Transfect HEK 293T cells with plasmids encoding H2B-eDHFR:L28C and stain with TMP-Q-Atto520 for live cell confocal imaging. The procedures of cell staining and fluorescence imaging with TMP-QAtto520 are the same as with TMP-Atto655 in the Basic Protocol, with variations that: (1) HEK 293T cells need to be stained for 3 h before proceeding to washing and imaging; (2) For fluorescence imaging select 488 nm Ar laser and set the photon multiplier tube (PMT) to collect emission light from 520 – 600 nm. See Figure 9 for anticipated results.
REAGENTS AND SOLUTIONS
50X TAE buffer for DNA agarose electrophoresis
1. Dissolve the following in 750 mL distilled water:
242 g Trizma base (final concentration 2 M)
57.1 ml glacial acetic acid (final concentration 0.95 M)
100 mL of 0.5 M EDTA (pH 8.0) solution (final concentration 0.05 M)
2. Adjust the solution to a final volume of 1 L. This stock solution can be stored at room temperature for up to 2 years. The pH of this buffer is not adjusted and should be about 8.5.
3. Dilute 50X before using for electrophoresis.
1X PBS
1. Dissolve the following in 800mL deionized water:
8g of NaCl (final concentration 137 mM)
0.2g of KCl (final concentration 2.7 mM)
1.44g of Na2HPO4 (final concentration 10.0 mM)
0.24g of KH2PO4 (final concentration 2.0 mM)
2. Adjust pH to 7.4.
3. Adjust volume to 1L with additional deionized water.
4. Sterilize by autoclaving. Store at room temperature for up to 2 years.
COMMENTARY
Background Information
Since the first report in 2005, the TMP-tag has undergone transition from proof-of-principle studies of imaging nuclear-localized proteins to real-world biophysical experiments both in vitro and inside of living cells, especially those difficult or not otherwise possible with FPs. Meanwhile, the palette of TMP-fluorophores has been expanded from fluorescein-based green and red dyes to include high photon output cyanine dyes, a far-red photo-switching Atto655, a two-photon fluorophore BC575, and lanthanide probes (summarized in Table 1). Significantly, the advantage of TMP-tag for sophisticated biophysical experiments has been verified by several recent reports, including single-molecule (SM) imaging of spliceosome assembly in yeast cell extracts; chromophore aided laser inactivation (CALI) of localized myosin light chain in live MEF cells; and super-resolution imaging of nucleosomes in live HeLa cells.
In 2011, the TMP-tag was exploited in combination with the SNAP-tag to enable single-molecule imaging of the spliceosome in yeast cell extracts, an experiment not possible with the lower photon-output FPs(Hoskins et al. 2011). Despite intense interest in understanding the mechanism by which pre-mRNAs are correctly spliced to mature mRNAs, the splicoesome is difficult to study because it is a complex 2-3 MD machinery of proteins and RNAs and cannot be reconstituted in vitro from purified components. The TMP- and SNAP-tags allowed pairs of the small nuclear ribonucleoprotein (snRNP) components of the spliceosome to be labeled directly in cell extracts with high photon output dyes and imaged as they assembled on individual pre-mRNAs.
Likewise, the high photon output TMP-tags are beginning to impact ‘super-resolution’ (SR) imaging technologies that break the diffraction barrier to allow fluorescence imaging at the nanometer length-scale of natural proteins. Stochastic SR imaging technologies including PALM (photo-activatable localization microscopy) and STORM (stochastic optical reconstruction microscopy) hinge on photo-switchable fluorophores with high photon output that enable the locations of subsets of the total fluorophore population to be determined precisely over time. Until recently, SR imaging has typically relied on either photo-activatable FPs, which have limited photon output and palettes, or antibodies conjugated with organic fluorophores, which offer higher resolution and many more colors, but are incompatible with live cells(Jones et al. 2011, Klein et al. 2011). Chemical tags have the potential to combine the advantages of these two contrasting labeling methodologies - they are genetically encoded and thus compatible with live cells, and they are modular and thus allow use of photo-switchable high photon output organic fluorophores. Bringing this potential to reality, in 2010, building on the discovery by Sauer et al. that the reducing environment of the cell catalyzes reversible photo-switching of high photon-output Atto organic fluorophores at time scales well suited for direct STORM (dSTORM) imaging(Heilemann et al. 2009), we demonstrated dynamic dSTORM imaging of H2B labeled with TMP-Atto655(Wombacher et al. 2010). Significantly, we achieved exceptional spatial (~ 20 nm) and temporal (~ 10 sec) resolutions, which are not possible with FPs.
Besides single-molecule and SR imaging, chemical tags with organic fluorophores also have advantages over FPs for numerous biophysical studies. For example, chromophore-assisted laser inactivation (CALI) is a useful technique for selective protein inactivation in which the dye molecules produce reactive oxygen species (ROS) upon laser irradiation, thus damaging the tagged proteins with spatial and temporal control. Small molecule dyes are shown to be more efficient ROS generators than FPs probably because the chromophore in an FP is buried in a β-barrel which hinders the interaction between the fluorophore and ROS. In a representative study, the eDHFR/TMP-fluorescein tag has been used to image and manipulate myosin-II via CALI(Cai et al. 2010). Local inactivation of myosin-II disrupts the continuity of the actomyosin-II network and results in decrease of cytoplasmic coherence, verifying that non-muscle myosin-II contraction of cytoplasmic actin filaments establishes a coherent cytoskeletal network that transmits force across the cytoplasm.
Finally, the TMP-tag is not limited to traditional fluorescence imaging. The modular design allows for conjugation of a great variety of synthetic molecules including magnetic nanoparticles for manipulating proteins and live cells(Long et al. 2011); synthetic peptides for small molecule-induced protein ligation (Ando et al. 2007); and dexamethasone as chemical inducer of protein dimerization(Czlapinski et al. 2008).
Critical Parameters
As outlined in the Strategic Planning section, the TMP-tag should be carefully designed and optimized based on specific requirement of the biophysical experiment. Potential variations on aforementioned protocols are listed below:
Fluorophores
For live cell imaging it is crucial to choose fluorophores with both exceptional photo-physical properties and favorable biological activities. The three TMP-tags described in the protocols: TMP-Atto655, A-TMP-fluorescein (protected) and TMP-Q-Atto520 have all been demonstrated to enable live cell imaging of various intracellular proteins. When using other fluorophores it is recommended to select those with minimal negative charges (in forms of carboxyl groups or sulfonates). If the fluorophore has multiple negative charges, the regular cell staining protocol may not be highly efficient and some special techniques may be necessary to introduce the TMP-fluorophore conjugate into live cells. These techniques may include electroporation, cell scraping and induced pinocytosis.
For in vitro experiments or imaging cell surface proteins, however, the TMP-fluorophore does not need to be highly cell-permeable or well behaving inside of cells. In such cases a large number of cyanine dyes and Alexa dyes may be good choices because of their outstanding brightness and photo-stability.
Linkers
The linker between TMP and the fluorophore is also important for live cell imaging. Previous studies have shown that PEG linker is favored over methylene linker for mammalian cells(Calloway et al. 2007). In contrast, the methylene linker works slightly better than PEG linker in yeast cells.
Target proteins
The eDHFR is about two-thirds the size of FPs. Therefore, most target proteins that can be labeled by FPs without compromising function and dynamics should also be compatible with the TMP-tag. The eDHFR is a monomeric, well-behaved, rapidly folding protein that can be expressed well both on the surface and inside of live cells. For in vitro studies, both eDHFR and eDHFR:L28C variant can be over-expressed in E.coli and purified using standard protein purification techniques.
Cell staining condition
The cell staining condition may vary for different cell lines and target proteins. Generally, for non-covalent and covalent TMP-tag, 0.5 – 5 μM of dye staining for 5 – 60 min at 37 °C should efficiently label most kinds of intracellular proteins. For fluorogenic TMP-tags the reference parameters are 1 – 10 μM of dye staining for 0.5 – 3 h.
Optimization of the fluorogenic TMP-tag
Previous study has found that for fluorogenic TMP-tag, different fluorophores may pair with different eDHFR:Cys variants to reach maximal labeling efficiency and fluorescence enhancement (manuscript in revision).For example, TMP-Q-Atto520 works best with eDHFR:L28C, while TMP-Q-fluorescein prefers eDHFR:P25C. Therefore, when using a fluorophore other than Atto520 or fluorescein, it is suggested to determine the appropriate eDHFR:Cys mutant by in vitro fluorometric measurements. Potential eDHFR:Cys candidates include P25C; L28C; A29C; N23C; K32C; R52C and P55C. Additionally, the BHQ1 effectively quenches fluorophores emitting in the green-yellow region (480 – 580 nm). When using a red-shifted fluorophore, a red quencher such as BHQ3 or QSY21 may be used instead of BHQ1.
Troubleshooting
See Table 2.
Table 2.
Troubleshooting.
| Step | Problem | Possible Reason | Suggested Solution |
|---|---|---|---|
| Basic Protocol Step1 |
Cannot get pure product by recrystallization. |
The hydrolysis reaction is not well controlled. |
Carefully control the reaction temperature and time; Purify the product by silica column if necessary. |
| Basic Protocol Step 4 |
Cannot get pure product by silica column. |
The unreacted BocNH-PEG-NH2 is eluted together with the product. |
Refine the intermediate TMP-PEG-NHBoc by silica column. If the purity is still not sufficient, proceed to the deprotection step and purify the final compound 5 by HPLC. |
| Alternate Protocol 1 Step 1 |
The product compound 7 is not pure. |
The reaction temperature is not well controlled. |
Make sure the reaction mixture is kept at 0 °C. If necessary, purify the product compound 7 by reverse phase chromatography. |
| Alternate Protocol 1 Step 4 |
Cannot get pure product by silica column. |
The unreacted BocNH-PEG-NH2 is eluted together with the product. |
Refine the intermediate TMP-PEG-NHBoc by silica column. If the purity is still not good enough, proceed to the deprotection step and purify the final compound 13 by HPLC. |
| Alternate Protocol 2 Steps 5 - 7 |
No reaction or product is not pure. |
Tosylate group hydrolyzes. |
Use anhydrous solvent and reagents. Dry all containers, stir bars, syringes and needles in 95 °Coven prior to use. Keep the intermediates cool and dry. If the intermediates and products are stored in fridges or freezers, warm them to room temperature before opening the container. |
Anticipated Results
The anticipated results for chemical synthesis and fluorescence imaging were provided along with the corresponding protocols.
Time Considerations
For the Basic Protocol, the chemical synthesis is anticipated to take 10 – 15 days. For Alternate Protocols 1 and 2, the chemical synthesis is anticipated to take 20 – 25 days. The vector construction and plasmid maxi-prep is anticipated to take 3 – 10 days. The cell transfection, staining and imaging is anticipated to take 3 days with cells in culture.
ACKNOWLEDGMENT
The protocols were based works supported by the National Institutes of Health (NIH RO1 GM54469; NIH 5RC1GM091804).
LITERATURE CITED
- Ando T, Tsukiji S, Tanaka T, Nagamune T. Construction of a small-molecule-integrated semisynthetic split intein for in vivo protein ligation. Chem Commun (Camb): 2007;4995:4997. doi: 10.1039/b712843f. [DOI] [PubMed] [Google Scholar]
- Baccanari DP, Daluge S, King RW. Inhibition of dihydrofolate reductase: Effect of reduced nicotinamide adenine dinucleotide phosphate on the selectivity and affinity of diaminobenzylpyrimidines. Biochemistry. 1982;21:5068–5075. doi: 10.1021/bi00263a034. [DOI] [PubMed] [Google Scholar]
- Bloch KD. Digestion of DNA with restriction endonucleases. Curr Protoc Immunol. 2001 doi: 10.1002/0471142735.im1008s02. Chapter 10: Unit 10 18. [DOI] [PubMed] [Google Scholar]
- Cai Y, Rossier O, Gauthier NC, Biais N, Fardin MA, Zhang X, Miller LW, Ladoux B, Cornish VW, Sheetz MP. Cytoskeletal coherence requires myosin-iia contractility. J Cell Sci. 2010;123:413–423. doi: 10.1242/jcs.058297. [DOI] [PMC free article] [PubMed] [Google Scholar]
- Calloway NT, Choob M, Sanz A, Sheetz MP, Miller LW, Cornish VW. Optimized fluorescent trimethoprim derivatives for in vivo protein labeling. Chembiochem. 2007;8:767–774. doi: 10.1002/cbic.200600414. [DOI] [PubMed] [Google Scholar]
- Chalfie M, Tu Y, Euskirchen G, Ward WW, Prasher DC. Green fluorescent protein as a marker for gene expression. Science. 1994;263:802–805. doi: 10.1126/science.8303295. [DOI] [PubMed] [Google Scholar]
- Chen Z, Jing C, Gallagher SS, Sheetz MP, Cornish VW. Second-generation covalent tmp-tag for live cell imaging. J Am Chem Soc. 2012;134:13692–13699. doi: 10.1021/ja303374p. [DOI] [PMC free article] [PubMed] [Google Scholar]
- Czlapinski JL, Schelle MW, Miller LW, Laughlin ST, Kohler JJ, Cornish VW, Bertozzi CR. Conditional glycosylation in eukaryotic cells using a biocompatible chemical inducer of dimerization. J Am Chem Soc. 2008;130:13186–13187. doi: 10.1021/ja8037728. [DOI] [PMC free article] [PubMed] [Google Scholar]
- Dempsey GT, Vaughan JC, Chen KH, Bates M, Zhuang X. Evaluation of fluorophores for optimal performance in localization-based super-resolution imaging. Nat Methods. 2011;8:1027–1036. doi: 10.1038/nmeth.1768. [DOI] [PMC free article] [PubMed] [Google Scholar]
- Fernandez-Suarez M, Chen TS, Ting AY. Protein-protein interaction detection in vitro and in cells by proximity biotinylation. J Am Chem Soc. 2008;130:9251–9253. doi: 10.1021/ja801445p. [DOI] [PMC free article] [PubMed] [Google Scholar]
- Gallagher SS, Sable JE, Sheetz MP, Cornish VW. An in vivo covalent tmp-tag based on proximity-induced reactivity. ACS Chem Biol. 2009;4:547–556. doi: 10.1021/cb900062k. [DOI] [PMC free article] [PubMed] [Google Scholar]
- Giepmans BN, Adams SR, Ellisman MH, Tsien RY. The fluorescent toolbox for assessing protein location and function. Science. 2006;312:217–224. doi: 10.1126/science.1124618. [DOI] [PubMed] [Google Scholar]
- Griffin BA, Adams SR, Tsien RY. Specific covalent labeling of recombinant protein molecules inside live cells. Science. 1998;281:269–272. doi: 10.1126/science.281.5374.269. [DOI] [PubMed] [Google Scholar]
- Heilemann M, van de Linde S, Mukherjee A, Sauer M. Super-resolution imaging with small organic fluorophores. Angew Chem Int Ed Engl. 2009;48:6903–6908. doi: 10.1002/anie.200902073. [DOI] [PubMed] [Google Scholar]
- Heim R, Prasher DC, Tsien RY. Wavelength mutations and posttranslational autoxidation of green fluorescent protein. Proc Natl Acad Sci U S A. 1994;91:12501–12504. doi: 10.1073/pnas.91.26.12501. [DOI] [PMC free article] [PubMed] [Google Scholar]
- Hoskins AA, Gelles J, Moore MJ. New insights into the spliceosome by single molecule fluorescence microscopy. Curr Opin Chem Biol. 2011;15:864–870. doi: 10.1016/j.cbpa.2011.10.010. [DOI] [PMC free article] [PubMed] [Google Scholar]
- Jing C, Cornish VW. Chemical tags for labeling proteins inside living cells. Acc Chem Res. 2011;44:784–792. doi: 10.1021/ar200099f. [DOI] [PMC free article] [PubMed] [Google Scholar]
- Jones SA, Shim SH, He J, Zhuang X. Fast, three-dimensional super-resolution imaging of live cells. Nat Methods. 2011;8:499–508. doi: 10.1038/nmeth.1605. [DOI] [PMC free article] [PubMed] [Google Scholar]
- Kasper R, Heilemann M, Tinnefeld P, Sauer M. Towards ultra-stable fluorescent dyes for single-molecule spectroscopy. European Conference on Biomedical Optics; Munich, Germany. 2007. p. 6633. [Google Scholar]
- Keppler A, Gendreizig S, Gronemeyer T, Pick H, Vogel H, Johnsson K. A general method for the covalent labeling of fusion proteins with small molecules in vivo. Nat Biotechnol. 2003;21:86–89. doi: 10.1038/nbt765. [DOI] [PubMed] [Google Scholar]
- Klein T, Loschberger A, Proppert S, Wolter S, van de Linde S, Sauer M. Live-cell dstorm with snap-tag fusion proteins. Nat Methods. 2011;8:7–9. doi: 10.1038/nmeth0111-7b. [DOI] [PubMed] [Google Scholar]
- Kramer MF, Coen DM. Enzymatic amplification of DNA by pcr: Standard procedures and optimization. Curr Protoc Immunol. 2001 doi: 10.1002/0471142735.im1020s24. Chapter 10: Unit 10 20. [DOI] [PubMed] [Google Scholar]
- Kunkel TA. Oligonucleotide-directed mutagenesis without phenotypic selection. Curr Protoc Neurosci. 2001 doi: 10.1002/0471142301.ns0410s03. Chapter 4: Unit 4 10. [DOI] [PubMed] [Google Scholar]
- Lavis LD, Raines RT. Bright ideas for chemical biology. ACS Chem Biol. 2008;3:142–155. doi: 10.1021/cb700248m. [DOI] [PMC free article] [PubMed] [Google Scholar]
- Lohman GJ, Tabor S, Nichols NM. DNA ligases. Curr Protoc Mol Biol. 2011 doi: 10.1002/0471142727.mb0314s94. Chapter 3: Unit3 14. [DOI] [PubMed] [Google Scholar]
- Long MJ, Pan Y, Lin HC, Hedstrom L, Xu B. Cell compatible trimethoprim-decorated iron oxide nanoparticles bind dihydrofolate reductase for magnetically modulating focal adhesion of mammalian cells. J Am Chem Soc. 2011;133:10006–10009. doi: 10.1021/ja202767g. [DOI] [PubMed] [Google Scholar]
- Longmire MR, Ogawa M, Hama Y, Kosaka N, Regino CA, Choyke PL, Kobayashi H. Determination of optimal rhodamine fluorophore for in vivo optical imaging. Bioconjug Chem. 2008;19:1735–1742. doi: 10.1021/bc800140c. [DOI] [PMC free article] [PubMed] [Google Scholar]
- Miller LW, Cai Y, Sheetz MP, Cornish VW. In vivo protein labeling with trimethoprim conjugates: A flexible chemical tag. Nat Methods. 2005;2:255–257. doi: 10.1038/nmeth749. [DOI] [PubMed] [Google Scholar]
- Ormo M, Cubitt AB, Kallio K, Gross LA, Tsien RY, Remington SJ. Crystal structure of the aequorea victoria green fluorescent protein. Science. 1996;273:1392–1395. doi: 10.1126/science.273.5280.1392. [DOI] [PubMed] [Google Scholar]
- Rajapakse HE, Reddy DR, Mohandessi S, Butlin NG, Miller LW. Luminescent terbium protein labels for time-resolved microscopy and screening. Angew Chem Int Ed Engl. 2009;48:4990–4992. doi: 10.1002/anie.200900858. [DOI] [PMC free article] [PubMed] [Google Scholar]
- Roth B, Aig E, Rauckman BS, Strelitz JZ, Phillips AP, Ferone R, Bushby SR, Sigel CW. 2,4-diamino-5-benzylpyrimidines and analogues as antibacterial agents. 5. 3′,5′-dimethoxy-4′-substituted-benzyl analogues of trimethoprim. J Med Chem. 1981;24:933–941. doi: 10.1021/jm00140a005. [DOI] [PubMed] [Google Scholar]
- Shaner NC, Patterson GH, Davidson MW. Advances in fluorescent protein technology. J Cell Sci. 2007;120:4247–4260. doi: 10.1242/jcs.005801. [DOI] [PubMed] [Google Scholar]
- Tsien RY. The green fluorescent protein. Annu Rev Biochem. 1998;67:509–544. doi: 10.1146/annurev.biochem.67.1.509. [DOI] [PubMed] [Google Scholar]
- Voytas D. Agarose gel electrophoresis. Curr Protoc Immunol. 2001 doi: 10.1002/0471142735.im1004s02. Chapter 10: Unit 10 14. [DOI] [PubMed] [Google Scholar]
- Wombacher R, Heidbreder M, van de Linde S, Sheetz MP, Heilemann M, Cornish VW, Sauer M. Live-cell super-resolution imaging with trimethoprim conjugates. Nat Methods. 2010;7:717–719. doi: 10.1038/nmeth.1489. [DOI] [PubMed] [Google Scholar]
- Xu J. Preparation, culture, and immortalization of mouse embryonic fibroblasts. Curr Protoc Mol Biol. 2005 doi: 10.1002/0471142727.mb2801s70. Chapter 28: Unit 28 21. [DOI] [PubMed] [Google Scholar]