

Abstract
Objective
The objective of this study is to investigate the mobilization of lead from bone to blood (endogenous exposure) in a large epidemiologic population.
Methods
Study subjects were 776 participants in the Normative Aging Study. The subjects had their tibia lead, patella lead, blood lead, and/or urinary N-telopeptide (NTx) levels measured 1-4 times from 1991 to 2002. Regression models were estimated to quantify the association between tibia and patella lead and blood lead. We studied nonlinearity of the association, and explored possible factors that may modify it, including age and NTx levels.
Results and conclusions
There is significant association between bone lead and blood lead, and the association is non-linear. The non-linear associations between blood lead and bone lead are not significantly modified by age and NTx.
Introduction
Environmental exposure to lead in the United States has been reduced substantially over the last several decades. However, lead stores in bone due to past lead exposure remain a problem for the general public. Unlike lead in blood, with a half-life of approximately 30 days [1], lead in bone has a half life of many years to decades [2]. Over 95% of lead in the human body resides in bone. Hence bone is a major deposition site for lead and bone lead is an indicator of cumulative exposure [3,4]. The use of lead in gasoline, soldering and paint is mostly responsible for the lead stored in bones in the general population. Although these sources have been greatly reduced, they continue to contribute as a significant source of lead exposure for the general population through endogenous exposure. That is, lead stored in bone serves as an endogenous source of exposure because it is gradually released to blood through bone resorption [5-7]. In this project, we investigated the endogenous exposure in an environmentally exposed elderly population. Environmentally exposed elderly men had moderate to high lead exposure history in the past, which could create significant bone lead stores. Elderly men also go through increasing bone loss [8], which could contribute to higher endogenous exposure. In addition, lead exposure leads to increased blood pressure levels [9-12] and decline of cognitive function [13], which are more prevalent in the elderly population. All these facts render endogenous exposure to lead in environmentally exposed elderly men a significant public health issue.
Endogenous exposure is more evident during periods or conditions associated with increased bone resorption; for example, childhood [14], pregnancy and lactation [15-21], menopausal transition [22-25], and skeletal and dental disease [26, 27] have been associated with elevated blood lead levels. Many studies of occupationally exposed populations demonstrate that bone lead stores are a significant endogenous lead exposure source [28-30]. However, few studies have investigated endogenous exposure for environmentally exposed populations [31], especially elderly men [32, 33], mainly due to the lack of such populations and the fact that men are less susceptible than women to increasing bone resorption with advancing age. A recent study shows that high lead exposure may change the bone remodeling pattern [29], which implies that study findings obtained from occupationally exposed populations may not be generalized to environmentally exposed populations. For occupationally exposed populations, current occupational lead exposure is normally much greater than endogenous exposure, and hence the best time to study endogenous exposure is when the occupational exposure has ceased. This confines the study subjects to retired workers [34] or striking workers [7, 35].
This study examines the association between bone lead and current blood lead in a large environmentally exposed elderly male population, and how it may vary due to age and bone resorption rates. Bone lead is assessed with in vivo K-x-ray fluorescence (KXRF). Urine cross-linked N-telopeptides of type I collagen (NTx), derived from bone collagen degradation, is considered a sensitive and specific marker of bone resorption. We tested the association between current blood lead and bone lead in an environmentally exposed population, which has been shown to be significant in previous studies [32, 33]. This study is unique in that the sample population is relatively large and hence allows the exploration and testing of the effect of age, levels of exposure, and bone resorption on the bone-blood association. To the best of our knowledge, this is the first study that explores the non-linearity of the association between bone lead and blood lead and the effect of age and bone resorption on the association in the same population for environmentally exposed people.
Materials and Methods
Study population
Study subjects were participants of the Normative Aging Study (NAS), a longitudinal study of aging established by the Veterans Administration in 1963 [36]. The study cohort initially consisted of 2280 community-based men from the Greater Boston area who were ages 21-80 at enrollment in the study. Participants were excluded if they had known chronic medical conditions such as hypertension, heart disease, cancer, recurrent asthma, sinusitis, bronchitis, diabetes, gout, or peptic ulcer. Since their enrollment in 1963-1968, study subjects have returned every 3-5 years for routine physical examinations, medical history collection, laboratory tests, and other questionnaires [32, 37]. Beginning in 1991, a blood sample for lead analysis was collected at each visit. The participants were recruited for an in vivo K-x-ray fluorescence (KXRF) bone lead measurement the same year. The participants had their blood lead and bone lead assessed every 3-5 years from 1991-2002.
All research performed in our study was approved by the Human Research Committees of Brigham and Women's Hospital, the Department of Veterans Affairs Outpatient Clinic in Boston, and the Harvard School of Public Health.
Blood and bone lead measurements
Lead in blood samples was analyzed by graphite furnace atomic absorption with Zeeman background correction (ESA Laboratories, Chelmsford, Massachusetts). The instrument was calibrated with National Institute of Standards and Technology Standard Reference Material after every 20 samples. Ten percent of samples were run in duplicate, 10% were controls, and 10% were blanks. In tests on reference samples from the Centers for Disease Control and Prevention (CDC), coefficient of variation (CV) ranged from 8% for concentrations below 30 μg/dL to 1% for higher concentrations.
Bone lead measurements were taken at two sites, the midtibial shaft (representing cortical bone) and the patella (representing trabecular bone), with an ABIOMED KXRF instrument (ABIOMED, Inc., Danvers, Massachusetts). The physical principles, technical specifications, validation, and quality control procedures of this instrument have been described in detail elsewhere [38, 39]. The tibia and patella have been targeted for bone lead research because these two bones consist mainly of pure cortical and trabecular bone respectively. A 30-min measurement was taken at these two bone sites after each region had been washed with a 50% solution of isopropyl alcohol to eliminate external contamination of lead. A 15-ppm lead-doped phantom was positioned and measured 20 consecutive times a week to check the precision and accuracy of the result as a quality control. Once every 3-6 months, a set of lead-doped phantoms with different lead concentrations was measured to check the calibration of the system.
As a check on the quality of the KXRF measurements, tibia and patella bone lead measurements with associated measurement uncertainty estimates of >10 and >15 μg/g, respectively, were identified and discarded.
Urinary N-telopeptide(NTx)
Urine samples were thawed and analyzed for NTx with a commercially available competitive-inhibition enzyme-linked immunosorbent assay [40] (Osteomark; Ostex International, Seattle, WA). NTx concentrations were expressed as nanomoles of bone collagen equivalents normalized to creatinine (nM BCE/mM creatinine). The intraassay CVs were 8.9% at 406 nM BCE and 8.7% at 1563 nM BCE; the interassay CVs were 8.6% at 427 nM BCE and 5.6% at 1513 nM BCE. To assess the reliability of urinary NTx, a second set of 24-hr urine samples were measured for NTx for a random subset of 50 participants and the intra-class correlation coefficient of these repeated measures of NTx (collected, on average, 3 years apart) was 0.87.
Other Covariates
Information on smoking and alcohol ingestion has been collected since the inception of the study. At each subject's visit, smoking status was defined as never smoker, current smoker, or former smoker. Average daily alcohol intake was also recorded during the visit [32]. The goal of the study is to investigate endogenous exposure, hence only the covariates affecting current lead exposure are included. These covariates are current smoking status, current alcohol consumption, period (measured as years since the beginning of the study to account for declining environmental exposures), and number of years of education.
Statistical analysis
Descriptive statistics were computed for all study variables. For the variables measuring lead concentration (in bone or blood), descriptive statistics were also computed within groups defined by tertiles of age, smoking status, period (before and after June 13, 1995, the median of the observation times), and degree of alcohol ingestion (classified as non-drinkers (0gm/day), light drinkers (>0 to 11gm/day), and heavier drinkers (11-38gm/day)).
The main goal of this study is to explore how lead mobilizes from bone to blood; hence, the association between bone lead and current blood lead was estimated. A basic model for this association is: blood lead = α+β*[bone lead]. The intercept α is the contribution to blood lead from sources other than bone, mainly from the environment; and β quantifies the contribution from bone lead assuming that the contribution remains constant at all levels of bone lead. As blood lead reflects current external exposure (from environmental factors) as well as internal exposure (from endogenous bone stores), we included in the regression model factors that may predict current exposure, namely age, period, current cigarette smoking status, average daily alcohol intake, and number of years of education. Age and education were centered at their average in the sample population, such that intercepts are interpretable as the average exogenous exposure in 1991 for an individual of average age and education who is a non-drinker and non-smoker.
Linear mixed models [41] were used to estimate the regression models because repeated observations per individual were included in the model. Since a given individual contributes repeated measurements over the years, the independence assumption needed for inference in ordinary linear regression is not satisfied in this data. Linear mixed models relax the independence assumption, such that correct standard errors for the coefficients of interest (i.e., correct inference) may be obtained. In the models we estimated, we included a random intercept for each study participant to account for the correlation within an individual. Ordinary linear regression models were performed to estimate the adjusted R-squares.
The bone-blood lead association was first estimated using a model with linear term for bone lead as a predictor, and blood lead as the outcome. This model quantifies the average linear association between bone and blood lead. Models assuming using log-transformed blood lead as the outcome were also estimated to obtain the relative increase in blood lead level per unit increase in bone lead concentration, as this measure of association is often of interest. However, the log-transformed model inherently assumes that blood the association between bone and blood lead is non-linear (i.e. blood lead = eαeβ*bone lead); testing whether the association is indeed non-linear was one of our hypothesis of interest.
To test the hypothesis that the blood-bone lead association is non-linear we fitted a model using linear splines with knots at the 33rd and 66th percentile of bone lead concentration. This model assumes that the slope for the bone-blood association (β) changes with increasing levels of bone lead; more specifically, that the slope differs across tertiles of bone lead concentration. The bone-blood lead association within different levels (tertiles) of bone lead concentration was estimated from the spline model, and differences in the association across tertiles were tested. We then used a likelihood ratio test to compare the spline-based model representing a non linear effect of bone lead to the model with a linear effect of bone lead. This tests the hypothesis that the bone-blood relationship is non linear.
To assess the influence of age and bone resorption (NTx) level on the release of lead from bone, we estimated models stratified by tertiles of age and NTx. Overall effect modification of the bone-blood lead by these two variables, and the pair-wise differences association across these strata were tested. Since the test for effect modification in the non-linear models of the bone-blood association by tertiles of age or NTx has low statistical power (6 df test), we also tested effect modification assuming an average linear relationship between bone and blood concentrations (2 df test). For subjects contributing observations to the models with NTx, the blood lead levels with visit dates within six months of the NTx measurement dates were chosen. The models including NTx measurements consisted of only one observation (the first one) per participant because only a few subjects had a second measure (a total of 770 observations with 160 second measurements). In models that did not include NTx as a predictor, all repeat measurements for each subject were included to increase the statistical power of the analysis. As an exploratory analysis we also examined whether period and alcohol intake modified the relationship between bone and blood lead.
Results
For the current study, 776 participants who had their tibia and patella bone lead, as well as blood lead measured at least once were identified; 427 of them had both their tibia lead and patella lead measured twice, 197 three times, and 47 four times, for a total of 1447 observations. Among the 776 participants and 1447 observations, 746 participants and 1377 observations had a complete data including all covariates. Of these 776 subjects, 642 had at least one NTx measurement, and all lead measurements (tibia, patella, and blood lead), and 610 had a complete data. The average values of tibia lead, patella lead, and blood lead, were not significantly different between the subjects with and without complete data. Other subject characteristics (age, current smoking status, number of years of education, and daily alcohol intake) did not differ either. Table 1 lists the characteristics of the complete dataset. Descriptive statistics of tibia lead, patella lead, and blood lead levels by participant characteristics (age, alcohol intake, period, and smoking status) are listed in Table 2.
Table1. Characteristics of subjects with a single NTX measurement (single NTX) and subjects with repeated (2 or more) bone lead measurements (repeat bone lead).
| Single NTX (N=610) | Repeat bone lead (subject number=746, observation number=1377)* | ||
|---|---|---|---|
| Age (years), Mean (sd) | 67.7 (7.5) | Mean (sd) | 69.2 (7.4) |
| Current smoking status, % yes | 7.0 | % yes | 5.9 |
| Daily alcohol intake (gm/day), Mean (sd) | 12.8 (18.0) | Mean (sd) | 12.8 (18.3) |
| Number of years' Edu. Mean (sd) | 14.2 (2.7) | Mean (sd) | 14.3 (2.6) |
| NTx (nM BCE/mM creatinine), Mean (sd) | 53.7 (68.7) | N.A. | |
| Tibia lead (μg/g), Mean (sd) | 21.9 (13.4) | Mean (sd) | 21.3 (13.9), 19 (14) |
| Patella lead (μg/g), Mean (sd) | 31.8 (19.2) | Mean (sd), Median (iqr) | 29.9 (20.1), 26 (20) |
| Blood lead (μg/dL), Mean (sd) | 5.9 (3.7) | Mean (sd), Median (iqr) | 5.4 (3.4), 5.0 (4) |
values are based on the 1377 observations
Table 2. Tibia lead, patella lead, and blood lead levels stratified by participant characteristics (age, alcohol intake, period, and current smoking status), subject number =746, observation number=1377.
| Median (Q1, Q3)* | ||||
|---|---|---|---|---|
| Age (years) | 1st tertile (48.3-65.7, mean 61.1) | Tibia | Patella | Blood |
| 15 (11, 21) | 22 (15, 31) | 5 (3, 7) | ||
| 2nd tertile (65.7-72.2, mean 68.9) | 20 (13, 28) | 27 (18, 39) | 5 (3, 7) | |
| 3rd tertile (72.2-93.9, mean 77.3) | 22 (16, 31) | 29 (19, 43) | 5 (3, 6) | |
| Alcohol intake (gm/day) | Non-drinker (N=354) | 19 (13, 28) | 27 (18, 38) | 4 (3, 6) |
| Light drinker (0-10.97, mean 4.58; N=511) | 20 (13, 26) | 25 (16, 37) | 4 (3, 6) | |
| Heavier drinker (10.97-37.81, mean 29.79; N=512) | 19 (12, 27) | 27 (17, 37) | 5 (4, 7) | |
| Period (year) | Before Jun.13, 1995 (N=691) | 20 (14, 28) | 27 (19, 40) | 5 (4, 8) |
| After Jun.13, 1995 (N=686) | 19 (12, 26) | 24 (15, 35) | 4 (3, 6) | |
| Current smoking status (yes or no) | Yes (5.9%) | 17 (12, 29) | 30 (19, 40) | 6 (4, 9) |
| No (94.1%) | 19 (13, 27) | 26 (17, 37) | 5 (3, 7) | |
| Smoking status (ever or never) | Ever smoker (67%) | 20 (14, 27) | 27 (17, 37) | 5 (3, 7) |
| Never smoker (33%) | 18 (11, 26) | 23 (16, 34) | 4 (3, 6) | |
values are based on the 1377 observations
The average linear associations between blood and bone lead levels, as well as the associations with other covariates, are listed in Table 3. Blood lead is strongly associated with both tibia and patella lead concentrations after adjustment for other predictors (age, period, number of years of education, current smoking status, and average daily alcohol intake). The increase of blood lead is 0.8 μg/dl with an increase of 10μg/g bone mineral for tibia; the increase of blood lead is 0.7μg/dl with an increase of 10μg/g bone mineral for patella. The adjusted R2s were 0.20 and 0.22 for association between blood lead and tibia lead, and blood lead and patella lead, respectively. From the modeling using log-transformed blood lead, the estimated relative increase in blood lead is 12% with an increase of 10μg/g bone mineral for tibia, and the relative increase of blood lead is 9% with an increase of 10μg/g bone mineral for patella (Table 4).
Table 3. Average linear association between blood lead and tibia and patella lead for all the eligible observations with linear mixed models, adjusted for other predictors.
| Predictor | Tibia model | Patella model | ||
|---|---|---|---|---|
| Parameter estimate | P value | Parameter estimate | P value | |
| Intercept | 4.72 | <.0001 | 4.55 | <.0001 |
| Tibia lead (ug/g) | 0.078 | <.0001 | ||
| Patella lead (ug/g) | 0.060 | <.0001 | ||
| Age | -0.019 | 0.23 | -0.013 | 0.37 |
| Period | -0.30 | <.0001 | -0.28 | <.0001 |
| Cur. smoking status | 1.10 | 0.006 | 1.02 | 0.010 |
| Daily alcohol intake | 0.017 | 0.001 | 0.015 | 0.003 |
| Education | -0.17 | 0.41 | -0.11 | 0.59 |
Table 4. Average linear association between log-transformed blood lead and bone lead concentration (tibia and patella) for all the eligible observations with linear mixed models, adjusted for other predictors (with blood lead>0, observation number=1371).
| Predictor | Tibia model | Patella model | ||
|---|---|---|---|---|
| Parameter estimate | P value | Parameter estimate | P value | |
| Intercept | 1.630 | <.0001 | 1.590 | <.0001 |
| Tibia lead (ug/g) | 0.0115 | <.0001 | ||
| Patella lead (ug/g) | 0.0087 | <.0001 | ||
| Age | 0.001 | 0.76 | 0.002 | 0.53 |
| Period | -0.052 | <.0001 | -0.049 | <.0001 |
| Cur. smoking status | 0.122 | 0.06 | 0.109 | 0.09 |
| Daily alcohol intake | 0.004 | <0.0001 | 0.003 | <0.0001 |
| Education | -0.012 | 0.09 | -0.010 | 0.14 |
There is evidence that the association between both bone lead concentrations and blood lead is non-linear (p-value=0.03, 0.02 for tibia and patella, respectively). Figure 1 shows the estimated non-linear association between bone lead concentrations and blood lead, while Table 5 gives the estimated association within tertiles of each bone lead concentration. The bone-blood lead association within the first tertile of patella bone lead concentration was significantly different from that in the second and third tertiles (p-value=0.03, 0.006 respectively); that in the second versus the third was not significantly different. For tibia bone lead, only the associations within the first and third tertiles differed significantly (p=0.01).
Figure 1. Association of blood lead and bone lead at different tibia lead and patella lead tertiles.

Table 5. Estimated association coefficients within tertiles of each bone lead concentration.
| Tibia Lead | Patella Lead | |||
|---|---|---|---|---|
| Bone Tertile | Estimate | P value | Estimate | P value |
| 1st | 0.018 | 0.49 | 0.006 | 0.75 |
| 2nd | 0.093 | 0.004 | 0.078 | <.0001 |
| 3rd | 0.090 | <.0001 | 0.065 | <.0001 |
| P-value | 0.03 | 0.02 | ||
|
| ||||
| Pair-wise comparison of the association coefficients | ||||
| 2nd vs. 1st | 0.075 | 0.14 | 0.072 | 0.03 |
| 3rd vs. 1st | 0.072 | 0.01 | 0.059 | 0.006 |
| 3rd vs. 2nd | -0.003 | 0.93 | -0.013 | 0.58 |
Tibia lead tertiles (μg Pb/g bone mineral): <16 (average: 9.6), 16-24 (19.4), >24 (35.5)
Patella lead tertiles (μg Pb/g bone mineral): <21 (13.2), 21-33 (26.3), >33 (51.5)
The non-linear associations between blood lead and bone lead are not significantly modified by age (p-value=0.25, p-value=0.34 for tibia and patella, respectively). That is, the shape of the nonlinear relationship between bone and blood lead is not significantly different across tertiles of age. However, the estimated regression coefficients indicated a weaker association between blood and bone lead at older ages (See Figure2). In models assuming a linear relationship between blood and bone lead levels, the bone by age interaction was marginally significant for patella (p-value=0.07), but not for tibia (p-value=0.22) lead levels. Table 6 shows the average linear association between blood an bone lead levels within age tertiles. The slope among the oldest group is flatter compared to the younger groups, although not significantly so.
Figure 2. Association between blood and bone lead at different ages (ages depicted represent the average age within age tertiles).

Table 6. Estimated association coefficients stratified by age tertile, by period, by drinking status, and by smoking status assuming a linear bone-blood association.
| Tibia Lead | Patella Lead | |||
|---|---|---|---|---|
| Age Tertile | Estimate | P value | Estimate | P value |
| 1st | 0.083 | <0.0001 | 0.068 | <0.0001 |
| 2nd | 0.090 | <0.0001 | 0.069 | <0.0001 |
| 3rd | 0.066 | <0.0001 | 0.049 | <0.0001 |
| P-value for age interaction | 0.22 | 0.07 | ||
|
| ||||
| Tibia Lead | Patella Lead | |||
| Period | Estimate | P value | Estimate | P value |
| Before Jun.13, 1995 | 0.099 | <0.0001 | 0.074 | <0.0001 |
| After Jun.13, 1995 | 0.060 | <0.0001 | 0.044 | <0.0001 |
| P-value for period interaction | <0.001 | <0.001 | ||
|
| ||||
| Tibia Lead | Patella Lead | |||
| Drinking status | Estimate | P value | Estimate | P value |
| Non-drinker | 0.094 | <0.0001 | 0.068 | <0.0001 |
| Light-drinker | 0.072 | <0.0001 | 0.059 | <0.0001 |
| Heavier-drinker | 0.070 | <0.0001 | 0.053 | <0.0001 |
| P-value for drinking status interaction | 0.28 | 0.42 | ||
|
| ||||
| Tibia Lead | Patella Lead | |||
| Smoking status | Estimate | P value | Estimate | P value |
| Never | 0.080 | <0.0001 | 0.060 | <0.0001 |
| Ever | 0.077 | <0.0001 | 0.061 | <0.0001 |
| P-value for smoking status interaction | 0.86 | 0.94 | ||
Age tertiles (years): <65.7 (mean 61.1), 65.7-72.2 (mean 68.9), >72.2 (mean 77.3)
Drinking status: non-drinker (0gm/day), light drinker (0-10.97gm/day, mean 4.58), heavier drinker (10.97-37.81gm/day, mean 29.79)
Models adjusted for age, education, alcohol intake, smoking status, and period
Neither the non-linear nor linear associations between blood lead and bone lead are significantly modified by bone resorption. However, higher bone resorption rates induce a statistically significant upward shift in the curve describing the association between bone and blood lead concentrations, i.e. there is a significant difference between the intercepts. Specifically, one interquarile range (31 Ntx Units) increase in Ntx is associated with 0.53μg/dL increase in blood lead concentration (p<0.001).
Lastly, we found that the bone by period interaction was significant for both tibia (p-value<0.001) and patella (p-value<0.001) lead levels, whereas the bone by drinking status interaction was not significant for either tibia (p-value=0.28) or patella (p-value=0.42) lead levels (Table 6).
Discussion
We observed a significant association between blood lead and bone lead, as reported in previous studies [28, 42-44]. This study has a large population, which allows us to expand the analysis to include the change of association with different exposure levels and age groups. Importantly, this study also enables us to consider bone resorption rates.
In order to compare the result of this study with those from previous studies that describe the association between bone lead and current blood lead levels [7, 34, 35], Table 7 lists the primary characteristics of the previous study groups.
Table 7. Summary of results from previous studies.
| Gerhardsson et al. 1993 | Bleecker et al. 1995 | Fleming et al. 1997 | |
|---|---|---|---|
| Study population | 30 retired workers (28) | 81 strike workers (29) | 204 strike workers (3) |
| Average age (years) | 68 | 44 | 45 |
| Ave. tibia lead (ppm) | 39.3 | 40 | 45.6 |
| Ave. patella lead (ppm) | 100.2 | N.A. | 81.6 |
| Regression coefficient (tibia and calcaneous) | T: 0.133 (95%CI 0.04-0.23)* C: 0.062 (0.02-0.11)* |
T: 0.17 (0.12-0.22) | T: 0.136 (0.11-0.16) C: 0.078 (0.06-0.09) |
| Regression intercept | T: 5.3** C: 4.0** |
T: 13.0 | T: 13.0 C: 13.0 |
unit: μg/(dl blood) per μg Pb/(g bone mineral)
unit: μg/(dl blood)
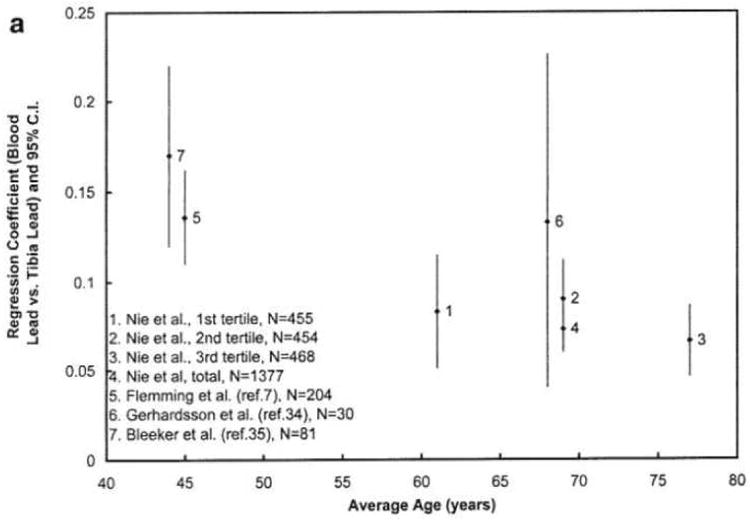
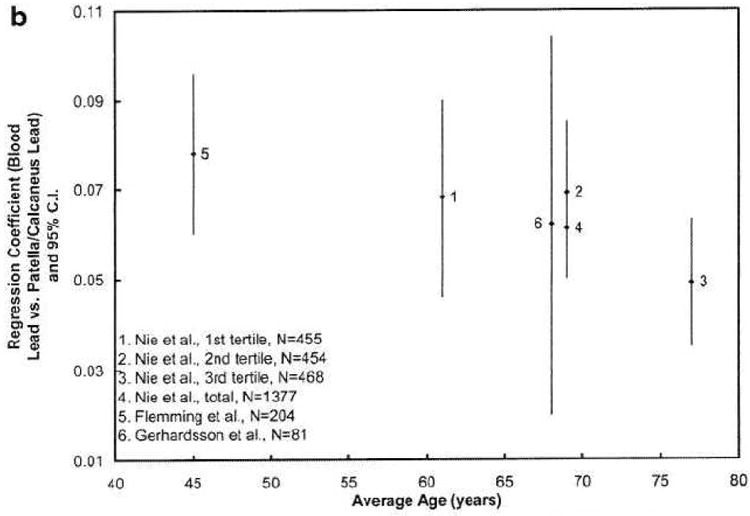
Figure 3 plots the regression coefficients for different age levels for our study and the previous studies. The regression coefficients between blood lead and tibia lead are higher at age 40 than those after age 60, i.e., the regression coefficients between blood lead and patella lead are decreasing with age. The figure suggests that the lead release rate from both types of bones to blood decreases when middle aged people get older. This may indicate a higher bone lead coefficient when the population has more recently been highly exposed, which is the case for the two younger cohorts with striking workers [7, 35]. This finding is also partially in agreement with the few studies of age-related changes in bone turnover in men [45, 46]. Bone turnover rate (hence the bone formation and bone resorption rate) is highest in young adults and decreases after the mid-thirties. However, previous studies also suggest that the bone turnover rate slightly increases when men get older, which explains why men start to lose bone after age 60. The figure demonstrates a continued decrease of regression coefficients at age >60, particularly for patella, which does not agree with the bone loss at older age. One hypothesis is that lead distribution in bone is uneven, and that lead is stored in less active bone sites for elderly people. At least two other studies indicate that lead stays in bone longer at older age [29, 47].
Figure 3. a&b Regression coefficients, relating blood lead to bone lead, according to age.
The interaction of bone lead and blood lead by period displayed in Table 6 suggests that the association is stronger for those examined before 1995. One possible reason is that the age of those who were examined before 1995 is younger than those who were examined after 1995.
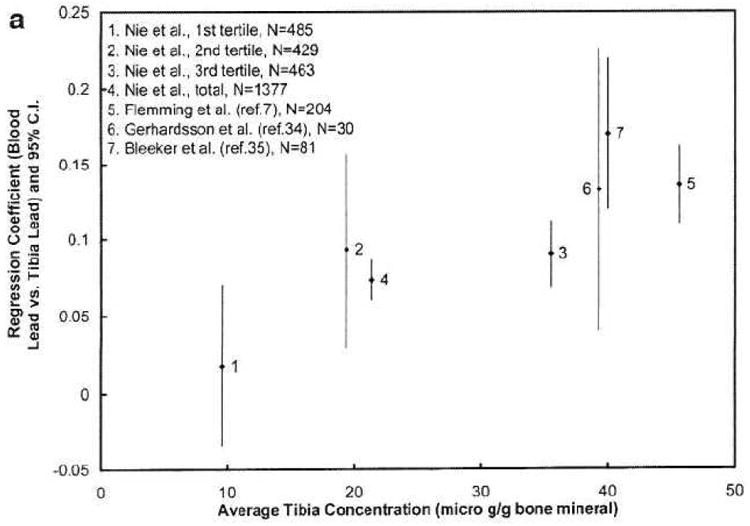
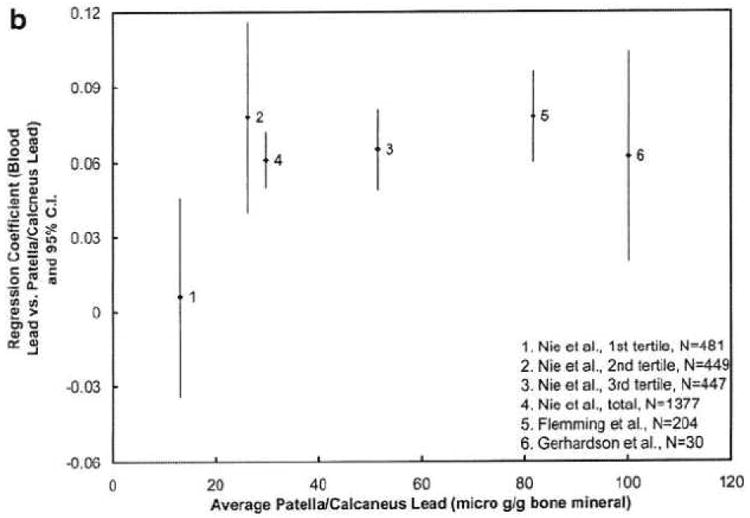
Figure 4 plots the regression coefficients for different tibia and patella lead levels. The regression coefficients between blood lead and patella lead, and blood lead and tibia lead are significantly lower at the lowest exposure (bone) level than at the highest exposure level within our study population, demonstrating that endogenous exposure is more significant in people with more extensive exposure history. If we combine our results and those of previous studies, the associations between blood lead and patella lead appear to level off or become constant at higher exposure levels, and the coefficients of blood lead and tibia lead are noticeably lower at lower exposure levels than at higher exposure levels. This could mean that bone lead affects the bone remodeling process and that it affects cortical bone more than trabecular bone in this process in elderly men. Further research is required to confirm this conclusion.
Figure 4. a&b Regression coefficients, relating blood lead to bone lead, according to bone lead level.
The association between lead in blood and lead in both tibia bone and patella bone is not significantly different among different NTx tertiles. This is not consistent with what was reported in Tsaih et al.'s paper [33], showing the relation of patella lead to blood lead was significantly stronger in the upper NTx tertiles. However, in our study, the intercept for the regression of blood lead on bone lead varied significantly across categories of NTx, suggesting that higher NTx levels are associated with higher blood lead levels, and that the mechanism may not only be explained by different bone resorption rates. The hypothesis stated above, i.e. lead distribution in bone is uneven, and it stores in less active bone sites for elderly people, can explain why higher bone resorption leads to higher blood lead, but not necessarily higher association coefficient between bone lead and blood lead concentrations. The reason is that, while blood lead concentration increases with bone resorption, bone lead concentration can increase as well due to the resorption of bone with lower lead concentration.
Many metabolism models have been developed to study lead mobilization in the human body [6, 48-50], yet even the most accepted models were proven to have problems in accurately predicting lead mobilization in the human body, partly due to the lack of human data on the transfer rates between critical organs [47, 51]. This study provides further information about lead exposure and bone remodeling in elderly men and hence contributes valuable information to improve those models. For example, this study suggests lead exposure affects the lead release rate from bone to blood, however, none of the models considered the effect of lead exposure to the release rates (termed “transfer rates” in the models). In addition, this study indicates age affects the transfer rates from bone to blood, while the models assume a constant transfer rate for adults. Furthermore, if the hypothesis regarding higher bone lead concentration at less active bone sites for elderly men is correct, then the models have to be adjusted for that as well.
One of the limitations of this study is that the model adjusted only for current smoking status, alcohol intake, period, and number of years of education. Other potential factors that might affect current lead exposure, e.g. the working status of the subject, age of the household, whether there is lead paint in the house, etc., are not adjusted. This may affect the association coefficients and the significance of the association between blood lead and bone lead.
In summary, our findings are consistent with the hypothesis that there is significant endogenous lead release from bone to blood in elderly men. Our findings also indicate that the associations between both tibia and patella lead concentrations and blood lead are non-linear.
Acknowledgments
The research described in this paper was supported primarily by NIEHS R01- ES005257, R01-ES007821, and R01-ES010798. Test subjects were evaluated for measurement of bone lead levels in the outpatient Clinical Research Center of the Brigham and Women's Hospital. The KXRF instrument used in some of this work was developed by ABIOMED, Inc., of Danvers, Massachusetts, with support from NIH grant no. SBIR 2R44 ES03918-02. The contents of this manuscript are solely the responsibility of the authors and do not necessarily represent the official views of the NIEHS.
Footnotes
The authors declare they have no competing financial interests
Publisher's Disclaimer: This is a PDF file of an unedited manuscript that has been accepted for publication. As a service to our customers we are providing this early version of the manuscript. The manuscript will undergo copyediting, typesetting, and review of the resulting proof before it is published in its final citable form. Please note that during the production process errors may be discovered which could affect the content, and all legal disclaimers that apply to the journal pertain.
References
- 1.Rabinowitz MB. Toxicokinetics of bone lead. Environ Health Perspect. 1991;91:33–7. doi: 10.1289/ehp.919133. [DOI] [PMC free article] [PubMed] [Google Scholar]
- 2.Hu H, Rabinowitz M, Smith D. Bone lead as a biological marker in epidemiologic studies of chronic toxicity: conceptual paradigms. Environ Health Perspect. 1998;106:1–8. doi: 10.1289/ehp.981061. [DOI] [PMC free article] [PubMed] [Google Scholar]
- 3.Barry PS, Mossman DB. Lead concentrations in human tissues. Br J Ind Med. 1970;27:339–51. doi: 10.1136/oem.27.4.339. [DOI] [PMC free article] [PubMed] [Google Scholar]
- 4.Schroeder HA, Tipton IH. The human body burden of lead. Arch Environ Health. 1968;17:965–78. doi: 10.1080/00039896.1968.10665354. [DOI] [PubMed] [Google Scholar]
- 5.Erkkila J, Armstrong R, Riihimaki V, Chettle DR, Paakkari A, Scott M, et al. In vivo measurement of lead in bone at four anatomical sites: long term occupational and consequent endogenous exposure. Br J Ind Med. 1992;49:631–644. doi: 10.1136/oem.49.9.631. [DOI] [PMC free article] [PubMed] [Google Scholar]
- 6.Leggett RW. An age-specific kinetic model of lead metabolism in humans. Environ Health Perspect. 1993;101:598–616. doi: 10.1289/ehp.93101598. [DOI] [PMC free article] [PubMed] [Google Scholar]
- 7.Fleming DEB, Boulay D, Richard NS, Robin JP, Gordon CL, Webber CE, Chettle DR. Accumulated body burden and endogenous release of lead in employees of a lead smelter. Environ Health Perspect. 1997;105:224–233. doi: 10.1289/ehp.97105224. [DOI] [PMC free article] [PubMed] [Google Scholar]
- 8.ICRP. Basic anatomical and physiological data for use in radiological protection: the skeleton 70. Elmsford, NY: International Commission on Radiological Protection; 1995. [PubMed] [Google Scholar]
- 9.Hu H, Aro A, Payton M, Korrick S, Sparrow D, Weiss ST, Rotnitzky A. The relationship of bone and blood lead to hypertension: The Normative Aging Study. JAMA. 1996;275:1171–1176. [PubMed] [Google Scholar]
- 10.Glenn BS, Bandeen-Roche K, Lee BK, Weaver VM, Todd AC, Schwartz BS. Changes in systolic blood pressure associated with lead in blood and bone. Epidemiology. 2006;17:538–544. doi: 10.1097/01.ede.0000231284.19078.4b. [DOI] [PubMed] [Google Scholar]
- 11.Navas-Acien A, Guallar E, Silbergeld EK, Rothenberg SJ. Lead exposure and cardiovascular disease – a systematic review. Environ Health Perspect. 2007;115:472–482. doi: 10.1289/ehp.9785. [DOI] [PMC free article] [PubMed] [Google Scholar]
- 12.Navas-Acien A, Schwartz BS, Rothenberg SJ, Hu H, Silbergeld EK, Guallar E. Bone lead levels and blood pressure endpoints: a meta-analysis. Epidemiology. 2008;19:496–504. doi: 10.1097/EDE.0b013e31816a2400. [DOI] [PubMed] [Google Scholar]
- 13.Shih R, Hu H, Weisskopf MG, Schwartz BS. Cumulative Lead Dose and Cognitive Function in Adults: a Review of Studies that Measured Both Blood Lead and Bone Lead. Environ Health Perspect. 2007;115:483–492. doi: 10.1289/ehp.9786. [DOI] [PMC free article] [PubMed] [Google Scholar]
- 14.Gwiazda R, Campbell C, Smith D. A noninvasive isotopic approach to estimate the bone lead contribution to blood in chidren: implications for assessing the efficacy of lead abatement. Envoron Health Perspect. 2005;113:104–110. doi: 10.1289/ehp.7241. [DOI] [PMC free article] [PubMed] [Google Scholar]
- 15.Hernandez AM, Gonzalez CT, Palazuelos E, Romieu I, Aro A, Fishbein E, et al. Dietary and environmental determinants of blood and bone lead levels in lactating postpartum women living in Mexico City. Environ Health Perspect. 1996;104:1076–1082. doi: 10.1289/ehp.961041076. [DOI] [PMC free article] [PubMed] [Google Scholar]
- 16.Brown MJ, Hu H, Gonzales CT, Peterson KE, Sanin LH, Kageyama ML, et al. Determinants of bone and blood lead concentrations in the early postpartum period. Occup Environ Med. 2000;57:535–541. doi: 10.1136/oem.57.8.535. [DOI] [PMC free article] [PubMed] [Google Scholar]
- 17.Gulson BL, Pounds JG, Mushak R, Thomas BJ, Gray B, Korsch MJ. Estimation of cumulative lead releases (lead flux) from the maternal skeleton during pregnancy and lactation. J Lab Clin Med. 1999;134:631–640. doi: 10.1016/s0022-2143(99)90104-x. [DOI] [PubMed] [Google Scholar]
- 18.Gulson BL, Mizon KJ, Korsch MJ, Palmer JM, Donnelly JB. Mobilization of lead from human bone tissue during pregnancy and lactation – a summary of long-term research. The Science of the Total Environment. 2003;303:79–104. doi: 10.1016/s0048-9697(02)00355-8. [DOI] [PubMed] [Google Scholar]
- 19.Rothenberg SJ, Khan F, Manalo AM, Jiang j, Cuellar R, Reyes S, et al. Maternal bone lead contribution to blood lead during and after pregnancy. Environmental Res. 2000;82:81–90. doi: 10.1006/enrs.1999.4007. [DOI] [PubMed] [Google Scholar]
- 20.Tellez-Rojo MM, Hernandez-Avila M, Gnzalez-Cossio T, Romieu I, Aro A, Palazuelos E, et al. Impact of breast-feeding on the mobilization of lead from bone. Am J Epidemiol. 2002;155:420–428. doi: 10.1093/aje/155.5.420. [DOI] [PubMed] [Google Scholar]
- 21.Manton WI, Angle CR, Stanek KL, Kuntzelman D, Reese YR, Kuehnemann TJ. Release of lead from bone in pregnancy and lactation. Environ Res. 2003;92:139–151. doi: 10.1016/s0013-9351(03)00020-3. [DOI] [PubMed] [Google Scholar]
- 22.Hernandez AM, Villalpando CG, Palazuelos E, Hu H, Villalpando MEG. Determinants of blood lead levels across the menopausal transition. Archives of Environmental Health. 2000;55:355–360. doi: 10.1080/00039890009604028. [DOI] [PubMed] [Google Scholar]
- 23.Korrick SA, Schwartz J, Tsaih SW, Hunter DJ, Aro A, Rosner B, et al. Correlates of bone and blood lead levels among middle-aged and elderly women. American Journal of Epidemiology. 2002;156:335–343. doi: 10.1093/aje/kwf042. [DOI] [PubMed] [Google Scholar]
- 24.Latorre FG, Hernandez-Avila M, Orozco JT, Medina CA, Aro A, Palazuelos E, Hu H. Relationship of blood and bone lead to menopause and bone mineral density among middle-age women in Mexico City. Environ Health perspect. 2003;111:631–636. doi: 10.1289/ehp.111-1241456. [DOI] [PMC free article] [PubMed] [Google Scholar]
- 25.Berkowitz GS, Wolff MS, Lapinski RH, Todd AC. Prospective study of blood and tibia in women undergoing surgical menopause. Environ Health Perspect. 2004;112:1673–1678. doi: 10.1289/ehp.7005. [DOI] [PMC free article] [PubMed] [Google Scholar]
- 26.Berlin K, Gerhardsson L, Borjesson J, Lindh E, Lundstrom N, Schutz A, et al. Lead intoxication caused by skeletal disease. Scand J Work Environ Health. 1995;21:296–300. doi: 10.5271/sjweh.42. [DOI] [PubMed] [Google Scholar]
- 27.Dye BA, Hirsch R, Brody DJ. The relationship between blood lead levels and periodontal bone loss in the United States, 1888-1994. Environ Health Perspect. 2002;110:997–1002. doi: 10.1289/ehp.02110997. [DOI] [PMC free article] [PubMed] [Google Scholar]
- 28.Nilsson U, Attewell R, Christoffersson JO, Schütz A, Ahlgren L, Skerfving S, et al. Kinetics of lead in bone and blood after end of occupational exposure. Pharmacol Toxicol. 1991;68:477–484. doi: 10.1111/j.1600-0773.1991.tb01273.x. [DOI] [PubMed] [Google Scholar]
- 29.Brito JA, McNeill FE, Stronach I, Webber CE, Wells S, Richard N, Chettle DR. Longitudinal changes in bone lead concentration: implications for modeling of human bone lead metabolism. J Environ Monit. 2001;3:343–351. doi: 10.1039/b101493p. [DOI] [PubMed] [Google Scholar]
- 30.Chettle DR. Three decades of in vivo x-ray fluorescence of lead in bone. X-ray Spectrometry. 2005;34:446–450. [Google Scholar]
- 31.McNeill FE, Stokes L, Brito JAA, Chettle DR, Kaye WE. 109Cd K x ray fluorescence measurements of tibial lead content in young adults exposed to lead in early childhood. Occup Environ Med. 2000;57:465–471. doi: 10.1136/oem.57.7.465. [DOI] [PMC free article] [PubMed] [Google Scholar]
- 32.Hu H, Payton M, Korrick S, Aro A, Sparrow D, Scott TW, et al. Determinants of bone and blood led levels among community-exposed middle-aged to elderly men: The Normative Aging Study. Am J Epidemiol. 1996;144:749–759. doi: 10.1093/oxfordjournals.aje.a008999. [DOI] [PubMed] [Google Scholar]
- 33.Tsaih S, Korrick S, Schwartz J, Lee MT, Amarasiriwardena C, Aro A, et al. Influence of bone resorption on the mobilization of lead from bone among middle-aged and elderly men: the Normative Aging Study. Environ Health Perspect. 2001;1091:995–999. doi: 10.1289/ehp.01109995. [DOI] [PMC free article] [PubMed] [Google Scholar]
- 34.Gerhardsson L, Attewell R, Chettle DR, Englyst V, Lundström, Nordberg GF, et al. In vivo measurements of lead in bone in long-term exposed lead smelter workers. Archives of Environmental Health. 1993;48:147–156. doi: 10.1080/00039896.1993.9940813. [DOI] [PubMed] [Google Scholar]
- 35.Bleecker ML, Mcneill FE, Lindgren KN, Masten VL, Ford DP. Relationship between bone lead and other indices of lead exposure in smelter workers. Toxicology Letters. 1995;77:241–248. doi: 10.1016/0378-4274(95)03303-3. [DOI] [PubMed] [Google Scholar]
- 36.Bell B, Rose CL, Damon A. The Normative Aging Study: an interdisciplinary and longitudinal study of health and aging. Aging Human Develop. 1972;3:4–17. [Google Scholar]
- 37.Payton M, Hu H, Sparrow D, Weiss ST. Low-level Lead Exposure and Renal Function in the Normative Aging Study. Am J Epidemiol. 1994;140:821–829. doi: 10.1093/oxfordjournals.aje.a117330. [DOI] [PubMed] [Google Scholar]
- 38.Hu H, Milder F, Burger DE. X-ray fluorescence measurements of lead burden in subjects with low-level community lead exposures. Arch Environ Health. 1990;45:335–341. doi: 10.1080/00039896.1990.10118752. [DOI] [PubMed] [Google Scholar]
- 39.Burger DE, Milder F, Morsillo P, Adams B, Hu H. Automated instrument for making K-X-ray fluorescence measurements in human bone. Basic Life Sci. 1990;55:287–293. doi: 10.1007/978-1-4613-1473-8_39. [DOI] [PubMed] [Google Scholar]
- 40.Hanson DA, Weis MA, Bollen AM, Maslan SL, Singer FR, Eyre DR. A specific immunoassay for monitoring human bone resorption: quantitation of type I collagen cross-linked N-telopeptides in urine. J Bone Miner Res. 1992;7:1251–1258. doi: 10.1002/jbmr.5650071119. [DOI] [PubMed] [Google Scholar]
- 41.Laird NM, Ware JH. Random-effects models for longitudinal data. Biometrics. 2008;38:963–974. [PubMed] [Google Scholar]
- 42.Smith DR, Osterloh JD, Russell F, et al. Use of endogenous, stable lead isotopes to determine release of lead from the skeleton. Environ Health Perspect. 1996;104:60–66. doi: 10.1289/ehp.9610460. [DOI] [PMC free article] [PubMed] [Google Scholar]
- 43.Bleecker ML, Lindgren KN, Tiburzi MJ, Ford DP. Curvilinear relationship between blood lead and reaction time: differential association with blood lead fractions derived from exogenous and endogenous sources. J Occup Environ Med. 1997;39:426–431. doi: 10.1097/00043764-199705000-00008. [DOI] [PubMed] [Google Scholar]
- 44.Fleming DEB, Chettle DR, Wetmur JG, Desnick RJ, Robin J, Boulay D, et al. Effect of the δ-Aminolevulinate Dehydratase polymorphism on the accumulation of lead in bone and blood in lead smelter workers. Environmental Research A. 1998;77:49–61. doi: 10.1006/enrs.1997.3818. [DOI] [PubMed] [Google Scholar]
- 45.Fatayerji D, Eastell R. Age related changes in bone turnover in men. J Bone Miner Res. 1999;14(7):1203–1210. doi: 10.1359/jbmr.1999.14.7.1203. [DOI] [PubMed] [Google Scholar]
- 46.Szulc P, Garnero P, Munoz F, Marchand F, Delmas PD. Cross-sectional evaluation of bone metabolism in man. J Bone Miner Res. 2001;16:1642–1650. doi: 10.1359/jbmr.2001.16.9.1642. [DOI] [PubMed] [Google Scholar]
- 47.Nie HL, Chettle DR, Webber CE, Brito JAA, O'Meara JM, McNeill FE. The Study of Age Influence on Human Bone Lead Metabolism by Using a Simplified model and X-ray Fluorescence Data. The Journal of Environmental Monitoring. 2005;7:1069–1073. doi: 10.1039/b507749d. [DOI] [PubMed] [Google Scholar]
- 48.Rabinowitz MB, Wetherill GW, Koppel JD. Kinetic analysis of lead metabolism in health humans. J Clin Invest. 1976;58:260–270. doi: 10.1172/JCI108467. [DOI] [PMC free article] [PubMed] [Google Scholar]
- 49.O'Flaherty EJ. Physiologically based models for bone-seeking elements. IV. Kinetics of lead disposition in humans. Toxicol Appl Pharmacol. 1993;118:16–29. doi: 10.1006/taap.1993.1004. [DOI] [PubMed] [Google Scholar]
- 50.Stern AH. Derivationof a target concentration of Pb in soil based on elevation of adult blood pressure. Risk Analysis. 1996;16:201–210. doi: 10.1111/j.1539-6924.1995.tb00778.x. [DOI] [PubMed] [Google Scholar]
- 51.Fleming DE, Chettle DR, Webber CE, O'Flaherty EJ. The O'Flaherty model of lead kinetics: an evaluation using data from a lead smelter population. Toxicol Appl Pharmacol. 1999;161:100–109. doi: 10.1006/taap.1999.8790. [DOI] [PubMed] [Google Scholar]