

Abstract
The feasibility of using EDXRF for a rapid quantitative analysis of gold in tumor tissue has been investigated. The protocol described here demonstrates that sample biopsies can be analyzed in as little as 8 hours, with minimal sample preparation. Samples were prepared by drying a 35 μL aliquot of tissue dissolved in KOH in a standard EDXRF cup on a Prolene® support, producing a thin sample. Calibration curves of XRF peak intensity (CPS/mA) to the gold concentration (0–50 PPM) were prepared for liver, tumor, and a mix of tissue types. A linear regression demonstrated an R2 correlation of 0.93. Analysis of experimental samples showed that gold accumulation in tumors (5.8–41.3 PPM) was in agreement with previous studies, where samples were processed using INAA or ICP-MS. This report provides guidance for elemental analysis of gold in tissue in a shorter time span, showing potential for its use in a clinical setting.
Introduction
Experimental studies in nanomedicine employ different types of metal nanoparticles (NP). For example, gold NPs are being used in animal and human trials for assessing the feasibility of photothermal ablation of inoperable solid tumors.1–3 A potential way to enhance efficacy in such cancer therapies is to increase feedback through additional clinical signs during the accumulation and treatment phases. Nanoparticle systems could be coupled with individualized pharmacokinetics and elemental analysis of ex vivo tissue to confirm uptake and retention into the tumor. Concurrently, innovative medical devices are being developed to provide near-instantaneous pharmacokinetic feedback,4–5 suggesting the need for an elemental analysis technique that provides similarly rapid quantitative feedback of biodistribution. These analyses could assess when, and to what degree, the particles were accumulating in the tumor, or if they were being eliminated by the reticuloendothelial system (RES). The use of rapid elemental analysis coupled with real-time pharmacokinetic4–5 measurements could help predict the most appropriate time for animal or human ablation (e.g. photothermal) of the tumor. For animal studies, a faster technique can have a major impact for companies involved in nanomaterial quality control and product development. For human trials, the ability to measure, or predict, the accumulation of the NPs in the target tissues could improve treatment outcomes for some of the approximately 52,000 anticipated deaths due to cancers targeted by this therapy each year, in the United States.6
Biodistribution of gold nanorods is normally analyzed through inductively coupled plasma mass spectrometry (ICP-MS) or instrumental neutron activation analysis (INAA).7–9 ICP-MS requires elaborate and time consuming sample preparation (up to 104 hours).10 INAA does not require a long sample digestion and preparation, but requires longer analysis.9 Although both of these techniques are accurate, they take from days to weeks to get results, longer than a clinical treatment time of one day. If the data were available within the clinical treatment time, we hypothesize that some accuracy could be sacrificed compared to these standard methods.
Energy Dispersive X-Ray Fluorescence (EDXRF) is a technique used for bulk and ppm elemental analysis that is rapid, robust and requires little sample preparation time.11 EDXRF has been previously used for quantitative in vivo and ex vivo analysis of gold in tissues like kidney and liver.12–13 Previous work with biological samples demonstrates the need for thin samples, so that matrix effects can be neglected.14 Common EDXRF protocols require a long process of drying, crushing, and pressing samples into pellets.14–15 Based on guidance from the literature towards optimizing a rapid sample preparation, the key aspects of this protocol include: sample thickness, geometry, and homogeneity.14
This paper outlines the procedure developed for a benchtop EDXRF elemental gold analysis of gold nanorods (≈ 15 × 45 nm), an optically absorptive cylindrical nano-object used in nanomedicine.7, 16 The protocol presented in this report includes tissue digestion/homogenization in potassium hydroxide followed by desiccation in the sample cup before EDXRF analysis. Using subcutaneous mouse tumors, the elemental analysis was completed in less than 12 hours from the time of tissue collection.
Materials and Methods
Animal Experiments
All experiments were conducted using BALB/c female mice inoculated with CT26.WT tumors on the subcutaneous flank. The accumulation experiment was performed on animals with a target tumor size of greater than 5 mm in length and width. All animals were handled and cared for in accordance with the Louisiana Tech University and Nanospectra Biosciences, Inc. (NBI, Houston, TX) Institutional Animal Care and Use Committees.
Temperature Control
Prior to injection and for three and a half hours after injection the animal was kept under specific temperature control (35–39°C), to facilitate intravenous cannulation and to normalize the extravasation of the gold nanorods.7
Dose Groups
For this experiment two dose groups were used. Both of the groups were based on the multiples of standard dose administered by NBI. The first group received 4.5 μL/g subject weight of 100 optical density gold nanorods (Dose group A) and the second group received 9 μL/g of 100 optical density gold nanorods (Dose group B).
Anesthesia
For this experiment we used 2,2,2-Tribromoethanol (Sigma-Aldrich T48402) mixed with 2-Methyl-2-Butanol (Alfa Aesar A18304), more commonly referred to as Avertin, administered via intraperitoneal (IP) injection. The working solution of Avertin was administered at 30 μL of solution per gram body weight. Booster injections (0.5x) were delivered as necessary.
Injection
Nanorod injections were administered via intravenous cannulation of the tail vein, using a 28 GA needle. The injections were given at a rate of 9–18 μL/minute depending on dose volume and expected remaining time under anesthesia.
End of Experiment and Organ Collection
At the end of the experiment, defined as when the bioavailability of circulating nanorods reached 1 optical density,4 a 20 μL IP injection of a Ketamine/ Xylazine mix was administered as heavy anesthesia. A dissection was started from the base of the abdominal cavity to sacrifice the animal by exsanguination via cardiac puncture using a 22 GA needle/syringe prefilled with 100 μL of heparin. After animal sacrifice the following tissues were collected for further study: heart, lungs, liver, kidneys, spleen, and tumor.
EDXRF Sample Prep
A wet weight of the tissue was obtained at the time of extraction. A 20% w/w KOH solution was added to the tissue based on the sample weight (3 μL/mg). The tissue and base solution were placed in a shaker or rocker until the tissue liquified, approximately 4–6 hours. Aliquots of 35 μL (selected to cover our area of detection: 15 mm × 12mm, containing approximately 0.04 g of tumor tissue) were placed in EDXRF sample cups on a Prolene® thin film support (Chemplex Industries Inc., 4μm thick, Cat. # 3017). The tissue solution was then dried in the sample cup for 2 hours in a vacuum oven at 30° C under 15 in Hg vacuum to reduce the movement of sample. The samples were analyzed in an ARL Quant’X (Thermo Scientific) EDXRF spectrometer (4–50 KV x-ray generator, Be window, with 80° geometry between x-ray tube, sample, and detector) using a thick Palladium filter (Mid-Zc range) for 2 minutes (50% dead time). Three replicates were prepared from most tissue samples. Each sample cup was scanned 10 times which produced up to 30 spectra for each tumor. The spinner was turned on during each scan to minimize error from the sample placement in the cup.
Data analysis
An example of the raw data (e.g. experimental group B, 2 of 9) obtained from the EDXRF instrument is shown in Figure 1. Each spectrum was analyzed to compute the calibration curve shown in Figure 2 for a range of gold concentrations in tissue. From the spectra, two regions of interests (ROI) were chosen. The ROI 1 represents the region for the Lα1 peaks for gold (9.712 KeV). However, that region lies very close to the Kβ1 peak for zinc (9.570 KeV). The zinc found in the sample is attributed to zinc/ aluminum alloy used in the sample chamber lid.17–18 The data (in counts) was normalized in terms of tube current (counts/mA) to remove the zinc overlay from the gold peak, and the normalized background was subtracted from all the data points. A standard value of counts for zinc (obtained from the repeated runs of 0 ppm) sample was then subtracted from all the samples. After the subtraction, the values were normalized to obtain the peak intensity values (counts per second/mA). The peak intensity values of the calibration set were plotted against the actual concentration (of standard gold solution in tissue) to produce a calibration curve.
Fig. 1.
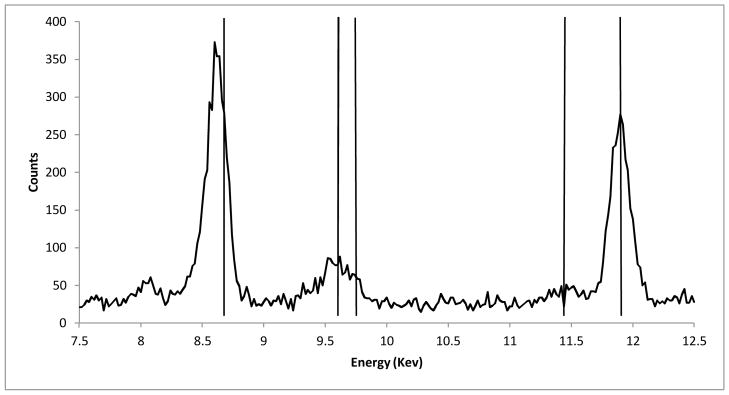
A raw spectrum of a sample from the calibration set (PPM value = 21.73). Vertical lines from left to right: Zn Kα1 line (8.631 Kev), Zn Kβ1 line (9.572 Kev), Au Lα1 line (9.711 Kev), Au Lβ1line (11.439 Kev), Br Kα1 line (11.907 Kev). These lines contribute to counts at each given energy.
Fig. 2.

The graph of the peak intensity vs. concentration of gold in tissue for a sample of the Calibration data (Δ), Experimental group A samples (x, n=8), and Experimental Group B Samples (o, n=9). The linear correlation(dashed line) (y = 0.07126x+0.09984, R2=0.93) and 95% prediction interval are shown (solid lines).
Calibration
A commercially available gold solution was used to develop an internal standard for calibration. Naive tissues (liver, CT26.WT tumor, and a mix of the RES system) were homogenized as previously described and mixed with a 1 mg/mL gold standard solution (VWR Catalog No. 200057-722, Acros Organics, NJ) to produce a range of concentrations of gold in tissue (0–50 ppm), shown in Figure 2 (sensitivity= 0.07126 cps/mA/PPM, R2= 0.93).
Results and Discussion
The EDXRF protocol for gold in tissue was designed with the following aims: quick and easy sample preparation, thin samples, and quantitative results. A 20% KOH solution was chosen, after experimentation, to minimize the time for liquefaction of the tissue. Thin sample geometry was implemented because thick samples were impractical given the amount of tissue available, and to avoid intermediate sample thickness. An aliquot of 35 μL of tissue was selected to create a thin sample area entirely in the detection geometry of the detector. Quantitative results were obtained through the use of the same tissue dilutions and same sample scan time; doped tissue samples for calibration were able to provide a linear relationship between counts and tissue concentration.
The calibration curve was used to obtain the values of concentrations (in ppm) for tumor samples (dose group A: n=8, mean = 10.7 PPM, STDEV = ±5.8 PPM, and dose group B: n=9, mean = 25.3, STDEV = ±6.9 PPM). An analysis of the peak intensity (CPS/mA) versus the gold concentration (PPM) using different tissue types showed an R2 correlation of greater than or equal to 0.93, despite having different slopes (0.07303–0.0856 cps/mA/PPM). We hypothesize that the small variations observed in reported slopes were attributable to variations in tissue densities given that the regressions were similar when multiple preparations of the same tissue type were analyzed. The calculated concentration values for gold in tumors were similar to the work published by Huang et al., which used industry standard methods.8 Commercial laboratories which employ INAA or ICP-MS to analyze gold concentration report a detection limit in the low PPB range. This EDXRF analysis method demonstrates a detection limit of 1.4 ppm (3σ) and a sensitivity of 0.07126 cps/mA/PPM. This higher detection limit is acceptable due to the clinical requirements of rapid results in the PPM range.
The majority of the problems encountered were due to the presence of other elements that spectrally overlapped with one or more of the peaks of interest, as seen in previous work.17 The zinc Kβ1 peak (9.570 Kev) overlaps the Lα1 peak for gold (9.712 Kev). Other peaks were explored for potential use; a second peak, the Lβ peak (11.204–11.914 Kev), for gold overlapped the Kβ1 bromine peak (11.906 Kev). The bromine peak was attributed to the use of avertin (2-2-2-tribromoethanol) as the anesthesia for this experiment. The bromine peak was only observed in tissue samples where avertin was used as the anesthesia. For this reason, the use of anesthesia may impact the elemental analysis of tissues and should be considered among the criteria for selecting anesthesia in experimental design.
Conclusion
This report demonstrates the feasibility of EDXRF for quantitative analysis of gold in animal tissues in the restrictive clinical time frame of 12 hours. This technique continues to be used in our animal research due to ease of use and short turnaround time. Additional quantitative studies would be required to fully validate the technique and characterize the sources of errors in the protocol prior to human clinical use.
Acknowledgments
The authors gratefully acknowledge the contribution of the National Science Foundation (Grant No. 1032176), the National Institutes of Health (NCMHD - 1R41MD006167-01), the Louisiana Board of Regents (LEQSF RD-B-07), and the Louisiana Space Consortium and NASA (NNG05GH22H). Any opinions, findings, and conclusions or recommendations expressed in this material are those of the author(s) and do not necessarily reflect the views of the National Science Foundation, the National Institutes of Health, or the Louisiana Board of Regents.
References
- 1.O’Neal DP, Hirsch LR, Halas NJ, Payne JD, West JL. Cancer Lett. 2004;209:171–176. doi: 10.1016/j.canlet.2004.02.004. [DOI] [PubMed] [Google Scholar]
- 2.Day ES, Morton JG, West JL. Journal of Biomech Eng. 2009;131:074001-1–074001-5. doi: 10.1115/1.3156800. [DOI] [PubMed] [Google Scholar]
- 3.Kim BYS, Rutka JT, Chan WCW. N Engl J Med. 2010;363:2434–2443. doi: 10.1056/NEJMra0912273. [DOI] [PubMed] [Google Scholar]
- 4.Michalak GJ, Schwartz JA, Goodrich GP, O’Neal DP. Opt Express. 2010;18:26535–26549. doi: 10.1364/OE.18.026535. [DOI] [PubMed] [Google Scholar]
- 5.Michalak GJ, Goodrich GP, Schwartz JA, James WD, O’Neal DP. J Biomed Opt. 2010;15:047007-1–047007-5. doi: 10.1117/1.3454374. [DOI] [PubMed] [Google Scholar]
- 6.American Cancer Society. Cancer Facts & Figures 2012. Atlanta: American Cancer Society; 2012. [Google Scholar]
- 7.Goodrich GP, Bao L, Gill-Sharp K, Sang KL, Wang J, Payne JD. J Biomed Opt. 2010;15:018001-1–018001-8. doi: 10.1117/1.3290817. [DOI] [PubMed] [Google Scholar]
- 8.Huang X, Peng X, Wang Y, Wang Y, Shin DM, El-Sayed MA, Nie S. ACS Nano. 2010;4(10):5887–5896. doi: 10.1021/nn102055s. [DOI] [PMC free article] [PubMed] [Google Scholar]
- 9.James WD, Hirsch LR, West JL, O’Neal PD, Payne JD. J Radioanal Nucl Chem. 2007;271:455–459. [Google Scholar]
- 10.Hoffman GL. U S Geological Survey. Denver, CO: 1996. [Google Scholar]
- 11.Anzelmo J, Seyfarth A, Arias L. Int Cent For Diffr Data. 2001;44:368–373. [Google Scholar]
- 12.Borjesson J, Mattsson S. Int Cent for Diffr Data. 2007:1–14. [Google Scholar]
- 13.Scott J, Lillicrap S. Phys Med Biol. 1988;33:859–864. doi: 10.1088/0031-9155/33/7/009. [DOI] [PubMed] [Google Scholar]
- 14.Szczerbowska-Boruchowska M. X-Ray Spectro. 2012;41:328–337. [Google Scholar]
- 15.Bacso J, Uzonyi I, Dezso B. Int J Radiat Appl Instrum Part A. 1987;39:323–326. doi: 10.1016/0883-2889(88)90023-8. [DOI] [PubMed] [Google Scholar]
- 16.British Standards Institute PSI. Vol. 136. 2007. [Google Scholar]
- 17.Ricketts K, Castoldi A, Guazzoni C, Ozkan C, Christodoulou C, Gibson AP, Royle GJ. Phys Med Biol. 2012;57:5543–5555. doi: 10.1088/0031-9155/57/17/5543. [DOI] [PubMed] [Google Scholar]
- 18.Thermo Fisher Quantx Technical Manual 4–3. Thermo Fisher Scientific; Madison, WI: 2008. [Google Scholar]