

Abstract
Sjögren’s syndrome (SS) is an autoimmune disease which results in pathological dryness of mouth and eye. The diagnosis of SS depends on both clinical evaluation and specific antibodies. The goal of this study was to use quantitative proteomics to investigate changes in tear proteins in a rabbit model of SS-associated dry eye, induced autoimmune dacryoadenitis (IAD). Proteomic analysis was performed by iTRAQ and nanoLC-MS/MS on tears collected from the ocular surface, and specific proteins were verified by high resolution multiple reaction monitoring (MRM). It was found that in the tears of IAD rabbits at 2 and 4 weeks after induction, S100 A6, S100 A9, and serum albumin were up-regulated, whereas serotransferrin (TF), prolactin-inducible protein (PIP), polymeric immunoglobulin receptor (pIgR), and Ig gamma chain C region were down-regulated. High resolution MRM with mTRAQ labeling verified the changes in S100 A6, TF, PIP, and pIgR. Our results indicated significant changes of tear proteins in IAD rabbits, suggesting these proteins could potentially be used as biomarkers for the diagnosis and prognosis of dry eye. Several of these proteins were also found in the tears of non-SS dry eye patients indicating a common basis of ocular surface pathology, however, pIgR appears to be unique to SS.
Keywords: Sjögren’s Syndrome, tear proteomics, dry eye, tear protein, iTRAQ quantitative proteomics, mTRAQ, high resolution MRM
1 Introduction
Dry eye syndrome afflicts millions of people worldwide, and is a leading cause of visits to eye care clinicians [1]. Dry eye is a diverse group of ocular surface diseases that can be subdivided based on different criteria. One of the most commonly used ways is to group patients as either Sjögren’s syndrome (SS) or non-SS based on the diagnosis with antibodies to this autoimmune disease.
SS is an autoimmune disease that causes functional impairment of the lacrimal gland (LG) and salivary glands, and is a common cause of severe dry eye. The hallmark of SS is massive lymphocyte infiltration in LG and salivary glands, and blood levels of autoantibodies, i.e., anti-nuclear antibody (ANA), and rheumatoid factor [2]. Typical ANA patterns in SS are SSA/Ro and SSB/La, of which SSB/La is more specific. However, although many theories have been proposed to explain the etiologies of secretory dysfunction in exocrine glands in SS, the exact mechanism is still unknown [3].
Although many systems have been proposed for the diagnosis of dry eye, the classical and most commonly used techniques in clinic are tear break-up time (BUT), Schirmer’s test, and Rose bengal staining. Despite their widespread use, these methods have often shown inconsistent results among evaluators, and sometimes, proved to be inaccurate [4]. Therefore, newer simple, accurate, reproducible, and economical diagnostic biomarkers are surely needed [5].
Changes of tear protein profiles in SS have been extensively investigated in humans. For example, decreased levels of lactoferrin, lysozyme and lipocalin-1 were found in patients with SS-associated dry eye [6, 7]. β2-microglobulin concentration in tears was found to be increased in patients with SS [8]. Pro-inflammatory cytokines, such as, IL-1a, IL-6, were also increased in the tears from patients with Sjögren’s syndrome [9, 10]. Goblet cell derived mucins, i.e., MUC5AC, was reduced in the tear fluid of patients with SS [11]. Elevation of selective water channel protein, aquaporin 5 in tears was reported in SS-associated dry eye as compared to non-SS dry eye and controls [12]. Reduced level of epidermal growth factor (EGF) was also observed in SS tears [12, 13]. Tomosugi et al compared tear protein profiles of primary, secondary SS and normal controls using SELDI-TOF ProteinChip and found significant difference between SS and controls [14].
Our previous report indicated that in non-SS dry eye patients, some proteins in the tear fluids demonstrated significant changes as compared to normal controls [5]. In particular, 6 proteins in the tears collected from ocular surface were up-regulated, α-enolase, α-1-acid glycoprotein 1, S100 A8 (calgranulin A), S100 A9 (calgranulin B), S100 A4, and S100 A11 (calgizzarin); while 4 proteins were down-regulated, prolactin-inducible protein (PIP), lipocalin-1, lactoferrin, and lysozyme [5]. These data suggest that altered proteins in the tear fluids could be used as biomarkers for the diagnosis of dry eye and prognosis of its management.
However, dry eye patients that were included into our previous study were not associated with SS. It is our hypothesis that there are also significant changes of protein profiles in the tear fluids in SS. To test this hypothesis, we employed an animal model of SS, rabbits with induced autoimmune dacryoadenitis (IAD) that have been documented to exhibit many of the characteristics of SS, including dry eye symptoms as well as LG pathologic features, and have been used extensively to study its pathophysiology [15–22].
Therefore, in this study, we set out to investigate the protein changes in tear fluids collected from the ocular surface from these animals, by using iTRAQ technology combined with nanoLC-nanoESI-MS/MS quantitative proteomics, which has been shown as a powerful tool for biomarker discovery [5, 23, 24]. The results were verified by targeted and high resolution MRM using TripleTOF 5600 combined with mTRAQ [25, 26]. mTRAQ is an extended version of iTRAQ and is based on the same chemical structure as iTRAQ. It’s a triplex non-isobaric amine labeling reagent (Δ0, Δ4 and Δ8) for relative or absolute quantification of targeted proteins using multiple reaction monitoring (MRM). The mTRAQ reagents Δ0, Δ4 and Δ8 have the same chemical structure but 4 Da differ from Δ0 to Δ4 and Δ4 to Δ8. Unique MRM transitions can be generated for parent peptide that is labeled with mTRAQ reagents (Δ0, Δ4 or Δ8). Quantification using MRM is the most accurate and specific technology for targeted protein quantification in complex sample matrix [27, 28]. With additional mTRAQ labeling, increased robustness of MRM assays among samples can be achieved as three samples (labeled with Δ0, Δ4 or Δ8) are combined and analyzed subsequently in one LC-MS/MS run [25, 26].
2 Materials and Methods
2.1 Animals
Twelve adult female New Zealand White rabbits weighing at around 4 kg (Irish Farms, Norco, CA) were used to create the IAD model. One rabbit died during the course of the study, and was subsequently excluded. Another 12 rabbits weighing ~4 kg were used as negative controls. Rabbits were narcotized with a mixture of ketamine (40 mg/ml) and xylazine (10 mg/ml) and given an overdose of Nembutal (80 mg/kg) for euthanasia. This study conformed to the standards and procedures for the proper care and use of animals as described in the US Public Health Service Policy on Humane Care and Use of Laboratory Animals as well as The Association for Research in Vision and Ophthalmology (ARVO) Statement for the Use of Animals in Ophthalmic and Vision Research.
2.2 Generation of IAD Model
2.2.1 Preparation of LG epithelial cells
After the rabbit was anesthetized, one LG was removed from the animal and cut into small pieces in Ham’s F-12 medium with supplements. The animal was kept in vivarium to wait for the injection of the mixed cell reaction, generated from one of its own LG, into the remaining LG. LG pieces were washed in Hanks’ medium, and incubated in s-Hanks for 15 minutes (37°C, shaking water bath). The pieces were washed in s-Ham’s medium twice, and incubated in s-Ham’s for 15 minutes (37°C, shaking water bath). The resulting cell suspension was centrifuged at 700 rpm for 5 minutes, re-suspended in s-Hanks’, incubated for 15 minutes Ham’s (37°C, shaking water bath) and centrifuged again. The cells were re-suspended and centrifuged in Ham’s twice, re-suspended in Ham’s and filtered through a 500 μm mesh and then a 25 μm mesh. The cell suspension was then centrifuged in a step gradient of 5 ml 2%, 5 ml 3% and 5 ml 4% Ficoll at 50× g for 15 minutes. The cells were collected from the 5% Ficoll fraction, transferred into PCM medium and washed twice by centrifugation, and then cultured at a density of 2–6×10⁶/mL at 37°C and 5% CO2.
2.2.2 Autologous mixed cell reaction with peripheral blood lymphocytes (PBL) and LG epithelial cells
PBL were separated from heparinized blood on Ficoll-Paque (Pharmacia, Piscataway, NJ). The cells were washed and re-suspended in growth medium. Serum-free, hormone-supplemented medium was used to culture the mixed cells to prevent lymphocyte proliferation when acinar cells and lymphocytes were co-cultured. After 2 days of mono-culturing the acinar cells in PCM and lymphocyte culture in s-DME, the cells were co-cultured in a 1:1 mixture (3×10⁶ of each) in PCM and s-DME with the lacrimal cells retaining secretory function, and the lymphocytes retaining proliferative potential. The time course of the proliferation (peak at 6 days of co-culture) was that typically seen for lymphocyte proliferation in conventional mixed lymphocyte reactions.
2.2.3 Direct inoculation of mixed cell reaction into LG and establishment of IAD model
Animals were narcotized and the remaining inferior LG was exposed surgically and injected directly, using a microinjection system, with 200 μl of buffer containing the mixed cell reaction with stimulated PBL that was generated from the same animal’s LG. Rabbits usually developed IAD fully within 2 weeks. For control group, the remaining LG were injected with mixed cell reaction consisting of purified LG epithelial cells and nonstimulated PBL from the same rabbit.
2.3 Confirmation of IAD
Routine diagnostic techniques used in testing humans for dry eye, i.e., tear break-up time (BUT), Schirmer’s test, and Rose bengal staining, were used to confirm the success of the model, and later by histological examination of LG sections from these animals [15, 16, 18]. A representative image of the LG, which illustrates the typical massive infiltration of lymphocytes, was presented (Figure 1).
Figure 1.
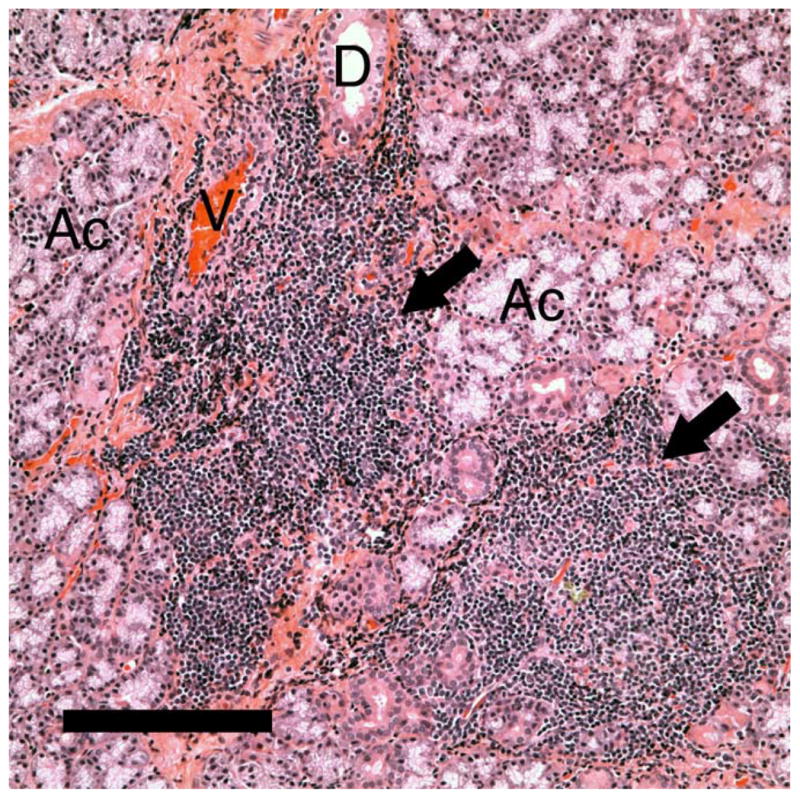
Representative image of the LG from rabbits with IAD, showing massive lymphocytes infiltration (arrows) that usually surrounds blood vessels. Ac: acini. D: duct. V: venule. Scale bar=50 μM.
2.4 Chemicals and reagents for proteomic analysis
Acetonitrile (ACN), formic acid, water were obtained from Merck (Darmstadt, Germany). Bio-Rad DC protein assay reagents and bovine serum albumin standard were purchased from Bio-Rad Laboratories (Hercules, CA). Trypsin and other reagents used for protein digestion were purchased from AB Sciex (Foster City, CA). UltraMicroSpin column was from The Nest Group (Southborough, MA). The reagents used for protein digestion were obtained from mTRAQ and iTRAQ reagents kits (AB Sciex, Framingham, MA, USA).
2.5 Tear fluid collection
Because the tear secretions from rabbits with IAD were greatly reduced, it was often difficult or impossible to collect tear fluids in the ocular surface. Therefore, 50 μL of buffered PBS was first put onto the ocular surface while the animal was alert, and the eyelid was manually blinked for several times, and the fluids on the ocular surface were collected by sterile pipette. Tear fluids were then stored in centrifuge tubes with protease inhibitors, and stored at −80°C until use.
2.6 Sample preparation
Total proteins concentration was determined using Bio-Rad DC protein assay. 25μg of each sample were transferred into new tubes and completely dried using SpeedVac. The samples were resolubilized in dissolution buffer (0.5M Triethylammoniumbicarbonate, TEAB), denatured by 0.1% sodium dodecyl sulphate (SDS), and reduced Tris-(2-carboxyethyl) phosphine (TCEP). After 1.5 hours of incubation at 60 °C, the protein cysteine residue was alkylated by the addition of methyl methanethiosulfonate (MMTS) at room temperature for 20 minutes. The resulting protein samples were then digested with trypsin at a ratio of 1:10 for 16 hours, with gentle shaking at 37 °C. Various samples were then labeled using iTRAQ 4-plex reagents according to manufacturer’s instructions. The experimental design was illustrated in Figure 2A. In total, 11 sets of iTRAQ experiments were performed (n = 11, there were 3 tear samples for each set, i.e. control, IAD at 2-week and IAD at 4-week).
Figure 2.

Experimental design for iTRAQ-based quantitative proteomics in the discovery step and MRM with mTRAQ in the verification step. The discovery and verification steps were performed on a single platform (TripleTOF 5600 system, AB SCIEX).
2.7 nanoLC-MS/MS Analysis
The samples were then subjected to nanoLC-MS/MS analysis. Reverse phase (RP) separation was employed using Dionex nanoLC coupled with AB Sciex 5600 triple TOF for the analysis. A 15 cm × 50 μm i.d. Chromolith capillary column was employed. This column was connected to a spray tip (New Objectives, Woburn, MA), which was directly coupled with the nano-spray interface into AB Sciex 5600 tripleTOF mass spectrometer. Samples were loaded onto a trap cartridge (Reprosil C18-AQ, 0.5 μm × 150 μm ID, from SGE Analytical Science) through Famos autosampler (Dionex, LC Packings) at a flow rate of 20 μL/min. After a 2 min wash with loading buffer (2/98 v/v of ACN/water with 0.1% formic acid), the system was switched (Switchos, Dionex, LC Packings) into line with the C18 analytical capillary column. A step linear gradient of mobile phase B (2/98 v/v of water/ACN with 0.1% formic acid) from 7% to 35% over 95-minute, 35%–55% for 44 minutes, 55%–70% for another 7 minutes and lastly, 70%–90% over 1 min at flow rate of 300 nL/min was utilized via Ultimate solvent delivery system (Dionex, LC Packings). Settings for TripleTOF MS were as follows: Ionspray Voltage Floating (ISVF) = 2200 V, curtain gas (CUR) = 30, Ion source gas 1 (GS1) = 12, Interface Heater Temperature (IHT) = 150, Declustering potential (DP) = 100 V, Nebuliser current (NC) = 3 for nitrogen gas. All data was acquired using information-dependent acquisition (IDA) mode with Analyst TF 1.5 software (AB Sciex). TOF-MS scan (experiment 1) parameters were set as follows: 0.25 sec TOF MS accumulation time in the mass range of 350–1250 Da followed by product ion scan (experiment 2) of 0.1 sec accumulation time in the mass range of 100–1,800 Da. Switching criteria were set to ions greater than m/z = 350 and smaller than m/z = 1250 with charge state of 2 to 5 and an abundance threshold of > 120 cps. Former target ions were excluded for 15s and former ions were excluded after 1 repeat. Maximum number of candidate ions per cycle was 20 spectra. IDA Advanced “rolling collision energy (CE)” and “Adjust CE when using iTRAQ Reagent” were required.
2.8 Data analysis
The data output from the MS/MS was processed and searched against the Uniprot_sprot protein database, under Oryctolagus cuniculus taxonomy, using ProteinPilot™ software 4.0 (AB Sciex). Paragon method was used for protein identification and iTRAQ quantification. The other searching parameters in Paragon method configuration were set as follows: Cys alkylation: MMTS; Digestion: trypsin; Instrument: TripleTOF 5600, Search Effort: Thorough ID. “Quantitate, “Bias Correction” and “Backgraound Correction” were selected. False Discovery Rate (FDR) analysis provided in the ProteinPilot was performed. All protein identification was based on the criteria of false discovery rate (FDR) < 1%.
2.9 Validation using mTRAQ in MRM mode
2.9.1 Sample preparation and mTRAQ labeling
For validation step using mTRAQ in MRM mode, 10 μg of total protein from tear samples of each group (control, IAD at 2-week and IAD at 4-week, Figure 2B) were used. Tear samples from four rabbits were used in this validation step (n = 4). The digestion procedure was the same as in section 2.6. The digested samples were reconstituted in dissolution buffer (0.5M Triethylammoniumbicarbonate (TEAB)). Isopropanol was added to the room-temperature mTRAQ reagents and the whole content of the mTRAQ reagent was transferred to the respective samples to be labeled (control, IAD at 2-week and IAD at 4-week were tagged with Δ0, Δ4 or Δ8 mTRAQ reagents respectively) and incubated at room temperature for 2 hours. The labeled samples were then pooled together and vacuum concentrated for further desalting procedure using UltraMicroSpin column (The Nest Group, Southborough, MA).
2.9.2 nanoLC-MS/MS in MRM mode
1D RP separation used in MRM experiment was performed using Ultimate 3000 nanoLC system (Dionex, Thermo Fisher Scientific, MA, USA) coupled with AB Sciex 5600 triple TOF 12 (AB Sciex, Framingham, MA, USA). A 25 cm × 75 μm i.d. packed with Acclaim PepMap RSLC C18 column was employed (Dionex, Thermo Fisher Scientific, MA, USA). This column was connected to a spray tip (New Objectives, Woburn, MA), which was directly coupled with the nano-spray interface into AB Sciex 5600 tripleTOF mass spectrometer. Samples were loaded onto a trap column (Acclaim PepMap 100 C18, 2cm × 75μm i.d., Dionex, Thermo Fisher Scientific, MA, USA) at a flow rate of 5 μL/min. After a 5 min wash with loading buffer (2/98 v/v of ACN/water with 0.1% formic acid), the system was switched into line with the C18 analytical capillary column. A step linear gradient of mobile phase B (2/98 v/v of water/ACN with 0.1% formic acid) from 5% to 30% over 69-minute, 30%–40% for 11 minutes, 40%–60% for another 7 minutes and lastly, 60%–95% over 1 min at flow rate of 300 nL/min was utilized for this analysis. The instrumentation settings were as follows: Ionspray Voltage Floating (ISVF) = 2400 V, curtain gas (CUR) = 30, Ion source gas 1 (GS1) = 12, Interface Heater Temperature (IHT) = 125, Declustering potential (DP) = 100 V, Nebuliser current (NC) = 3 for nitrogen gas. Data was acquired using TOF MS + Hi Sensitivity product ion with Analyst TF 1.5.1 software (AB Sciex, Framingham, MA, USA). TOF-MS scan (experiment 1) parameters were set as follows: 0.25 sec TOF MS accumulation time in the mass range of 350–1250 Da followed by product ion of targeted masses based on Table 1. The uniqueness of the chosen peptides for the targeted proteins was confirmed using NCBI BLAST, blastp suite under Oryctolagus cuniculus (rabbit).
Table 1.
MRM transitions used for quantification of four tear proteins (S100 A6, pIGR, PIP and TF). Control, IAD at 2-week and IAD at 4-week were labeled with Δ0, Δ4 or Δ8 mTRAQ reagents respectively. Different accumulation time (ms) and collision energy (CE) were used for different peptides.
| Name of Protein | Sequence | Targeted Mass (Δ0, Δ4, Δ8), m/z | Charge State, z | Transition | Accumulation Time, (ms) | CE (V) |
|---|---|---|---|---|---|---|
| S100 A6 | [M00]-ELTIGSK-[M00] | 514.3 | +2 | 287.2078 (y1) | 50 | 32 |
| 386.2762(y2) | ||||||
| 1055.6010(y8) | ||||||
| [M04]-ELTIGSK-[M04] | 518.3 | +2 | 291.2149 (y1) | 50 | 32 | |
| 390.2833 (y2) | ||||||
| 1059.6166 (y8) | ||||||
| [M08]-ELTIGSK-[M08] | 522.3 | +2 | 295.2211 (y1) | 50 | 32 | |
| 394.2904 (y2) | ||||||
| 1063.6237 (y8) | ||||||
| pIGR | [M00]-GFPGGSVTIR | 565.8 | +2 | 689.3941 (y7) | 50 | 35 |
| 786.4468 (y8) | ||||||
| 990.5367 (10) | ||||||
| [M04]-GFPGGSVTIR | 567.8 | +2 | 689.3941 (y7) | 50 | 35 | |
| 786.4468 (y8) | ||||||
| 990.5367 (10) | ||||||
| [M08]-GFPGGSVTIR | 569.8 | +2 | 689.3941 (y7) | 50 | 35 | |
| 786.4468 (y8) | ||||||
| 990.5367 (10) | ||||||
| PIP | [M00]-TATIAAVVDIIR | 691.9 | +2 | 401.2871 (y3) | 30 | 40 |
| 856.5251 (y8) | ||||||
| 1242.7416 (y12) | ||||||
| [M04]-TATIAAVVDIIR | 693.9 | +2 | 401.2871 (y3) | 30 | 40 | |
| 856.5251 (y8) | ||||||
| 1242.7416 (y12) | ||||||
| [M08]-TATIAAVVDIIR | 695.9 | +2 | 401.2871 (y3) | 30 | 40 | |
| 856.5251 (y8) | ||||||
| 1242.7416 (y12) | ||||||
| TF | [M00]-FDEFFR | 500.7 | +2 | 598.2984 (y4) | 30 | 32 |
| 713.3253 (y5) | ||||||
| 860.3937 (y6) | ||||||
| [M04]-FDEFFR | 502.8 | +2 | 598.2984 (y4) | 30 | 32 | |
| 713.3253 (y5) | ||||||
| 860.3937 (y6) | ||||||
| [M08]-FDEFFR | 504.8 | +2 | 598.2984 (y4) | 30 | 32 | |
| 713.3253 (y5) | ||||||
| 860.3937 (y6) |
3 Results
In total, 88 proteins were identified with high confidence (FDR < 1%). ProtScore (unused score) and number of peptides identified (with 95% confidence) and iTRAQ quantitative data for each protein were provided in supporting information. Among them, 3 proteins were up-regulated and 4 proteins were down-regulated in IAD rabbits at 2 and 4 weeks after induction of the disease (cut-off values of ratio were >1.40, or < 0.71, p < 0.05) as compared to controls (Table 2). Student t-tests revealed no significant differences between IAD rabbits at 2 and 4 weeks (p > 0.05).
Table 2.
iTRAQ-based quantitative comparisons of tear proteins between IAD (at 2 and 4 weeks) and control rabbits (ratio cutoff value: > 1.4 or < 0.71, p < 0.05). Paired t-test was performed to assess whether there is any significant changes between 2 weeks and 4 weeks (p < 0.05 indicates significant difference).
| Up-regulated | Average ratio (2 weeks/control, p-value) | Average ratio (4 weeks/control, p-value) | t-test, (p value) 2 weeks/4 weeks |
|---|---|---|---|
| S100 A6 | 3.03, 0.000 | 2.76, 0.000 | 0.072 |
| Serum albumin | 2.21, 0.035 | 1.53, 0.031 | 0.051 |
| S100 A9 | 1.76, 0.004 | 2.06, 0.001 | 0.234 |
| Down-regulated | |||
| Serotransferrin | 0.21, 0.000 | 0.29, 0.000 | 0.296 |
| PIP | 0.25, 0.000 | 0.20, 0.000 | 0.175 |
| PIGR | 0.40, 0.008 | 0.69, 0.039 | 0.725 |
| Ig gamma chain C region | 0.51, 0.001 | 0.68, 0.042 | 0.177 |
Figure 3 shows representative MS/MS spectra for the identification and relative quantification of one up-regulated protein (S100 A6) and two down-regulated proteins (serotransferrin and PIP). Figure 3A is the MS/MS spectrum of one doubly charged peptide ion (ELTIGSK, m/z = 518.3181) originated from S100 A6 protein. Zoom-in spectrum (at m/z =114–118 Da, Figure 3B) gives the relative quantification by report ions (115: pooled controls; 116: at 2 weeks; 117: at 4 weeks). Similarly, Figures 3C and 3E show the MS/MS spectra of one triply charged peptide ion (SAGWNIPIGLLYCDLPEPR, m/z = 768.7256) originated from serotransferrin and one doubly charged peptide ion (ECMVIK, m/z = 528.7772) originated from PIP. The zoom-in spectra showing the relative quantification information are seen in Figures 3D and 3F, respectively.
Figure 3.


Representative MS/MS spectra show protein identification and relative quantitation using iTRAQ. Zoom-in region from spectra A, C and E indicate the signal intensity of three report ions at m/z = 115.1, 116.1 and 117.1 Da, which are corresponding to control, IAD rabbit at 2 weeks and at 4 weeks. The values on the top of the peaks indicate the ratio of IAD rabbit at 2 weeks or 4 weeks versus control. (A) MS/MS spectrum of a peptide fragment originated from S100 A6 (ELTIGSK); (B) Zoom-in region from spectrum A; (C) MS/MS spectrum of a peptide fragment originated from TF (SAGWNIPIGLLYCDLPEPR). (D) Zoom-in region from spectrum C; (E) MS/MS spectrum of a peptide fragment originated from PIP (VIQMDLQMPTVAVANEEVTVK). (F) Zoom-in region from spectrum E.
In the verification step, four tear proteins, S100 A6, TF, PIP and pIGR, were selected for relative quantification by MRM using mTRAQ. For quantification, the top three most intense fragment ions were extracted from the full scan high resolution MS/MS of targeted peptides to generate fragment ion XICs. Figures 4A–4C showed such representative MRM-like fragment ion XICs for S100 A6 peptide ELTIGSK (labeled with Δ0 for controls, Δ4 for IAD at 2 and Δ8 for IAD at 4 weeks), TF peptide FDEFFR (same labeling as the above) and PIP peptide TATIAAVVDIIR (same labeling as the above). MRM results showed same trend as the iTRAQ results found in the discovery step. Both methods indicated that S100 A6 increased significantly in IAD rabbits at 2 and 4 weeks, whereas TF, PIP and pIGR decreased significantly in IAD rabbits at 2 and 4 weeks, as compared to controls. The box-plots of these four tear proteins (S100 A6, TF, PIP and pIGR) from both iTRAQ (n = 11) and MRM (n = 4) were shown in Figure 5.
Figure 4.


Representative MRM-like fragment ion XICs for three tear proteins (A) S100 A6 peptide ELTIGSK (pink trace: labeled with mTRAQ Δ0 for controls; brown trace: labeled with mTRAQ Δ4 for IAD at 2 weeks; blue trace: labeled with mTRAQ Δ8 for IAD at 4 weeks); (B) TF peptide FDEFFR (labeling is the same as in A); and (C) PIP peptide TATIAAVVDIIR (labeling is the same as in A).
Figure 5.


Boxplot with outliers of up-and down-regulated proteins (ratio: IAD at 2 weeks vs controls, labeled as 2W; IAD at 4 weeks vs controls, labeled as 4W) using both iTRAQ (left) and MRM (right). (A) S100 A6; (B) TF; (C) PIP; (D) PIGR. The bottom and top of the box is the 25th and 75th percentile, the solid and dashed bands near the middle of the box are the 50th percentile and geometric mean. The ends of the whiskers are the lowest datum still within 1.5 IQR of the lower quartile, and the highest datum still within 1.5IQR of the upper quartile. Small circles are outliers. Red line is a horizontal line at ratio=1.
(IQR: interquartile range. IQR equals to the difference between the upper and lower quartiles. IQR=Q3-Q1.)
4 Discussion
The aim of this study was to investigate the potential changes of tear protein profiles in rabbit with IAD, an animal model of Sjögren’s syndrome-associated dry eye, using iTRAQ based quantitative proteomics. iTRAQ based quantitative proteomics technology has been shown to be a powerful tool in searching for potential biomarkers in tears from patients with dry eye [5, 23], monitoring changes of tear protein profiles related to the long-term use of anti-glaucoma medication [24], measuring N-glycosylation level of tear proteins [29], validation of changes of defensin levels in rabbit tears in response to corneal wounding [30], and comparing quantitative changes of tear protein levels prior to and after acupuncture treatment in a rabbit model [31].
In this study, tears were collected using “eye wash” technique, in which a fixed volume of buffered PBS (50 μl in this study) was instilled onto the ocular surface, and the eyelid was manually blinked for several times, and finally the fluids on the ocular surface were collected by pipette. This tear collection method is particularly useful in the case of dry eye, where tear volume is reduced. A recent study by Markoulli et al demonstrated that the tear protein profiles were reproducible when using this collection method [32], and tear protein profiles were similar from samples collected by microcapillary tube and “eye wash” methods [32].
iTRAQ results revealed that four tear proteins (TF, PIP, pIGR and Ig gamma chain C region) were significantly down-regulated in IAD rabbits at both 2 and 4 weeks (ratio cutoff value: < 0.71, p < 0.05, Table 2). For TF, PIP and pIGR, MRM experiments were also performed to verify the iTRAQ results. MRM assays were performed using TripleTOF mass spectrometer (AB SCIEX) in high resolution MRM mode. In this MRM-like workflow, the MRM transitions were not pre-defined. Instead, the mass of the precursor was provided and high-resolution MS/MS spectra were acquired with looped full scan MS/MS. High resolution XICs (extracted ion chromatogram) were generated post-acquisition. Multiple MRM transition pairs could be easily selected and full scan MS/MS confirmed the identity of the peptide. There were minimum efforts involved in the method development. The sensitivity of this MRM-like mode is inherently lower than that of the true MRM mode. But the high selectivity of high resolution MS/MS may well compensate the sensitivity issue especially in samples with complex matrix [33]. Overall, two recent studies [33, 34] demonstrated that targeted peptide quantification using high resolution and accurate mass mode (where they were called parallel reaction monitoring, PRM) in a quadrupole-orbitrap instrument exhibits similar or better performances in terms of selectivity, sensitivity and dynamic range when compared to conventional triple quadrupole mass spectrometer in true MRM mode. In this report, a high resolution TOF analyzer (TripleTOF 5600 system) rather than orbitrap was used. In this study, control group was tagged with mTRAQ Δ0 and IAD at 2 and 4 weeks were tagged with mTRAQ Δ4 and Δ8, respectively. After labeling, one control sample (tagged with Δ0), one IAD at 2-week sample (tagged with Δ4) and one IAD at 4-week sample (tagged with Δ8) were combined and analyzed using 1D nanoLC-MS/MS on the TripleTOF 5600 using high resolution MRM mode. Thus, the peptides originating from three study groups tagged with three versions of mTRAQ reagents (Δ0, Δ4 and Δ8) can be analyzed in the same analysis but distinct from each other.
One of the most abundant tear proteins (Table 2) in rabbit is serotransferrin (also known as transferrin, equivalent to lactoferrin in human tears). It seems that serotransferrin is highly expressed in rabbit tears whereas human tears contain mainly lactoferrin [35]. The down-regulation of tear lactoferrin is well known in patients with dry eye [5, 36] and Sjögren’s syndrome [6, 37]. PIP is another high abundant tear protein and mainly secreted from lacrimal gland. Previous studies showed that changes of PIP level in tears were associated with dry eye [5, 38], blepharitis [39], keratoconus [40] and mycotic keratitis [41].
pIGR is an epithelial glycoprotein, which interacts with secretory IgA (sIgA). pIGR is critical for regulating the levels of sIgA by transporting locally produced IgA [42]. sIgA plays an important role in protecting mucosal surfaces, such as ocular surface, against pathogens and antigens [42].
Three proteins, S100 A6, S100 A9, and serum albumin were up-regulated in IAD rabbits at both 2 and 4 weeks (ratio cutoff value: > 1.40, p-value < 0.05, Table 2). For S100 A6, MRM experiment was also performed to verify the iTRAQ results.
S100 A6, also known as calcyclin, is a member of calcium-binding protein family [43]. It is highly expressed in epithelial cells and associated with cell proliferation and differentiation [44]. It has been shown that the increased expression of S100 A6 was correlated with corneal wounding [45]. In our study, the elevation of S100 A6 level in tears may suggest the damage of the ocular surface in IAD rabbits. S100 A9 is an inflammation-associated protein [46] and is mainly expressed in granulocytes and epithelial cells [47]. Previous studies have shown that its level was elevated in tears from patients with dry eye [5], pterygium [48] and after long-term use of anti-glaucoma medication [24]. The up-regulation of serum albumin in tears from IAD rabbits may be due to the leakage of blood-origin proteins on the damaged ocular surface.
Several previously identified potential tear protein biomarkers of dry eye disease were also altered in tears from IAD rabbits, including S100 A9, PIP and TF (lactoferrin, LTF in human tears). The comparison of these three proteins in dry eye from human (data for dry eye in humans were from reference [5]) and IAD rabbits showed that the ratios of disease versus control for TF and PIP are much lower in IAD rabbits than in human dry eye, whereas the ratios of disease versus control for S100 A9 are much higher in IAD rabbits than in human dry eye. However, pIgR appears to be unique to SS-associated dry eye [5].
We recognize that there are many other animal models that have been used for SS-associated dry eye studies, especially murine strains with genetic mutations [49–51]. While studies using these models provide valuable information regarding the etiology of SS, the rabbit IAD model has also been demonstrated to be an excellent model and has been used extensively [15–22, 52]. We believe studies using this rabbit model, one without genetic defect in contrast to the murine models, to study the protein profile changes obtained from these animals will help us to identify potential biomarkers for SS-associated dry eye.
In summary, our findings showed that the protein expressions of nine proteins (3 up-regulated and 4 down-regulated) are altered in the tear fluids collected from rabbits with IAD, an animal model of SS, results consistent with our previous reports in dry eye patients not associated with SS, suggesting these proteins could potentially be used as biomarkers for the diagnosis and prognosis of dry eye, regardless of whether it is related to SS.
Supplementary Material
Acknowledgments
This work was supported by NIH grants EY017731 (CD), EY012689 (Melvin Trousdale), EY03040 (Doheny Eye Institute Core) and NMRC CG 2010, the National Medical Research Council, Singapore. We thank the SingHealth Foundation for their grant in supporting the core 18 proteomics facility at Singapore Eye Research Institute, Singapore. The authors also thank Melvin Trousdale, Padmaja Thomas, Michael Lu, Ernesto Barron and Tian Dechao for expert advice and excellent technical support.
Abbreviations
- IAD
induced autoimmune dacryoadenitis
- LG
lacrimal gland
- SS
Sjögren’s syndrome
- iTRAQ
isobaric tags for relative and absolute quantitation
- mTRAQ
MRM tags for relative and absolute quantitation
- MRM
multiple reaction monitoring
- XIC
extracted ion chromatogram
Footnotes
Declaration of Interest: The authors report no conflicts of interest. The authors alone are responsible for the content and writing of the paper.
References
- 1.Pflugfelder SC, Tseng SC, Sanabria O, Kell H, et al. Evaluation of subjective assessments and objective diagnostic tests for diagnosing tear-film disorders known to cause ocular irritation. Cornea. 1998;17:38–56. doi: 10.1097/00003226-199801000-00007. [DOI] [PubMed] [Google Scholar]
- 2.Tsubota K, Fujita H, Tsuzaka K, Takeuchi T. Mikulicz’s disease and Sjogren’s syndrome. Invest Ophthalmol Vis Sci. 2000;41:1666–1673. [PubMed] [Google Scholar]
- 3.Zoukhri D. Effect of inflammation on lacrimal gland function. Exp Eye Res. 2006;82:885–898. doi: 10.1016/j.exer.2005.10.018. [DOI] [PMC free article] [PubMed] [Google Scholar]
- 4.Lemp MA. Report of the National Eye Institute/Industry workshop on Clinical Trials in Dry Eyes. CLAO J. 1995;21:221–232. [PubMed] [Google Scholar]
- 5.Zhou L, Beuerman RW, Chan CM, Zhao SZ, et al. Identification of tear fluid biomarkers in dry eye syndrome using iTRAQ quantitative proteomics. J Proteome Res. 2009;8:4889–4905. doi: 10.1021/pr900686s. [DOI] [PubMed] [Google Scholar]
- 6.Janssen PT, van Bijsterveld OP. Tear fluid proteins in Sjogren’s syndrome. Scand J Rheumatol Suppl. 1986;61:224–227. [PubMed] [Google Scholar]
- 7.Mackor AJ, van Bijsterveld OP. Tear function parameters in keratoconjunctivitis sicca with and without the association of Sjogren’s syndrome. Ophthalmologica. 1988;196:169–174. doi: 10.1159/000309895. [DOI] [PubMed] [Google Scholar]
- 8.Markusse HM, Huysen JC, Nieuwenhuys EJ, Swaak AJ. Beta 2 microglobulin in tear fluid from patients with primary Sjogren’s syndrome. Ann Rheum Dis. 1992;51:503–505. doi: 10.1136/ard.51.4.503. [DOI] [PMC free article] [PubMed] [Google Scholar]
- 9.Solomon A, Dursun D, Liu Z, Xie Y, et al. Pro- and anti-inflammatory forms of interleukin-1 in the tear fluid and conjunctiva of patients with dry-eye disease. Invest Ophthalmol Vis Sci. 2001;42:2283–2292. [PubMed] [Google Scholar]
- 10.Tishler M, Yaron I, Geyer O, Shirazi I, et al. Elevated tear interleukin-6 levels in patients with Sjogren syndrome. Ophthalmology. 1998;105:2327–2329. doi: 10.1016/S0161-6420(98)91236-2. [DOI] [PubMed] [Google Scholar]
- 11.Argueso P, Balaram M, Spurr-Michaud S, Keutmann HT, et al. Decreased levels of the goblet cell mucin MUC5AC in tears of patients with Sjogren syndrome. Invest Ophthalmol Vis Sci. 2002;43:1004–1011. [PubMed] [Google Scholar]
- 12.Ohashi Y, Ishida R, Kojima T, Goto E, et al. Abnormal protein profiles in tears with dry eye syndrome. Am J Ophthalmol. 2003;136:291–299. doi: 10.1016/s0002-9394(03)00203-4. [DOI] [PubMed] [Google Scholar]
- 13.Pflugfelder SC, Jones D, Ji Z, Afonso A, Monroy D. Altered cytokine balance in the tear fluid and conjunctiva of patients with Sjogren’s syndrome keratoconjunctivitis sicca. Curr Eye Res. 1999;19:201–211. doi: 10.1076/ceyr.19.3.201.5309. [DOI] [PubMed] [Google Scholar]
- 14.Tomosugi N, Kitagawa K, Takahashi N, Sugai S, Ishikawa I. Diagnostic potential of tear proteomic patterns in Sjogren’s syndrome. J Proteome Res. 2005;4:820–825. doi: 10.1021/pr0497576. [DOI] [PubMed] [Google Scholar]
- 15.Guo Z, Song D, Azzarolo AM, Schechter JE, et al. Autologous lacrimal-lymphoid mixed-cell reactions induce dacryoadenitis in rabbits. Exp Eye Res. 2000;71:23–31. doi: 10.1006/exer.2000.0855. [DOI] [PubMed] [Google Scholar]
- 16.Guo Z, Azzarolo AM, Schechter JE, Warren DW, et al. Lacrimal gland epithelial cells stimulate proliferation in autologous lymphocyte preparations. Exp Eye Res. 2000;71:11–22. doi: 10.1006/exer.2000.0856. [DOI] [PubMed] [Google Scholar]
- 17.Zhu Z, Stevenson D, Ritter T, Schechter JE, et al. Expression of IL-10 and TNF-inhibitor genes in lacrimal gland epithelial cells suppresses their ability to activate lymphocytes. Cornea. 2002;21:210–214. doi: 10.1097/00003226-200203000-00018. [DOI] [PubMed] [Google Scholar]
- 18.Zhu Z, Stevenson D, Schechter JE, Mircheff AK, et al. Lacrimal histopathology and ocular surface disease in a rabbit model of autoimmune dacryoadenitis. Cornea. 2003;22:25–32. doi: 10.1097/00003226-200301000-00007. [DOI] [PubMed] [Google Scholar]
- 19.Zhu Z, Stevenson D, Schechter JE, Mircheff AK, et al. Prophylactic effect of IL-10 gene transfer on induced autoimmune dacryoadenitis. Invest Ophthalmol Vis Sci. 2004;45:1375–1381. doi: 10.1167/iovs.03-0755. [DOI] [PubMed] [Google Scholar]
- 20.Thomas PB, Zhu Z, Selvam S, Samant DM, et al. Autoimmune dacryoadenitis and keratoconjunctivitis induced in rabbits by subcutaneous injection of autologous lymphocytes activated ex vivo against lacrimal antigens. J Autoimmun. 2008;31:116–122. doi: 10.1016/j.jaut.2008.04.019. [DOI] [PMC free article] [PubMed] [Google Scholar]
- 21.Ding C, Nandoskar P, Lu M, Thomas P, et al. Changes of aquaporins in the lacrimal glands of a rabbit model of Sjogren’s syndrome. Curr Eye Res. 2011;36:571–578. doi: 10.3109/02713683.2011.574330. [DOI] [PMC free article] [PubMed] [Google Scholar]
- 22.Nandoskar P, Wang Y, Wei R, Liu Y, et al. Changes of chloride channels in the lacrimal glands of a rabbit model of Sjogren syndrome. Cornea. 2012;31:273–279. doi: 10.1097/ICO.0b013e3182254b42. [DOI] [PMC free article] [PubMed] [Google Scholar]
- 23.Tong L, Zhou L, Beuerman RW, Zhao SZ, Li XR. Association of tear proteins with Meibomian gland disease and dry eye symptoms. Br J Ophthalmol. 2011;95:848–852. doi: 10.1136/bjo.2010.185256. [DOI] [PubMed] [Google Scholar]
- 24.Wong TT, Zhou L, Li J, Tong L, et al. Proteomic profiling of inflammatory signaling molecules in the tears of patients on chronic glaucoma medication. Invest Ophthalmol Vis Sci. 2011 doi: 10.1167/iovs.10-6532. [DOI] [PubMed] [Google Scholar]
- 25.DeSouza LV, Taylor AM, Li W, Minkoff MS, et al. Multiple reaction monitoring of mTRAQ-labeled peptides enables absolute quantification of endogenous levels of a potential cancer marker in cancerous and normal endometrial tissues. J Proteome Res. 2008;7:3525–3534. doi: 10.1021/pr800312m. [DOI] [PubMed] [Google Scholar]
- 26.DeSouza LV, Romaschin AD, Colgan TJ, Siu KW. Absolute quantification of potential cancer markers in clinical tissue homogenates using multiple reaction monitoring on a hybrid triple quadrupole/linear ion trap tandem mass spectrometer. Anal Chem. 2009;81:3462–3470. doi: 10.1021/ac802726a. [DOI] [PubMed] [Google Scholar]
- 27.Anderson L, Hunter CL. Quantitative mass spectrometric multiple reaction monitoring assays for major plasma proteins. Mol Cell Proteomics. 2006;5:573–588. doi: 10.1074/mcp.M500331-MCP200. [DOI] [PubMed] [Google Scholar]
- 28.Kuzyk MA, Smith D, Yang J, Cross TJ, et al. Multiple reaction monitoring-based, multiplexed, absolute quantitation of 45 proteins in human plasma. Mol Cell Proteomics. 2009;8:1860–1877. doi: 10.1074/mcp.M800540-MCP200. [DOI] [PMC free article] [PubMed] [Google Scholar]
- 29.Zhou L, Beuerman RW, Chew AP, Koh SK, et al. Quantitative analysis of N-linked glycoproteins in tear fluid of climatic droplet keratopathy by glycopeptide capture and iTRAQ. J Proteome Res. 2009;8:1992–2003. doi: 10.1021/pr800962q. [DOI] [PubMed] [Google Scholar]
- 30.Zhou L, Beuerman RW, Huang L, Barathi A, et al. Proteomic analysis of rabbit tear fluid: Defensin levels after an experimental corneal wound are correlated to wound closure. Proteomics. 2007;7:3194–3206. doi: 10.1002/pmic.200700137. [DOI] [PubMed] [Google Scholar]
- 31.Qiu X, Gong L, Sun X, Guo J, Chodara AM. Efficacy of Acupuncture and Identification of Tear Protein Expression Changes Using iTRAQ Quantitative Proteomics in Rabbits. Curr Eye Res. 2011;36:886–894. doi: 10.3109/02713683.2011.601843. [DOI] [PubMed] [Google Scholar]
- 32.Markoulli M, Papas E, Petznick A, Holden B. Validation of the flush method as an alternative to basal or reflex tear collection. Curr Eye Res. 2011;36:198–207. doi: 10.3109/02713683.2010.542867. [DOI] [PubMed] [Google Scholar]
- 33.Peterson AC, Russell JD, Bailey DJ, Westphall MS, Coon JJ. Parallel reaction monitoring for high resolution and high mass accuracy quantitative, targeted proteomics. Mol Cell Proteomics. 2012;11:1475–1488. doi: 10.1074/mcp.O112.020131. [DOI] [PMC free article] [PubMed] [Google Scholar]
- 34.Gallien S, Duriez E, Crone C, Kellmann M, et al. Targeted proteomic quantification on quadrupole-orbitrap mass spectrometer. Mol Cell Proteomics. 2012;11:1709–1723. doi: 10.1074/mcp.O112.019802. [DOI] [PMC free article] [PubMed] [Google Scholar]
- 35.Boonstra A, Kijlstra A. The identification of transferrin, an iron-binding protein in rabbit tears. Exp Eye Res. 1984;38:561–567. doi: 10.1016/0014-4835(84)90174-x. [DOI] [PubMed] [Google Scholar]
- 36.Boersma HG, van Bijsterveld OP. The lactoferrin test for the diagnosis of keratoconjunctivitis sicca in clinical practice. Ann Ophthalmol. 1987;19:152–154. [PubMed] [Google Scholar]
- 37.Da Dalt S, Moncada A, Priori R, Valesini G, Pivetti-Pezzi P. The lactoferrin tear test in the diagnosis of Sjogren’s syndrome. Eur J Ophthalmol. 1996;6:284–286. doi: 10.1177/112067219600600311. [DOI] [PubMed] [Google Scholar]
- 38.Nichols JJ, Green-Church KB. Mass spectrometry-based proteomic analyses in contact lens-related dry eye. Cornea. 2009;28:1109–1117. doi: 10.1097/ICO.0b013e3181a2ad81. [DOI] [PubMed] [Google Scholar]
- 39.Koo BS, Lee DY, Ha HS, Kim JC, Kim CW. Comparative analysis of the tear protein expression in blepharitis patients using two-dimensional electrophoresis. J Proteome Res. 2005;4:719–724. doi: 10.1021/pr0498133. [DOI] [PubMed] [Google Scholar]
- 40.Pannebaker C, Chandler HL, Nichols JJ. Tear proteomics in keratoconus. Mol Vis. 2010;16:1949–1957. [PMC free article] [PubMed] [Google Scholar]
- 41.Ananthi S, Chitra T, Bini R, Prajna NV, et al. Comparative analysis of the tear protein profile in mycotic keratitis patients. Mol Vis. 2008;14:500–507. [PMC free article] [PubMed] [Google Scholar]
- 42.Johansen FE, Kaetzel CS. Regulation of the polymeric immunoglobulin receptor and IgA transport: new advances in environmental factors that stimulate pIgR expression and its role in mucosal immunity. Mucosal Immunol. 2011;4:598–602. doi: 10.1038/mi.2011.37. [DOI] [PMC free article] [PubMed] [Google Scholar]
- 43.Zimmer DB, Cornwall EH, Landar A, Song W. The S100 protein family: history, function, and expression. Brain Res Bull. 1995;37:417–429. doi: 10.1016/0361-9230(95)00040-2. [DOI] [PubMed] [Google Scholar]
- 44.Kuznicki J, Kordowska J, Puzianowska M, Wozniewicz BM. Calcyclin as a marker of human epithelial cells and fibroblasts. Exp Cell Res. 1992;200:425–430. doi: 10.1016/0014-4827(92)90191-a. [DOI] [PubMed] [Google Scholar]
- 45.Bazan HE, Allan G, Bazan NG. Enhanced expression of the growth-regulated calcyclin gene during corneal wound healing. Exp Eye Res. 1992;55:173–177. doi: 10.1016/0014-4835(92)90105-2. [DOI] [PubMed] [Google Scholar]
- 46.Roth J, Vogl T, Sorg C, Sunderkotter C. Phagocyte-specific S100 proteins: a novel group of proinflammatory molecules. Trends Immunol. 2003;24:155–158. doi: 10.1016/s1471-4906(03)00062-0. [DOI] [PubMed] [Google Scholar]
- 47.Li J, Riau AK, Setiawan M, Mehta JS, et al. S100A expression in normal corneal-limbal epithelial cells and ocular surface squamous cell carcinoma tissue. Mol Vis. 2011;17:2263–2271. [PMC free article] [PubMed] [Google Scholar]
- 48.Zhou L, Beuerman RW, Ang LP, Chan CM, et al. Elevation of human alpha-defensins and S100 calcium-binding proteins A8 and A9 in tear fluid of patients with pterygium. Invest Ophthalmol Vis Sci. 2009;50:2077–2086. doi: 10.1167/iovs.08-2604. [DOI] [PubMed] [Google Scholar]
- 49.Zoukhri D, Hodges RR, Dartt DA. Lacrimal gland innervation is not altered with the onset and progression of disease in a murine model of Sjogren’s syndrome. Clin Immunol Immunopathol. 1998;89:126–133. doi: 10.1006/clin.1998.4597. [DOI] [PubMed] [Google Scholar]
- 50.Walcott B, Matthews G, Brink P. Differences in stimulus induced calcium increases in lacrimal gland acinar cells from normal and NZB/NZW F1 female mice. Curr Eye Res. 2002;25:253–260. doi: 10.1076/ceyr.25.4.253.13489. [DOI] [PubMed] [Google Scholar]
- 51.Ding C, MacVeigh M, Pidgeon M, da Costa SR, et al. Unique ultrastructure of exorbital lacrimal glands in male NOD and BALB/c mice. Curr Eye Res. 2006;31:13–22. doi: 10.1080/02713680500428613. [DOI] [PubMed] [Google Scholar]
- 52.Konttinen YT, Tensing EK, Laine M, Porola P, et al. Abnormal distribution of aquaporin-5 in salivary glands in the NOD mouse model for Sjogren’s syndrome. J Rheumatol. 2005;32:1071–1075. [PubMed] [Google Scholar]
Associated Data
This section collects any data citations, data availability statements, or supplementary materials included in this article.