Abstract
Purpose
To elucidate the mechanism of rutin in blocking macrophage-mediated inflammation and high fat diet-induced obesity and fatty liver.
Methods
Both in vitro and in vivo approaches were taken in evaluating the effects of rutin on palmitic acids-triggered inflammation in cultured macrophages, and on weight gain and development of fatty liver of mice fed a high fat diet.
Results
Palmitic acids increase mRNA levels of pro-inflammatory cytokines, and elevate the production of TNFα in cultured macrophages. Pre-exposure of rutin to cells greatly suppressed these elevations. The suppressed inflammation by rutin was correlated with a decrease in transcription of genes responsible for ER stress and production of reactive oxygen species. In vivo, rutin protects mice from high fat diet-induced obesity, fatty liver and insulin resistance. The protective effects were associated with lack of hypertrophy and crown-like structures in the white adipose tissue, decreased mRNA levels of marker genes for macrophages including F4/80, Cd11c and Cd68, and repressed transcription of genes involved in chronic inflammation such as Mcp1 and Tnfα in white adipose tissue. In addition, rutin increases the expression of genes responsible for energy expenditure in brown adipose tissue including Pgc1α and Dio2. Furthermore, rutin suppresses transcription of Srebp1c and Cd36 in the liver, leading to a blockade of fatty liver development.
Conclusion
These results suggest that supplementation of rutin is a promising strategy for blocking macrophage-mediated inflammation and inflammation-induced obesity and its associated complications.
Keywords: rutin, anti-oxydant, chronic inflammation, high fat diet, obesity, fatty liver, insulin resistance
Introduction
Along with changes in life style and diet structure, the prevalence of obesity is increasing globally. Many strategies have been attempted to control obesity and to prevent complications associated with it, including fatty liver, insulin resistance and cardiovascular diseases. Among strategies, supplementation of natural anti-oxidants is a promising one. For example, rutin, a potent natural anti-oxidant, has been demonstrated being capable of producing beneficial effects on several metabolic disorders (1–4). It has been reported that rutin suppresses high fat diet (HFD)-induced dyslipidemia in rats (1). Panchal et al. showed that rutin protects rats from the metabolic changes and cardiovascular remodeling caused by a high-fat and high-carbohydrate diet (2). Additionally, Hao et al. and Kamalakkannan et al. demonstrated that rutin improves the metabolic status of diabetic rats (3, 4). Similarly, chronic inflammation has been indicated a critical role in development of metabolic disorders (5, 6). For example, Henao-Mejia et al. reported that chronic inflammation is essential for progression of obesity and non-alcoholic fatty liver (5). A more recent study by Stienstra et al. identified a crucial function of inflammasome in pathogenesis of obesity and insulin resistance (6). Importantly, Hu et al. demonstrated that rutin ameliorates inflammasome activation, leading to suppressed inflammation in the kidney of rats (7). Similarly, Javed et al. reported the activity of rutin in preventing cognitive impairments in rats (8). Results from these studies prompt us to hypothesize that the beneficial effect of rutin in obesity is achieved through suppression of chronic inflammation.
Employing both in vitro and in vivo systems, we demonstrate in this study that rutin suppresses palmitic acid-triggered inflammation in macrophages, and twice weekly injections of rutin protect mice from development of HFD-induced obesity, fatty liver and insulin resistance. These beneficial effects are correlated with blockade of macrophage infiltration and chronic inflammation in adipose tissue. Our results offer new and critical information regarding the beneficial effects of rutin in the management of metabolic disorders.
Methods
Animals and treatments
The animal protocol was approved by the Institutional Animal Care and Use Committee of the University of Georgia (Protocol Number, A2011 07-Y2-A3). Male C57BL/6 mice purchased from Charles River (Wilmington, MA) were housed under standard conditions with a 12 h light-dark cycle. Mice were divided into 3 groups (n = 5), and animals in group one were intraperitoneally (i.p.) injected twice weekly with rutin (50 mg/kg) solubilized in DMSO and fed a HFD (60% calories from fat, 20% from carbohydrates, and 20% from proteins). Mice in group two and three were injected (i.p.) with carrier solution fed a HFD or regular chow (20% calories from fat, 60% from carbohydrates, and 20% from proteins), respectively. Body weight and food-intake were measured weekly. Body composition analysis using EchoMRI-100 (Echo Medical Systems, Houston, TX) was conducted at the end of treatment.
Cell culture
Murine macrophage cell line (RAW 264.7, TIB-71 at ATCC) was cultured at 37 °C in a 5% CO2-humidified incubator and grown in Dulbecco's minimum essential medium (DMEM) supplemented with 10% fetal bovine serum, penicillin (100 U/ml) and streptomycin (100 μg/ml). Cell viability was measured by MTT assay. For TNFα determination in supernatants, cells were pre-treated with various concentrations of rutin for 4 h and further incubated with 400 μM palmitic acids with or without rutin for 12 h. Supernatants were collected and TNFα levels were determined using an enzyme-linked immunosorbent assay (ELISA) kit (#88-7324-88) purchased from eBioscience (San Diego, CA). In the gene expression analysis, cells were pre-treated with or without 200 μM rutin for 4 h and further incubated for 12 h with 400 μM palmitic acids with or without the presence of rutin (200 μM).
Measurement of reactive oxygen species (ROS)
ROS was determined using the Total ROS Detection Kit (ENZ-51011) from Enzo Life Sciences (Farmingdale, NY). Cells were pre-treated with or without 200 μM rutin for 4 h and further incubated with 400 μM palmitic acids with or without 200 μM rutin for 24 h. Cells were washed with phosphate buffered saline (pH=7.2) and incubated with the detection reagent from the kit for 30 min at 37 °C. Cells were examined under a fluorescent microscope (ECLIPSE Ti, Nikon) and fluorescent intensity from at least 5 randomly selected fields was measured and normalized to cell numbers using the NIS-Elements imaging platform from Nikon Instruments Inc. (Melville, NY).
Intra-peritoneal glucose tolerance test (IPGTT) and insulin tolerance test (ITT)
Mice were fasted for 6 h before IPGTT. Glucose solubilized in phosphate buffered saline was injected (i.p.) at 1.5 g/kg, and the time-point was set as 0 min. Blood glucose levels at 0, 30, 60 and 120 min were measured using glucose test strips and glucose meters. For ITT, mice were fasted for 4 h before the injection of insulin (Humulin, 0.75 U/kg) from Eli Lilly (Indianapolis, IN), and blood glucose levels were measured at 0, 30, 60 and 120 min after insulin injection.
Gene expression analysis
Total mRNA from the liver was isolated using the TRIZOL reagent from Invitrogen (Grand Island, NY). A commercial kit (#74804) from QIAGEN (Valencia, CA) was used for mRNA isolation from adipose tissue. Reverse transcription polymerase chain reaction (RT-PCR) was performed using a Superscript RT III enzyme kit (#11752-050) from Invitrogen. Quantitative real time PCR (qPCR) was conducted using SYBR Green as detection reagent and the data were analyzed using the ΔΔCt method (9). GAPDH mRNA level was used as an internal control, and all primer sequences used are listed in Table 1. Primers were synthesized at Sigma (St. Louis, MO). Melting curve analysis of all real time PCR products were conducted and showed a single DNA duplex.
Table 1.
PCR Primer Sequences
| Gene Name | Forward Primer Sequence (F) | Reverse Primer Sequence (R) |
|---|---|---|
| Acc | F: ATGGGCGGAATGGTCTCTTTC | R: TGGGGACCTTGTCTTCATCAT |
| Arg1 | F: CTCCAAGCCAAAGTCCTTAGAG | R: AGGAGCTGTCATTAGGGACATC |
| Cd11c | F: CTGGATAGCCTTTCTTCTGCTG | R: GCACACTGTGTCCGAACTCA |
| Cd36 | F: ATGGGCTGTGATCGGAACT | R: GTCTTCCCAATAAGCATGTCTCC |
| Cd68 | F: TGTCTGATCTTGCTAGGACCG | R: GAGAGTAACGGCCTTTTTGTGA |
| Cd206 | F: CTCTGTTCAGCTATTGGACGC | R: CGGAATTTCTGGGATTCAGCTTC |
| Chop | F: CTGGAAGCCTGGTATGAGGAT | R: CAGGGTCAAGAGTAGTGAAGGT |
| Cidea | F: TGACATTCATGGGATTGCAGAC | R: GGCCAGTTGTGATGACTAAGAC |
| Cpt1 α | F: CTCCGCCTGAGCCATGAAG | R: CACCAGTGATGATGCCATTCT |
| Cpt1 β | F: GCACACCAGGCAGTAGCTTT | R: CAGGAGTTGATTCCAGACAGGT |
| Dio2 | F: AATTATGCCTCGGAGAAGACCG | R: GGCAGTTGCCTAGTGAAAGGT |
| Edem1 | F: AGTCAAATGTGGATATGCTACGC | R: ACAGATATGATATGGCCCTCAGT |
| ElovB | F: TTCTCACGCGGGTTAAAAATGG | R: GAGCAACAGATAGACGACCAC |
| F4/80 | F: TGACTCACCTTGTGGTCCTAA | R: CTTCCCAGAATCCAGTCTTTCC |
| Fas | F: GGAGGTGGTG ATAGCCGGTAT | R: TGGGTAATCCATAGAGCCCAG |
| G6p | F: CGACTCGCTATCTCCAAGTGA | R: GTTGAACCAGTCTCCGACCA |
| Glut4 | F: GTGACTGGAACACTGGTCCTA | R: CCAGCCACGTTGCATTGTAG |
| Gpr78 | F: CAGATCTTCTCCACGGCTTC | R: AGCAGGAGGAATTCCAGTCA |
| Gpr94 | F: ATGCTCGGGACAATCAACACC | R: GATGTGGACGAACACCCAGAG |
| Herp | F: GCAGTTGGAGTGTGAGTCG | R: TCTGTGGATTCAGCACCCTTT |
| Ifn γ | F: ATGAACGCTACACACTGCATC | R: CCATCCTTTTGCCAGTTCCTC |
| Il1 β | F: GCAACTGTTCCTGAACTCAACT | R: ATCTTTTGGGGTCCGTCAACT |
| Il6 | F: TAGTCCTTCCTACCCCAATTTCC | R: TTGGTCCTTAGCCACTCCTTC |
| Mcp1 | F: TTAAAAACCTGGATCGGAACCAA | R: GCATTAGCTTCAGATTTACGGGT |
| Pepck | F: CTGCATAACGGTCTGGACTTC | R: CAGCAACTGCCCGTACTCC |
| Pdk4 | F: AGGGAGGTCGAGCTGTTCTC | R: GGAGTGTTCACTAAGCGGTCA |
| Pgc1 α | F: TATGGAGTGACATAGAGTGTGCT | R: CCACTTCA ATCCACCCAGAAAG |
| Pgc1 β | F: TCCTGTAAAAGCCCGGAGTAT | R: GCTCTGGTAGGGGCAGTGA |
| Prdm16 | F: CCAAGGCAAGGGCGAAGAA | R: AGTCTGGTGGGATTGGAATGT |
| Scd1 | F: TTCTTGCGATACACTCTGGTGC | R: CGGGATTGAATGTTCTTGTCGT |
| Srebp-1c | F: GCAGCCACCATCTA GCCTG | R: CAGCAGTGAGTCTGCCTTGAT |
| TNF α | F: CCCTCACACTCAGATCATCTTCT | R: GCTACGACGTGGGCTACAG |
| Ucp-1 | F: AGGCTTCCAGTACCATTAGGT | R: CTGAGTGAGGCAAAGCTGATTT |
| Ucp-2 | F: ATGGTTGGTTTCAAGGCCACA | R: CGGTATCCAGAGGGAAAGTGAT |
| Ucp-3 | F: CTGCACCGCCAGATGAGTTT | R: ATCATGGCTTGAAATCGGACC |
| Xbp1 | F: GACAGAGAGTCAAACTAACGTGG | R: GTCCAGCAGGCAAGAAGGT |
Determination of blood concentrations of insulin, aspartate aminotransferase (AST) and alanine aminotransferase (ALT)
Blood samples were collected from heart cavities immediately after euthanizing mice. Serum was isolated by centrifugation at 4,000 rpm for 5 min. Insulin levels in the blood were measured using a commercial ELISA kit (10-1113-01, Mercodia Developing Diagnostics). AST (TR70121) and ALT (TR71121) concentrations were determined following manufacture's instruction (Thermo-Scientific, Middletown, VA).
Determination of triglyceride level in the livers
The measurement was performed according to a previously reported procedure (10). Briefly, the liver was freshly cut at ~200 mg per piece and homogenized using a solution consisting of chloroform and methanol (2:1). The homogenates were incubated at 4 °C overnight and centrifuged at 12,000 rpm for 20 min. Supernatants were collected, dried and re-dissolved in 5% Triton-X100. The triglyceride levels were determined using a commercial kit (TR22203) from Thermo-Scientific (Middletown, VA).
H&E staining
Tissues were freshly collected after euthanizing mice. Tissue samples were fixed, dehydrated and embedded into paraffin. Tissue sections were cut at 6 μm in thickness and dried at 37 °C for 1 h. H&E staining was performed following the instruction of a commercial kit (#3500) from BBC Biochemical (Atlanta, GA). Slides were examined using an optical microscope and size measurements of adipocytes were taken using the NIS-Elements imaging platform purchased from Nikon Instruments Inc. (Melville, NY).
Oil-red O staining
Liver samples were freshly collected and immediately frozen in liquid nitrogen. Tissue sections were cut at 8 μm in thickness using a Cryostat. Sections were placed on slides and fixed using neutral buffered formalin for 30 min. The sections were washed with 60% isopropanol before being stained with freshly prepared Oil-red O working solution (#26079-05, Electron Microscopy Sciences) and counterstained with haematoxylin.
Statistics
Statistical analysis was conducted using one-way analysis of variance, and a P value below 0.05 (P < 0.05) is considered significantly different. The data were expressed as the mean ± SD.
Results
Rutin suppressed the palmitic acid-triggered production of TNFα by macrophages
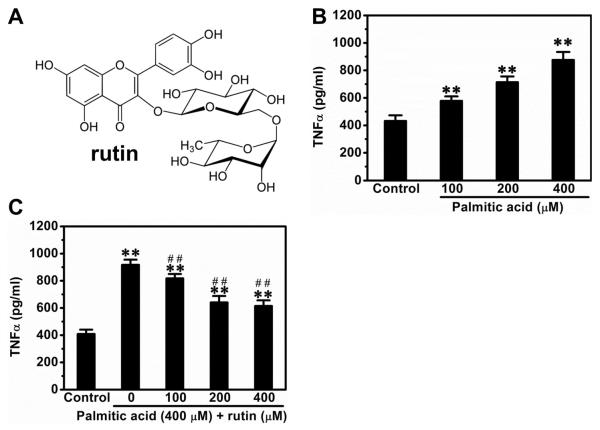
We first determined the suppressive effect of rutin (Figure 1A) on palmitic acid-triggered release of TNFα from macrophages. Palmitic acids induced TNFα release in a concentration-dependent manner. The TNFα level in culture medium was 900 pg/ml at palmitic acid concentration of 400 μM without affecting the viability of cells (Figure 1B). Pre-treatment with rutin at 400 μM did not affect the viability of cells but suppressed the elevated production of TNFα by ~33% (Figure 1C).
Figure 1. Suppression effect of rutin on palmitic acid-triggered release of TNFα by macrophages.
(A) Molecular structure of rutin. (B) Palmitic acid concentration dependent TNFα release. RAW 264.7 macrophages cultured in DMEM were incubated with different concentrations of palmitic acid for 12 h and supernatants were collected for TNFα determinations using ELISA kit. (C) Rutin suppressed the palmitic acid-induced release of TNFα in macrophages. RAW 264.7 macrophages were pre-treated with various concentrations of rutin for 4 h and then incubated with 400 μM palmitic acids with or without rutin for 12 h. Supernatants were collected for TNFα concentration determined. ** P < 0.01 vs control; ## P < 0.01 vs cells treated with palmitic acids without rutin. Data were from 3 independent experiments.
Rutin decreased transcription of genes for inflammation and ER stress in macrophages
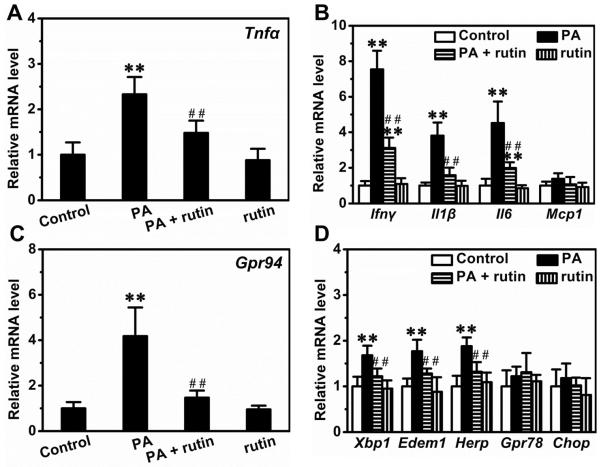
We next determined the mRNA levels of genes involved in inflammation and ER stress in macrophages. Palmitic acids increased the expression of Tnfα by ~2.3-fold and pre-treatment with rutin repressed the elevation by ~64.7% (Figure 2A). Similarly, palmitic acids elevated the transcription of genes critical for inflammation including Ifnγ, Il1β, Il6 but not Mcp1, and pre-treatment with rutin greatly decreased these elevations (Figure 2B). Moreover, palmitic acids increased the expression of Gpr94, a gene important for ER stress, by ~4.2-fold and pre-treatment with rutin suppressed the elevation by ~85.2% (Figure 2C). Additionally, palmitic acids also slightly increased the expression of other genes involved in ER stress such as Xbp1, Ede1 and Herp, and the elevations were completely blocked by pre-treatment with rutin (Figure 2D).
Figure 2. Suppression effect of rutin on palmitic acid-induced elevation of gene expression involved in inflammation and ER stress.
RAW 264.7 macrophages were pre-treated with or without 200 μM rutin for 4 h and then incubated with 400 μM palmitic acid and/or 200 μM rutin for 12 h. (A) Relative mRNA levels of TNFα. (B) Relative mRNA levels of genes involved in inflammation. (C) Relative mRNA levels of GPR94. (D) Relative mRNA levels of genes involved in ER stress. ** P < 0.01 vs control; ## P < 0.01 vs cells treated with palmitic acid without rutin. Data were from 3 independent experiments.
Rutin repressed ROS production in macrophages
To explore the possible mechanism, we next examined the production of ROS in macrophages. Palmitic acids markedly increased the intracellular ROS in macrophages, and pre-treatment with rutin significantly suppressed this elevation (Figure 3A). Treatment of cells with rutin alone did not have any effect. Quantitative analysis shows that palmitic acids increased the signals of ROS by ~5.2-fold, and pre-treatment with rutin reduced this elevation by ~68% (Figure 3B).
Figure 3. Suppression effect of rutin on palmitic acid-caused production of ROS in macrophages.
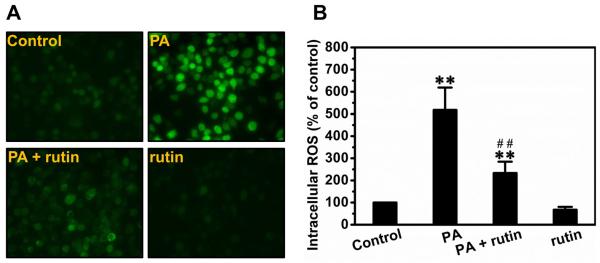
RAW 264.7 macrophages were pre-treated with or without 200 μM rutin for 4 h and further incubated with 400 μM palmitic acid and/or 200 μM rutin for 24 h. Cells were washed with PBS and incubated with the detecting reagent from the Total ROS Detection Kit for 30 min at 37 °C. (A) Representative pictures of ROS detection. (B) Quantitative analysis of ROS production (* P < 0.05 vs control; ** P < 0.01 vs control; ## P < 0.01 vs cells treated with palmitic acids without rutin).
Rutin protected mice from HFD-induced obesity
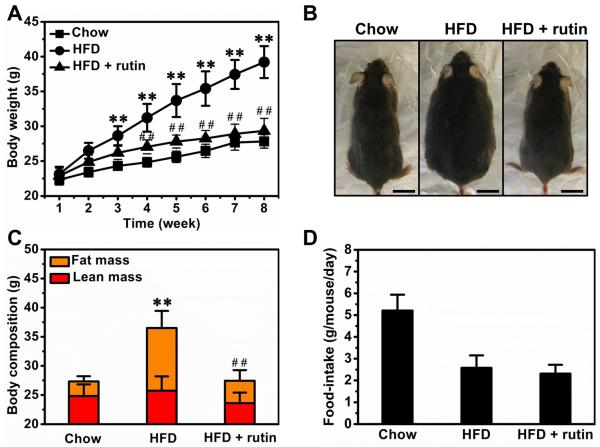
We evaluated the anti-obese activity of rutin in male C57BL/6 mice fed a HFD. Compared to mice fed a regular chow, Figure 4A shows HFD-fed mice had a significantly high body weight at ~39.2 g. Twice weekly intra-peritoneal injections of rutin completely blocked HFD-induced weight gain. The difference between HFD-fed mice with or without rutin injection was ~9.8 g and can be recognized visually (Figure 4B). To investigate the impact of the treatment on body composition, we measured lean and fat mass. Rutin greatly suppressed the increase of fat mass with no significant impact on lean mass (Figure 4C). In addition, treatment with rutin did not show significant impact on food-intake in mice on HFD (Figure 4D).
Figure 4. Effect of rutin on body weight and food-intake of animals fed a HFD.
(A) Growth curve (n = 5, ** P < 0.01 vs mice fed with regular chow; ## P < 0.01 vs mice fed with HFD). (B) Representative pictures of mice (Bar length = 1 cm). (C) Body composition (n = 5, ** P < 0.01 vs mice fed with regular chow; ## P < 0.01 vs mice fed with HFD). (D) Average food intake.
Rutin prevented HFD-induced hypertrophy in adipocytes
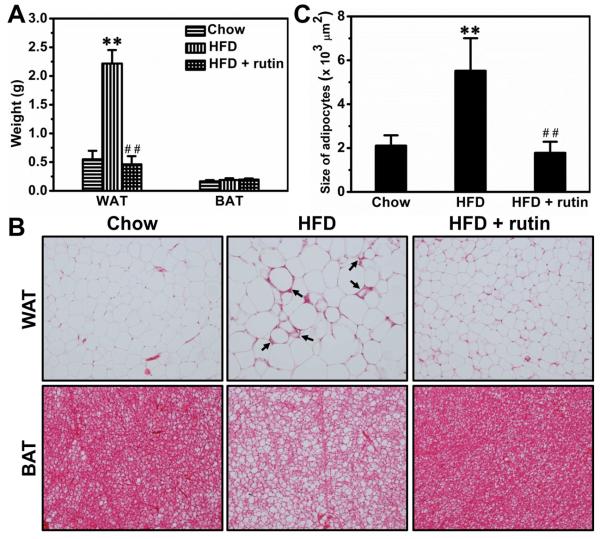
HFD feeding for 8 weeks increased the weight of the epididymal white adipose tissue (WAT) by ~4.1-fold, and rutin completely blocked the increase (Figure 5A). Interestingly, neither HFD feeding nor rutin treatment showed impact on brown adipose tissue (BAT) (Figure 5A). H&E staining of adipose tissues show that HFD-feeding caused apparent hypertrophy in adipocytes of WAT and also increased fat accumulation in BAT (Figure 5B). The hypertrophy in WAT was associated with an increase in crown-like structures (arrows in Figure 5B), a sign of macrophage activation. Rutin injection completely blocked the developments of hypertrophy and formation of crown-like structures in WAT (Figure 5B). Quantitative analysis of white adipocytes shows the same conclusion (Figure 5C).
Figure 5. Rutin-mediated blockade of hypertrophy and crown-like structures in the WAT of mice fed a HFD.
(A) Weight of adipose tissues (n = 5, ** P < 0.01 vs mice fed with regular chow; ## P < 0.01 vs mice fed with HFD). (B) Representative pictures of H&E staining for adipose tissues (Arrowheads points to crown-like structures). (C) Results of quantitative analysis (** P < 0.01 vs mice fed with regular chow; ## P < 0.01 vs mice fed with HFD).
Rutin suppressed the transcription of genes involved in chronic inflammation in WAT
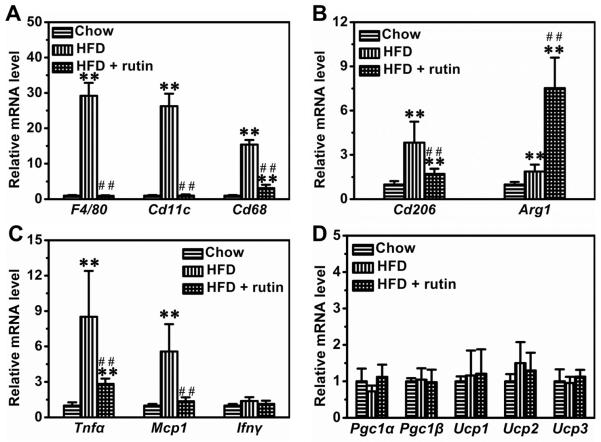
To explore the possible mechanism, we measured the mRNA levels of genes that are pivotal for chronic inflammation in WAT. HFD-feeding dramatically increased the expression of F4/80, Cd11c and Cd68 by ~29.2-fold, ~26.3-fold and ~15.4-fold, respectively (Figure 6A). Rutin completely blocked the elevated transcription of F4/80 and Cd11c, and greatly reduced the mRNA level of Cd68 by 78.4% (Figure 6A). Interestingly, HFD-feeding also increased the mRNA levels of Cd206 and Arg1, two marker genes for alternatively activated macrophages, by ~3.8-fold and ~1.9-fold, respectively (Figure 6B). However, rutin partly repressed Cd206 and increased Arg1 by ~7.5-fold (Figure 6B). Moreover, HFD-feeding elevated the mRNA levels of Tnfα and Mcp1 in WAT (Figure 6C). Rutin greatly repressed these elevations (Figure 6C). Additionally, neither HFD-feeding nor rutin treatment significantly changed the transcription levels of genes involved in energy expenditure in WAT, including Pgc1α, Pgc1β, Ucp1, Ucp2 and Ucp3 (Figure 6D).
Figure 6. Rutin-mediated transcription inhibition of the genes involved in chronic inflammation in WAT of mice fed a HFD.
(A) Relative mRNA levels of marker genes for classically activated macrophages (n = 4, ** P < 0.01 vs mice fed with regular chow; ## P < 0.01 vs mice fed with HFD). (B) Relative mRNA levels of marker genes for alternatively activated macrophages (n = 4, ** P < 0.01 vs mice fed with regular chow; ## P < 0.01 vs mice fed with HFD). (C) Relative mRNA levels of pro-inflammatory cytokines (n = 4, ** P < 0.01 vs mice fed a regular chow; ## P < 0.01 vs mice fed with HFD). (D) Relative mRNA level of genes involved in energy metabolism.
Rutin up-regulated the transcription of genes involved in energy expenditure in BAT
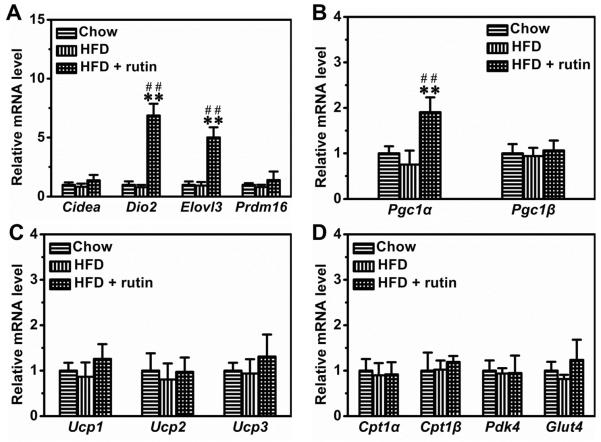
In BAT, rutin significantly increased the mRNA levels of Dio2 and Elovl3 by ~6.9-fold and ~5.1-fold, respectively (Figure 7A). Moreover, rutin also increased the transcription of Pgc1α by ~1.9-fold (Figure 7B). Additionally, we determined the mRNA levels of other genes involved in energy expenditure and nutrient metabolism in BAT, including Ucp1, Ucp2, Ucp3, Pgc1β, Cpt1α, Cpt1β, Pdk4 and Glut4. No mRNA levels of these genes were significantly changed by HFD-feeding or rutin treatment (Figures 7C and 7D)
Figure 7. Rutin-mediated modulation of gene expression in BAT of mice fed a HFD.
(A) Relative mRNA level of BAT signature genes (n = 4, ** P < 0.01 vs mice fed with regular chow; ## P < 0.01 vs mice fed with HFD). (B) – (C) Relative mRNA level of genes involved in energy expenditure (n = 4, ** P < 0.01 vs mice fed a regular chow; ## P < 0.01 vs mice fed a HFD). (D) Relative mRNA level of genes involving glucose and lipids metabolism.
Rutin blocked HFD-induced fatty liver
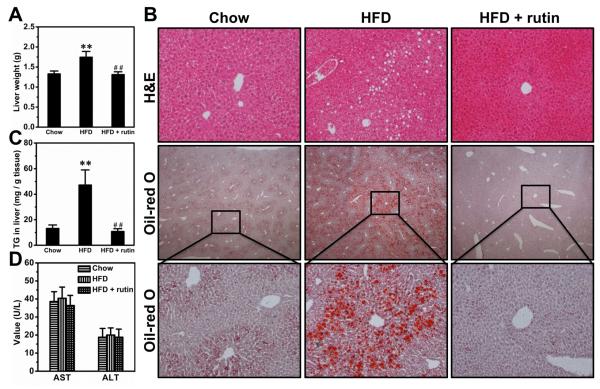
HFD feeding for 8 weeks markedly increased the weight of livers by ~31.3%, and rutin completely blocked the increase (Figure 8A). Consistently, HFD-feeding caused apparent fatty liver, as evidenced by the vacuoles in H&E staining and further confirmed by Oil-red O staining, and rutin completely blocked the development of HFD-induced fatty liver (Figure 8B). Quantitative determination of triglycerides in the liver leads to the same conclusion (Figure 8C). Both AST and ALT levels were in normal ranges for all animals fed with either HFD or regular chow (Figure 8D).
Figure 8. Rutin-mediated blockade of HFD-induced fatty liver.
(A) Liver weight (n = 5, ** P < 0.01 vs mice fed a regular chow; ## P < 0.01 vs mice fed a HFD). (B) Representative pictures of H&E staining and Oil-red O staining. (C) Liver triglyceride levels (n = 5, ** P < 0.01 vs mice fed a regular chow; ## P < 0.01 vs mice fed a HFD). (D) Blood level of AST and ALT.
Rutin modulated the transcription of genes involved in inflammation and nutrient metabolism in the liver
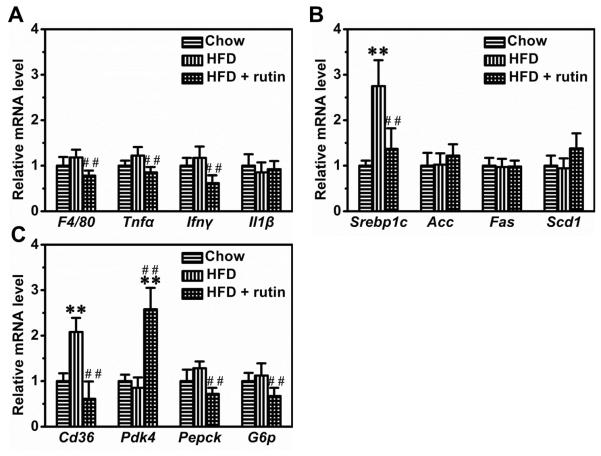
Results in Figure 9A indicate a slight increase in mRNA levels of several inflammatory genes including F4/80, Tnfα and IFNγ in animals fed a HFD, but the difference was not statistically significant. Treatment with rutin did not show a notable difference. However, HFD-feeding increased the mRNA level of Srebp1c by ~2.8-fold, but had no significant impact on Acc, Fas and Scd1 (Figure 9B). Rutin suppressed the elevated transcription of Srebp1c by ~78.9% (Figure 9B). Additionally, rutin increased the transcription of Pdk4 and decreased the HFD-induced transcription increase of Cd36, Pepck and G6p in the livers (Figure 9C).
Figure 9. Effect of rutin on hepatic gene expression.
(A) Relative mRNA levels of genes involving inflammation (## P < 0.01 vs mice fed a HFD). (B) Relative mRNA levels of genes for lipogenesis (n = 4, ** P < 0.01 vs mice fed a regular chow; ## P < 0.01 vs mice fed a HFD). (C) Relative mRNA levels of genes for glucose and lipids metabolism (n = 4, ** P < 0.01 vs mice fed with regular chow; ## P < 0.01 vs mice fed with HFD).
Rutin maintained glucose sensitivity in mice fed a HFD
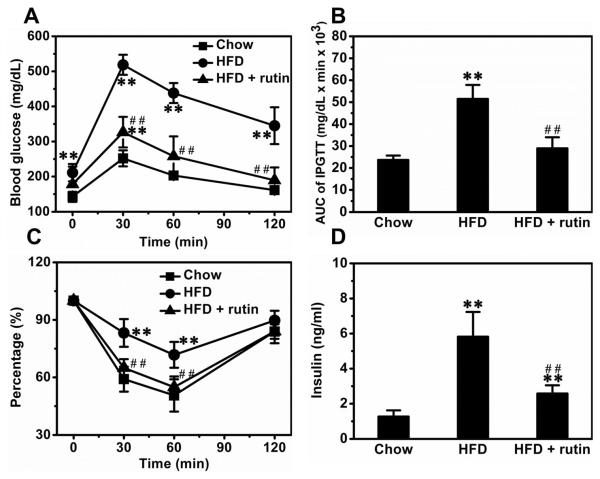
Mice fed a HFD for 8 weeks showed significantly impaired glucose sensitivity, and treatment with rutin maintained such sensitivity (Figure 10A). AUC calculations make this point clearer (Figure 10B). To assess insulin sensitivity in these mice, we performed ITT. HFD-feeding caused an apparent insulin resistance, and treatment with rutin completely blocked this resistance (Figure 10C). Blood insulin determinations show that HFD-feeding increased the levels of insulin by ~4.6-fold and treatment with rutin greatly reduced the elevation by ~71.2% (Figure 10D).
Figure 10. Rutin-mediated inhibition of HFD-induced glucose tolerance and insulin resistance.
(A) Glucose profiles of IPGTT (n = 5, ** P < 0.01 vs mice fed a regular chow; ## P < 0.01 vs mice fed a HFD). (B) Results of AUC calculations (n = 5, ** P < 0.01 vs mice fed a regular chow; ## P < 0.01 vs mice fed a HFD). (C) Results of ITT (n = 5, ** P < 0.01 vs mice fed a regular chow; ## P < 0.01 vs mice fed a HFD). (D) Insulin level in blood (n = 5, ** P < 0.01 vs mice fed a regular chow; ## P < 0.01 vs mice fed a HFD).
Discussion
In this study, we demonstrate that rutin suppresses palmitic acid-triggered inflammation in macrophages (Figure 1) and blocks HFD-induced obesity in mice (Figure 4). The anti-inflammatory effect of rutin in macrophages is correlated with its activity in suppressing ER stress and ROS production (Figures 2 and 3). The anti-obese effect of rutin in HFD-feeding mice was associated with its action in blocking macrophage infiltration (Figure 5) and chronic inflammation in adipose tissue (Figure 6).
Recent studies by Henao-Mejia et al. and Stienstra et al. show that chronic inflammation plays critical roles in the pathogenesis of obesity and its complications (5, 6). Chronic inflammation in obesity is primarily mediated by macrophages (11, 12). Emerging evidence shows that macrophages can be activated by saturated fatty acids (13, 14). Moreover, recent studies by Cruz et al. and Bulua et al. demonstrate that the promoted inflammation is correlated with increased ROS production (15, 16). In addition, recent studies also show that ER stress may play important roles in promoting inflammation as well (17, 18). Our results are in concurrence with these earlier studies in support that rutin suppresses the macrophage activation by decreasing ROS production and ER stress (Figures 2 and 3).
Macrophage infiltration into adipose tissue is one typical feature of obesity (19, 20). The original observation was reported by Weisberg et al. (20) and Xu et al. (21), and subsequently confirmed and expanded by others using different models (21–23). Although the detailed molecular mechanism for this process needs additional investigation, it is largely accepted that hypertrophy and necrosis of adipocytes play critical roles (24). Hypertrophy is a central cause for adult obesity and is usually associated with adipocyte death (19, 24). Moreover, Cinti and colleagues proposed that necrosis of adipocytes, driven by hypertrophy, is one of the predominate signals regulating macrophage infiltration (21, 25). The infiltrated macrophages aggregate around necrotic adipocytes, leading to development of crown-like structures and chronic inflammation (21, 25). Consistent with these studies, our data show that HFD-feeding causes apparent hypertrophy of adipocytes, resulting in an increased number of crown-like structures and elevated chronic inflammation in adipose tissue (Figures 5 and 6). Treatment with rutin significantly suppressed this process, suggesting that the anti-obese effect of this anti-oxidant may be achieved, at least in part, through blocking necrosis and chronic inflammation in adipose tissues. Additionally, rutin also has a direct effect on hepatocytes and adipocytes. A previous study by Wu et al. using hepatocarcinoma cells demonstrated that rutin can inhibit oleic acid-induced lipid accumulation in hepatocytes in vitro, probably via reducing lipogenesis and oxidative stress (26). In addition, using 3T3-L1 cells Choi et al. demonstrated that rutin is capable of suppressing differentiation of pre-adipocytes in vitro (27). These direct effects may be related to the anti-oxidant activity of rutin.
Insulin resistance is a major complication associated with obesity, and its underlying mechanism remains unclear (28, 29). Shulman and colleagues proposed that ectopic accumulation of lipids and dysregulation of intracellular signal pathways may play central roles in the etiology of insulin resistance (30, 31). On the other hand, accumulating evidence links chronic inflammation to the induction of insulin resistance, suggesting that macrophage-related inflammatory may also contribute to the pathogenesis of obesity-induced insulin resistance (32, 33). Our data show that treatment with rutin blocks development of insulin resistance and maintained glucose sensitivity in mice fed a HFD (Figure 10). These effects were correlated with the blocked ectopic fat accumulation in livers and the suppressed chronic inflammation in adipose tissues (Figures 6 and 8).
As a potent natural anti-oxidant, rutin can be found in many fruits and vegetables. Previous studies have suggested that rutin be used as a dietary supplement to modulate blood level of lipids and glucose. Additionally, it has also been applied in clinic for treatment of many diseases including poor circulation, high blood pressure and capillary fragility (34). The underlying mechanism, however, was considered complicated because no specific target has been identified. Our current study shows that rutin blocks macrophage activation and represses chronic inflammation in adipose tissue, providing new information for better understanding its beneficial effects and for using rutin to manage metabolic disorders. Evidently, further studies at molecular levels are still needed to see whether other pathways are also involved.
Rutin altered the expression levels of multiple genes in mice fed a HFD. Arg1 is a marker for alternatively activated macrophages (M2 macrophages), and elevated expression of Arg1 is usually associated with a higher ratio of M2 macrophages that are essential to maintain the homeostasis of adipose tissue (20, 35). Pgc1α, Dio2 and Elovl3 are three critical genes tightly involved in energy expenditure in BAT (36). Rutin up-regulated expression levels of these three genes, indicating that this natural anti-oxidant may be able to increase energy expenditure. Pdk4 encodes pyruvate dehydrogenase kinase isozyme 4 which is an enzyme located in the matrix of the mitochondria and regulates the balance between glucose and lipid metabolism (37). Rutin increased transcription of Pdk4 in liver, suggesting that it may elevate lipid oxidation in this organ. Further studies are warranted to elucidate how rutin treatment altered expression levels of these genes in vivo.
In conclusion, our results show that rutin is able to block HFD-induced obesity, fatty liver and insulin resistance in mice, and these beneficial effects were correlated with a blockade of macrophage infiltration and chronic inflammation in adipose tissue. Our results confirm that supplementation of rutin is a promising strategy for preventing HFD-induced obesity and its associated complications.
Acknowledgement
The study was supported in part by grants from NIH (RO1EB007357 and RO1HL098295). We thank Ms. Ryan Fugett for English editing.
Footnotes
Conflict of Interest The authors claim no conflicts of interest.
Reference
- 1.Hsu CL, Wu CH, Huang SL, Yen GC. Phenolic compounds rutin and o-coumaric acid ameliorate obesity induced by high-fat diet in rats. J Agric Food Chem. 2009;57(2):425–431. doi: 10.1021/jf802715t. [DOI] [PubMed] [Google Scholar]
- 2.Panchal SK, Poudyal H, Arumugam TV, Brown L. Rutin attenuates metabolic changes, nonalcoholic steatohepatitis, and cardiovascular remodeling in high-carbohydrate, high-fat diet-fed rats. J Nutr. 2011;141(6):1062–1069. doi: 10.3945/jn.111.137877. [DOI] [PubMed] [Google Scholar]
- 3.Hao HH, Shao ZM, Tang DQ, Lu Q, Chen X, Yin XX, Wu J, Chen H. Preventive effects of rutin on the development of experimental diabetic nephropathy in rats. Life Sci. 2012;91(19–20):959–967. doi: 10.1016/j.lfs.2012.09.003. [DOI] [PubMed] [Google Scholar]
- 4.Kamalakkannan N, Stanely Mainzen Prince P. The influence of rutin on the extracellular matrix in streptozotocin-induced diabetic rat kidney. J Pharm Pharmacol. 2006;58(8):1091–1098. doi: 10.1211/jpp.58.8.0010. [DOI] [PubMed] [Google Scholar]
- 5.Henao-Mejia J, Elinav E, Jin C, Hao L, Mehal WZ, Strowig T, Thaiss CA, Kau AL, Eisenbarth SC, Jurczak MJ, Camporez JP, Shulman GI, Gordon JI, Hoffman HM, Flavell RA. Inflammasome-mediated dysbiosis regulates progression of NAFLD and obesity. Nature. 2012;482(7384):179–185. doi: 10.1038/nature10809. [DOI] [PMC free article] [PubMed] [Google Scholar]
- 6.Stienstra R, van Diepen JA, Tack CJ, Zaki MH, van de Veerdonk FL, Perera D, Neale GA, Hooiveld GJ, Hijmans A, Vroegrijk I, van den Berg S, Romijn J, Rensen PC, Joosten LA, Netea MG, Kanneganti TD. Inflammasome is a central player in the induction of obesity and insulin resistance. Proc Natl Acad Sci U S A. 2011;108(37):15324–15329. doi: 10.1073/pnas.1100255108. [DOI] [PMC free article] [PubMed] [Google Scholar]
- 7.Hu QH, Zhang X, Pan Y, Li YC, Kong LD. Allopurinol, quercetin and rutin ameliorate renal NLRP3 inflammasome activation and lipid accumulation in fructose-fed rats. Biochem Pharmacol. 2012;84(1):113–125. doi: 10.1016/j.bcp.2012.03.005. [DOI] [PubMed] [Google Scholar]
- 8.Javed H, Khan MM, Ahmad A, Vaibhav K, Ahmad ME, Khan A, Ashafaq M, Islam F, Siddiqui MS, Safhi MM. Rutin prevents cognitive impairments by ameliorating oxidative stress and neuroinflammation in rat model of sporadic dementia of Alzheimer type. Neuroscience. 2012;210:340–352. doi: 10.1016/j.neuroscience.2012.02.046. [DOI] [PubMed] [Google Scholar]
- 9.Livak KJ, Schmittgen TD. Analysis of relative gene expression data using real-time quantitative PCR and the 2(-Delta Delta C(T)) Method. Methods. 2001;25(4):402–408. doi: 10.1006/meth.2001.1262. [DOI] [PubMed] [Google Scholar]
- 10.Hara A, Radin NS. Lipid extraction of tissues with a low-toxicity solvent. Anal Biochem. 1978;90(1):420–426. doi: 10.1016/0003-2697(78)90046-5. [DOI] [PubMed] [Google Scholar]
- 11.Monteiro R, Azevedo I. Chronic inflammation in obesity and the metabolic syndrome. Mediators Inflamm. 2010 doi: 10.1155/2010/289645. doi:pii: 289645. 10.1155/2010/289645. [DOI] [PMC free article] [PubMed] [Google Scholar]
- 12.Nijhuis J, Rensen SS, Slaats Y, van Dielen FM, Buurman WA, Greve JW. Neutrophil activation in morbid obesity, chronic activation of acute inflammation. Obesity (Silver Spring) 2009;17(11):2014–2018. doi: 10.1038/oby.2009.113. [DOI] [PubMed] [Google Scholar]
- 13.Huang S, Rutkowsky JM, Snodgrass RG, Ono-Moore KD, Schneider DA, Newman JW, Adams SH, Hwang DH. Saturated fatty acids activate TLR-mediated proinflammatory signaling pathways. J Lipid Res. 2012;53(9):2002–2013. doi: 10.1194/jlr.D029546. [DOI] [PMC free article] [PubMed] [Google Scholar]
- 14.Shi H, Kokoeva MV, Inouye K, Tzameli I, Yin H, Flier JS. TLR4 links innate immunity and fatty acid-induced insulin resistance. J Clin Invest. 2006;116(11):3015–3025. doi: 10.1172/JCI28898. [DOI] [PMC free article] [PubMed] [Google Scholar]
- 15.Cruz CM, Rinna A, Forman HJ, Ventura AL, Persechini PM, Ojcius DM. ATP activates a reactive oxygen species-dependent oxidative stress response and secretion of proinflammatory cytokines in macrophages. J Biol Chem. 2007;282(5):2871–2879. doi: 10.1074/jbc.M608083200. [DOI] [PMC free article] [PubMed] [Google Scholar]
- 16.Bulua AC, Simon A, Maddipati R, Pelletier M, Park H, Kim KY, Sack MN, Kastner DL, Siegel RM. Mitochondrial reactive oxygen species promote production of proinflammatory cytokines and are elevated in TNFR1-associated periodic syndrome (TRAPS) J Exp Med. 2011;208(3):519–533. doi: 10.1084/jem.20102049. [DOI] [PMC free article] [PubMed] [Google Scholar]
- 17.Goodall JC, Wu C, Zhang Y, McNeill L, Ellis L, Saudek V, Gaston JS. Endoplasmic reticulum stress-induced transcription factor, CHOP, is crucial for dendritic cell IL-23 expression. Proc Natl Acad Sci U S A. 2010;107(41):17698–17703. doi: 10.1073/pnas.1011736107. [DOI] [PMC free article] [PubMed] [Google Scholar]
- 18.Wheeler MC, Rizzi M, Sasik R, Almanza G, Hardiman G, Zanetti M. KDEL-retained antigen in B lymphocytes induces a proinflammatory response: a possible role for endoplasmic reticulum stress in adaptive T cell immunity. J Immunol. 2008;181(1):256–264. doi: 10.4049/jimmunol.181.1.256. [DOI] [PubMed] [Google Scholar]
- 19.Surmi BK, Hasty AH. Macrophage infiltration into adipose tissue: initiation, propagation and remodeling. Future Lipidol. 2008;3(5):545–556. doi: 10.2217/17460875.3.5.545. [DOI] [PMC free article] [PubMed] [Google Scholar]
- 20.Suganami T, Ogawa Y. Adipose tissue macrophages: their role in adipose tissue remodeling. J Leukoc Biol. 2010;88(1):33–39. doi: 10.1189/jlb.0210072. [DOI] [PubMed] [Google Scholar]
- 21.Cinti S, Mitchell G, Barbatelli G, Murano I, Ceresi E, Faloia E, Wang S, Fortier M, Greenberg AS, Obin MS. Adipocyte death defines macrophage localization and function in adipose tissue of obese mice and humans. J Lipid Res. 2005;46(11):2347–2355. doi: 10.1194/jlr.M500294-JLR200. [DOI] [PubMed] [Google Scholar]
- 22.Kanda H, Tateya S, Tamori Y, Kotani K, Hiasa K, Kitazawa R, Kitazawa S, Miyachi H, Maeda S, Egashira K, Kasuga M. MCP-1 contributes to macrophage infiltration into adipose tissue, insulin resistance, and hepatic steatosis in obesity. J Clin Invest. 2006;116(6):1494–1505. doi: 10.1172/JCI26498. [DOI] [PMC free article] [PubMed] [Google Scholar]
- 23.Cancello R, Tordjman J, Poitou C, Guilhem G, Bouillot JL, Hugol D, Coussieu C, Basdevant A, Bar Hen A, Bedossa P, Guerre-Millo M, Clement K. Increased infiltration of macrophages in omental adipose tissue is associated with marked hepatic lesions in morbid human obesity. Diabetes. 2006;55(6):1554–1561. doi: 10.2337/db06-0133. [DOI] [PubMed] [Google Scholar]
- 24.Sun K, Kusminski CM, Scherer PE. Adipose tissue remodeling and obesity. J Clin Invest. 2011;121(6):2094–2101. doi: 10.1172/JCI45887. [DOI] [PMC free article] [PubMed] [Google Scholar]
- 25.Murano I, Barbatelli G, Parisani V, Latini C, Muzzonigro G, Castellucci M, Cinti S. Dead adipocytes, detected as crown-like structures, are prevalent in visceral fat depots of genetically obese mice. J Lipid Res. 2008;49(7):1562–1568. doi: 10.1194/jlr.M800019-JLR200. [DOI] [PubMed] [Google Scholar]
- 26.Wu CH, Lin MC, Wang HC, Yang MY, Jou MJ, Wang CJ. Rutin inhibits oleic acid induced lipid accumulation via reducing lipogenesis and oxidative stress in hepatocarcinoma cells. J Food Sci. 2011;76(2):T65–T72. doi: 10.1111/j.1750-3841.2010.02033.x. [DOI] [PubMed] [Google Scholar]
- 27.Choi I, Park Y, Choi H, Lee EH. Anti-adipogenic activity of rutin in 3T3-L1 cells and mice fed with high-fat diet. Biofactors. 2006;26(4):273–281. doi: 10.1002/biof.5520260405. [DOI] [PubMed] [Google Scholar]
- 28.Qatanani M, Lazar MA. Mechanisms of obesity-associated insulin resistance: many choices on the menu. Genes Dev. 2007;21(12):1443–1455. doi: 10.1101/gad.1550907. [DOI] [PubMed] [Google Scholar]
- 29.Samuel VT, Petersen KF, Shulman GI. Lipid-induced insulin resistance: unravelling the mechanism. Lancet. 2010;375(9733):2267–2277. doi: 10.1016/S0140-6736(10)60408-4. [DOI] [PMC free article] [PubMed] [Google Scholar]
- 30.Shulman GI. Cellular mechanisms of insulin resistance. J Clin Invest. 2000;106(2):171–176. doi: 10.1172/JCI10583. [DOI] [PMC free article] [PubMed] [Google Scholar]
- 31.Petersen KF, Shulman GI. Etiology of insulin resistance. Am J Med. 2006;119(5 Suppl 1):S10–S16. doi: 10.1016/j.amjmed.2006.01.009. [DOI] [PMC free article] [PubMed] [Google Scholar]
- 32.Xu H, Barnes GT, Yang Q, Tan G, Yang D, Chou CJ, Sole J, Nichols A, Ross JS, Tartaglia LA, Chen H. Chronic inflammation in fat plays a crucial role in the development of obesity-related insulin resistance. J Clin Invest. 2003;112(12):1821–1830. doi: 10.1172/JCI19451. [DOI] [PMC free article] [PubMed] [Google Scholar]
- 33.Shoelson SE, Lee J, Goldfine AB. Inflammation and insulin resistance. J Clin Invest. 2006;116(7):1793–1801. doi: 10.1172/JCI29069. [DOI] [PMC free article] [PubMed] [Google Scholar]
- 34.Pescosolido N, Librando A. Oral administration of an association of forskolin, rutin and vitamins B1 and B2 potentiates the hypotonising effects of pharmacological treatments in POAG patients. Clin Ter. 2010;161(3):e81–e85. [PubMed] [Google Scholar]
- 35.Murray PJ, Wynn TA. Obstacles and opportunities for understanding macrophage polarization. J Leukoc Biol. 2011;89(4):557–563. doi: 10.1189/jlb.0710409. [DOI] [PMC free article] [PubMed] [Google Scholar]
- 36.Bostrom P, Wu J, Jedrychowski MP, Korde A, Ye L, Lo JC, Rasbach KA, Bostrom EA, Choi JH, Long JZ, Kajimura S, Zingaretti MC, Vind BF, Tu H, Cinti S, Hojlund K, Gygi SP, Spiegelman BM. A PGC1-alpha-dependent myokine that drives brown-fat-like development of white fat and thermogenesis. Nature. 2012;481(7382):463–468. doi: 10.1038/nature10777. [DOI] [PMC free article] [PubMed] [Google Scholar]
- 37.Berggren JR, Boyle KE, Chapman WH, Houmard JA. Skeletal muscle lipid oxidation and obesity: influence of weight loss and exercise. Am J Physiol Endocrinol Metab. 2008;294(4):E726–E732. doi: 10.1152/ajpendo.00354.2007. [DOI] [PubMed] [Google Scholar]


