

Abstract
Cholinergic neuromodulation in neocortical networks is required for gamma oscillatory activity associated with working memory and other cognitive processes. Importantly, the cholinergic agonist carbachol (CCh) induces gamma oscillations in vitro, via mechanisms that may be shared with in vivo gamma oscillations and that are consistent with the pyramidal interneuron network gamma (PING) model. In PING oscillations, pyramidal cells (PCs), driven by asynchronous excitatory input, recruit parvalbumin-positive fast-spiking interneurons (FSNs), which then synchronize the PCs via feedback inhibition. Whereas the PING model is favoured by current data, how cholinergic neuromodulation contributes to gamma oscillation production is poorly understood. We thus studied the effects of cholinergic modulation on circuit components of the PING model in mouse medial prefrontal cortex (mPFC) brain slices. CCh depolarized and evoked action potential firing in a fraction of PCs and increased excitatory synaptic input onto FSNs. In synaptically connected pairs, CCh reduced the short-term depression at FSN–PC and PC–FSN synapses, equalizing synaptic strength during repetitive presynaptic firing while simultaneously increasing the failure probability. Interestingly, when PCs or FSNs fired in response to gamma frequency oscillatory inputs, CCh increased the firing probability per cycle. Combined with the equalization of synaptic strength, an increase by CCh in the fraction of neurons recruited per oscillation cycle may support oscillatory synchrony of similar strength during relatively long oscillation episodes such as those observed during working memory tasks, suggesting a significant functional impact of cholinergic modulation of mPFC circuit components crucial for the PING model.
Key points
Previous studies indicate that cholinergic neuromodulation is required for cognitive processes and for gamma oscillatory activity in neocortical networks in vivo. The cholinergic agonist carbachol (CCh) induces gamma oscillations in vitro, via mechanisms that may be shared with those mediating in vivo gamma oscillations.
Here, we studied the effects of CCh on cortical circuit components thought to be critical for gamma oscillations, and found that CCh stimulated firing of pyramidal cells (PCs) and increased excitatory synaptic input onto fast-spiking interneurons (FSNs).
CCh also modulated synaptic transmission between FSNs and PCs, decreasing synaptic depression during repetitive presynaptic firing, while simultaneously reducing the unitary synaptic currents.
CCh increased the probability of neuron firing per oscillation cycle when PCs and FSNs fired in response to oscillatory input at gamma frequency.
Combined, these effects of CCh may help explain the contribution of cholinergic modulation to gamma oscillations.
Introduction
Cholinergic neuromodulation is essential for various cognitive processes including working memory, which is impaired by cortical ACh depletion (Croxson et al. 2011) or muscarinic ACh receptor (mAChR) antagonists (Yamamoto et al. 2011; Zhou et al. 2011). Synchronized gamma band (30–80 Hz) oscillations may be involved in the neural basis of the role of ACh signalling in cognition, as gamma band power increases in relation to working memory load (Roux et al. 2012) and abnormal gamma oscillations are associated with cognitive deficits (Uhlhaas & Singer, 2010). Cholinergic neuron stimulation facilitates in vivo gamma oscillations (Munk et al. 1996; Cape et al. 2000), which also are stabilized by mAChR agonists (Rodriguez et al. 2010) and depressed by mAChR antagonists (Rodriguez et al. 2004). In rodents, the medial prefrontal cortex (mPFC) is highly involved in cognition (Seamans et al. 2008; Rossi et al. 2012), and displays prominent in vivo gamma oscillations (Ruiz-Mejias et al. 2011) that are dependent on cholinergic input (Janiesch et al. 2011).
Gamma oscillations produced by bath application of the mAChR agonist carbachol (CCh) to hippocampal and neocortical brain slices (Buhl et al. 1998; Hajos et al. 2004; Mann et al. 2005; Yamawaki et al. 2008; Oke et al. 2010; Roopun et al. 2010; Anver et al. 2011; Akam et al. 2012) provide a good model system to study the circuit mechanisms involved, as they share several properties with in vivo gamma rhythms. Both in vivo and in vitro, pyramidal cells (PCs) fire in synchrony but at a frequency below gamma, whereas interneuron firing follows the network oscillation frequency more closely (Csicsvari et al. 2003; Hajos et al. 2004; Mann et al. 2005; Senior et al. 2008). Moreover, spike timing during the oscillation cycle is quite similar in vivo and in vitro, with PCs firing first, followed by interneurons a few milliseconds later (Hajos & Paulsen, 2009; Buzsaki & Wang, 2012).
The spike timing during gamma is consistent with the pyramidal interneuron network gamma (PING) model, in which PCs, driven by asynchronous excitatory input, recruit interneurons via monosynaptic inputs and are synchronized via feedback inhibition (Whittington et al. 2000; Mann & Paulsen, 2005; Hajos & Paulsen, 2009). Such feedback inhibition is mainly mediated by parvalbumin-positive fast-spiking neurons (FSNs; Mann et al. 2005; Fuchs et al. 2007; Sohal et al. 2009; Oren et al. 2010). Alternative to the PING model, in the interneuron network gamma (ING) model, oscillations depend on reciprocal inhibition between FSNs that receive strong tonic excitation (Whittington et al. 1995; Wang & Buzsaki, 1996). However, in ING models, the firing of PCs and FSNs is nearly synchronous (Borgers & Kopell, 2003), and thus inconsistent with the spike timing observed experimentally. Moreover, gamma oscillations are unaffected when the reciprocal inhibition required in ING is disrupted by deleting GABAA receptors selectively in FSNs (Wulff et al. 2009). In contrast, ablation of AMPA receptors selectively in FSNs, and thus the phasic interneuron excitation required in PING, markedly disrupts gamma activity (Fuchs et al. 2007). Thus, currently available data suggest that gamma oscillations are produced via PING-like mechanisms.
Importantly, the mechanisms of CCh-induced in vitro gamma oscillations seem to differ between hippocampal and neocortical circuits. Whereas bath-applied CCh reliably induces gamma activity in hippocampal slices (Fisahn et al. 1998; Hajos et al. 2004; Mann et al. 2005; Akam et al. 2012), in somatosensory, motor or visual cortex slices, CCh-induced gamma oscillations require co-application of the glutamate agonist kainate (Buhl et al. 1998; Yamawaki et al. 2008; Oke et al. 2010; Anver et al. 2011). The mechanisms by which addition of kainate facilitates CCh-induced gamma oscillations in neocortical slices may involve additive contributions of each modulator. Alternatively, the combination of both modulators may produce synergistic interactions not predictable based on the effects of each modulator alone. Therefore, a necessary first step to understand the mechanisms of neocortical gamma activity is characterizing the independent contribution of each modulator to the mechanisms of PING oscillations.
Here, we assessed the contribution of mAChR activation to PING oscillations by testing the effects of CCh on circuit components involved in oscillation production in the PING model. In recordings from single neurons in layer 3 of mouse mPFC, we found that CCh evoked firing in PCs and increased the EPSP frequency in FSNs. Furthermore, by attenuating short-term depression of unitary synaptic currents in synaptically connected pairs of PCs and FSNs, CCh equalized synaptic strength throughout presynaptic neuron spike trains in both PC–FSN and FSN–PC connections. Such an equalization effect was associated with a higher probability of failures that decreased the unitary synaptic current strength. We found, in addition, that CCh increased the probability of PC and FSN firing per oscillation cycle during stimulation with gamma wave-like input currents, an effect that may balance the higher synaptic failure rate observed in the presence of CCh. These findings reveal important mechanisms by which mAChR activation may contribute to the production of gamma rhythms in mPFC circuits.
Methods
Ethical approval
Experiments were carried out in accordance with the guidelines of the NIH, and approved by the University of Pittsburgh's Institutional Animal Care and Use Committee. The authors have read, and the experiments comply with the policies and regulations of The Journal of Physiology (Drummond, 2009).
Slices
Experiments were conducted in brain slices prepared from the frontal cortex of 25–95-day-old (mean age: 47 days) G42 mice (Jackson Laboratory) of either sex, in which enhanced green fluorescent protein (GFP) is exclusively expressed in parvalbumin-positive FSNs (Chattopadhyaya et al. 2004). Mice were deeply anaesthetized with isoflurane and decapitated. The brain was quickly removed and immersed in ice-cold slicing solution containing (in mM): choline chloride, 120; KCl, 2.5; Na2HPO4, 1.2; NaHCO3, 25; glucose, 20; ascorbate, 1.3; pyruvate, 2.4; MgCl2, 7; CaCl2, 0.5; pH 7.3–7.4, and continuously bubbled with 95% O2–5% CO2. The mPFC was next sectioned into 300 μm-thick slices in the coronal plane, using a vibrating microtome (VT1000S, Leica Microsystems). Slices were immediately placed in an incubation chamber filled with artificial cerebrospinal fluid (ACSF) maintained at 36°C and containing (in mM): NaCl, 125; KCl, 2.5; Na2HPO4, 1.25; glucose, 10; NaHCO3, 25; ascorbate, 0.4; MgCl2, 1; CaCl2, 2; pH 7.3–7.4 when gassed with carbogen (95% O2 and 5% CO2). After 5 min of incubation at 36°C, brain slices were stabilized at room temperature in the same solution for at least 30 min before they were transferred to the recording chamber.
Electrophysiological recordings
For recording, slices were transferred to a submersion chamber and superfused at a rate of 2 ml min−1 with oxygenated ACSF solution at 30–32°C. Patch pipette, tight-seal whole-cell recordings were obtained from visually identified layer 3 PCs and GFP fluorescent FSNs in the infralimbic, prelimbic or anterior cingulate regions of the mouse medial frontal cortex, here collectively referred to as mPFC. Layer 3 was defined visually under bright-field microscopy as the band between: (1) twice the thickness of layer 1, measured as the distance between the pial surface and the border between layer 1 and layer 2; and (2) half the distance from the pial surface and the white matter border. PCs and FSNs were visualized using Olympus or Zeiss microscopes equipped with infrared illumination, differential interference contrast, epifluorescence illumination and CCD video cameras (EXi Aqua, Q-Imaging). FSNs were identified by GFP fluorescence (excitation wavelength = 470 ± 20 nm). Pipettes pulled from borosilicate glass had a resistance of 3–6 MΩ when filled with the following solutions (in mM): solution A: potassium gluconate, 120; KCl, 10; HEPES, 10; EGTA, 0.2; MgATP, 4.5; NaGTP, 0.3; sodium phosphocreatine, 14; the pH was adjusted to 7.2–7.4 using KOH; solution B: potassium gluconate, 60; KCl, 70; HEPES, 10; EGTA, 0.2; MgATP, 4.5; NaGTP, 0.3; sodium phosphocreatine, 14; the pH was adjusted to 7.2–7.4 using KOH. Solution A was used in all whole-cell recordings except for PCs in FSN–PC connected pairs, in which solution B was used to increase the driving force and thus detection of IPSCs. In cell-attached recordings (Fig. 1C), pipettes were filled with oxygenated ACSF. Recordings were obtained using Multiclamp 700B amplifiers (Molecular Devices). Signals were low-pass filtered at 6 kHz, and digitized at 10 or 20 kHz using Power 1401 data acquisition interfaces (Cambridge Electronic Design). Data acquisition and analysis were performed using Signal 5 software (Cambridge Electronic Design). In voltage-clamp mode, the pipette capacitance was compensated and series resistance was continuously monitored but was not compensated. Only recordings with a stable series resistance of <20 MΩ were used for analysis. When current-clamp mode was used, series resistance and pipette capacitance were monitored and cancelled using bridge and capacitance neutralization. Only cells with an initial resting membrane potential of −60 to −80 mV were included in this study.
Figure 1. Cholinergic modulation induces depolarization and AP firing in PCs.
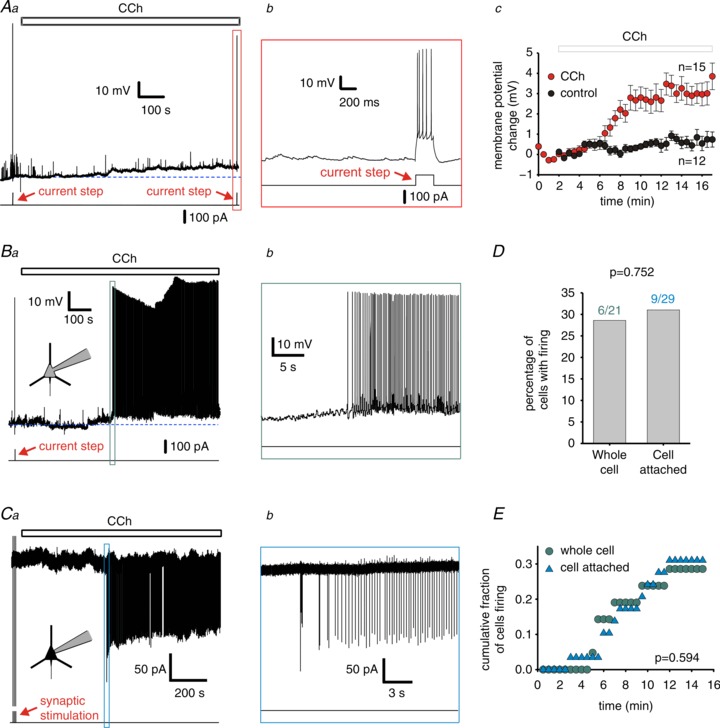
Aa, representative trace of a recording from a non-firing PC. The line below the trace indicates the timing of current steps used to test the overall capacity of the recorded neuron to fire spikes. The open bar above the trace indicates carbachol (CCh) application, and the dashed line shows the baseline resting membrane potential. Ab, expanded region of the trace indicated by the vertical rectangle in a. Ac, changes in membrane potential versus time for non-firing PCs in control conditions (n= 12) and in the presence of 10 μM CCh (n= 15), the open bar indicates CCh bath application. Data are mean ± SEM. Paired sample t test indicated a significant depolarization in the presence of CCh versus control from the average values of the membrane potential change between 15 and 17 min (the measured data points for each cell between 15 and 17 min were averaged), P < 0.05. B–E, PCs with CCh-evoked firing. B, C, representative traces of recordings of firing PCs in whole-cell (B) and cell-attached recording configurations (C), the continuous line below the trace indicates the timing of test current steps (B) or synaptic stimulation (C). The dashed line in Ba shows the baseline resting membrane potential. D, the percentage of PCs displaying CCh-evoked firing in whole-cell and cell-attached configurations. Chi-squared comparison of proportions indicated no significant difference between the two recording configurations, P= 0.752. E, cumulative fraction of PCs displaying CCh-evoked AP firing as a function of time of CCh bath application in whole-cell and cell-attached recordings. The cumulative fraction of PCs firing did not differ between recording conditions (Kolmogorov–Smirnov test, P= 0.594).
The frequency of spontaneous (s)EPSPs was measured in current-clamp recordings of FSNs in the presence of the GABAA receptor blocker gabazine (10 μM) using Mini analysis software (Synaptosoft). When necessary, the cells’ membrane potential was maintained at the resting membrane potential value measured at the beginning of the experiment by injecting current through the recording pipette.
Gamma wave stimulation
To determine the effects of cholinergic modulation on the intrinsic response of PCs and FSNs to rhythmic input at gamma frequency, we used a gamma wave stimulus protocol. For these experiments, we injected 4.5 s-long rectangular current steps combined with a 4 s-long 50 Hz sinusoidal current wave. The rectangular current step amplitude was progressively increased in 5 pA increments, and each step amplitude was repeated three times. After the rheobase (minimal rectangular step current necessary to elicit spikes) was determined for each cell, the neuron was stimulated with at least 10 additional steps of increasing amplitude. The sinusoidal current wave had onset 0.5 s after the beginning of the rectangular step (see Fig. 9). The amplitude of the sinusoidal wave was adjusted to produce a 6 ± 1 mV change (peak-to-peak) in the membrane potential, so that the gamma wave sequentially depolarized and hyperpolarized the neuron by ∼3 mV relative to the baseline potential generated by the rectangular current step (Fig. 9). After application of the gamma wave stimulus in control conditions, CCh (10 μM) was bath-applied for 10 min, after which the gamma wave stimulation was resumed using identical parameters. The voltage threshold for action potential (AP) firing was measured in APs evoked by rheobase current. The frequency of AP firing produced by the gamma wave stimulus was measured for spikes produced during the time window of the sinusoidal current wave, thus excluding spikes in cases evoked by the rectangular current step before or after this time window.
Figure 9. Changes in oscillatory firing of pyramidal cells (PCs) and fast-spiking interneurons (FSNs) as a function of gamma wave stimulus strength.
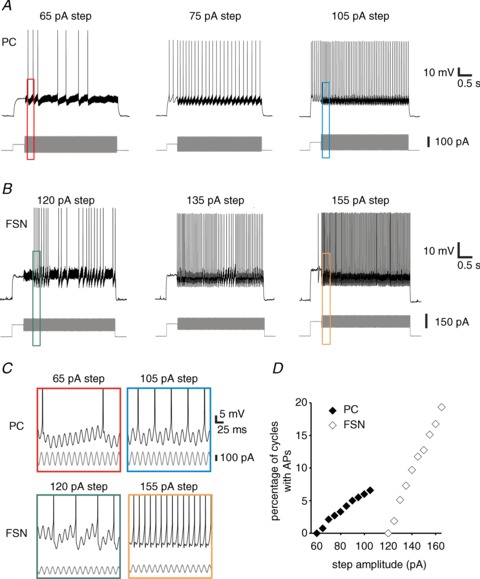
A, from left to right, example traces of recordings from a PC during application of gamma wave stimuli of 65, 75 or 105 pA amplitude. B, from left to right, example of recordings from a FSN during application of gamma wave stimuli of 120, 135 or 155 pA amplitude. C, expanded regions of the traces as indicated by the rectangles in A and B showing an increase in firing probability per oscillation cycle as a function of stimulus strength. D, changes in firing probability produced by gamma wave stimuli of increasing amplitude for the example PC and FSN shown in A and B. AP, action potential.
Paired recordings from synaptically connected PCs and FSNs
Simultaneous whole-cell recordings were performed from FSN and PC pairs in layer 3 of the mPFC. Presynaptic cells were recorded in current-clamp, when necessary, injecting steady current to keep the steady-state membrane potential near rest. The postsynaptic cells were recorded in voltage-clamp mode at a holding potential of −80 mV. The presence of a synaptic connection in paired recordings was determined by evoking APs with brief suprathreshold current pulses (2–3 ms, 2 nA) at 0.2 Hz in one neuron while searching for a postsynaptic current time locked to the evoked AP in the other neuron. We recorded FSN–PC and PC–FSN connected pairs. The overall probability of finding a connection was 37%, and the probabilities for each type of connection were 23% (FSN–PC), 7% (PC–FSN) and 7% (reciprocally connected pairs). In reciprocally connected pairs, CCh effects were tested only in one synapse, i.e. either the PC–FSN or the FSN–PC connection. In connected pairs, unless otherwise indicated, presynaptic APs were evoked by brief current pulses in accordance with the following stimulation protocol: a single AP was evoked every 7.5 s (0.13 Hz) in the presynaptic cell at least five times to estimate the baseline unitary (u)IPSC (or unitary (u)EPSC) amplitude, then a stimulus train protocol was used. For FSN–PC connections, the stimulus train protocol consisted of APs evoked in the FSN at a baseline frequency of 5 Hz. Every 7.5 s, the stimulus frequency was switched from 5 Hz baseline to a 1.5 s-long train of stimuli at 25, 40 or 60 Hz, after which the 5 Hz baseline stimulation was resumed. The stimulation with 5 Hz baseline +25–60 Hz trains was repeated 30–40 times, and then FSN stimulus frequency was returned to 0.13 Hz for at least 1.5 min, after which CCh was bath-applied (10 μM). Stimulus frequency was maintained at 0.13 Hz for 10 min in the presence of CCh, and then the stimulus train protocol was repeated to test the effects of CCh. For PC–FSN connections, the stimulus train protocol was similar to that described above, except that PC APs were evoked at a baseline frequency of 2.5 Hz, and every 7.5 s stimulation was switched from 2.5 Hz baseline to a 1.5 s-long train of 7.5, 10 or 20 Hz frequency. The 2.5 Hz baseline +7.5–20 Hz train stimulation was repeated 30–40 times. The first epoch of the stimulus trains was excluded from the analysis to allow reaching a steady-state response to the 5 Hz or 2.5 Hz baseline stimulation. In each connected pair, only one presynaptic stimulus train frequency (7.5, 10, 20, 25, 40 or 60 Hz) was tested. To calculate uIPSC and uEPSC amplitudes, 30–40 traces were averaged (failures included) and uIPSC and uEPSC amplitudes were measured as the difference between peak amplitudes and baselines detected within a time window placed between 5 ms and 3 ms preceding the first event in the presynaptic stimulus train.
For the analysis of failures of synaptic transmission, the voltage-clamp recordings were digitally filtered at 1 kHz (low pass). Individual responses were considered a success in synaptic transmission if the amplitude of the response was greater than three times the standard deviation of the baseline current before the response (Kraushaar & Jonas, 2000; Kobayashi et al. 2008). The mean baseline current and its standard deviation were computed by averaging the postsynaptic current in a 2 ms time window starting 3 ms before the presynaptic AP. The postsynaptic response amplitude was computed by subtracting the baseline current from the peak value of the postsynaptic current, detected within a time window placed between 1.5 ms and 15 ms after the brief current pulse in the presynaptic neuron. To confirm the efficiency of this method to discriminate failures from successes in synaptic transmission, as depicted in Fig. 5A, we averaged multiple single traces (thinner traces in Fig. 5A) in which a failure was detected in the response to the same stimulus position in the train (second stimulus in Fig. 5A). We found that the average trace (thicker trace in Fig. 5A) similarly indicated an absence of a postsynaptic event in response to the second stimulus.
Figure 5. The effects of carbachol (CCh) on unitary (u)IPSC failure rate at fast-spiking interneuron (FSN)–pyramidal cell (PC) synapses during gamma frequency activity are consistent with presynaptic modulation.
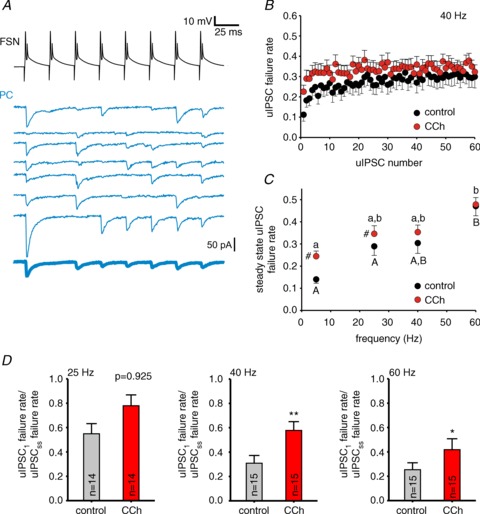
A, representative traces illustrating failure rate analysis in FSN–PC pairs. The top-most trace shows APs in a FSN during the first eight stimuli of a 40 Hz stimulus train. The lower traces (thin continuous traces) show uIPSCs in the postsynaptic PC for 7 cases in which we detected a transmission failure in the second uIPSC. The trace at the bottom (thick continuous trace) is the average of the traces above, which confirms the absence of uIPSC in response to the second stimulus. B, uIPSC failure rate during the trains at 40 Hz in control and with 10 μM CCh. Data are mean ± SEM, n= 15 pairs. C, the uIPSC failure rate at the steady-state from experiments as in B for 25, 40 or 60 Hz trains in control and 10 μM CCh. The steady-state failure rate values at 5 Hz are the failure rates for the first uIPSC at 25, 40 or 60 Hz. For 25, 40 and 60 Hz the steady-state failure rate was computed by averaging the failures for the last four uIPSCs in the trains. Results are shown as mean ± SEM, #P < 0.05 control vs. CCh at the same frequency, For control values, individual groups not sharing the same upper case letter are significantly different, P < 0.05 post hoc comparisons with Tukey test. For CCh, individual groups not sharing the same lower case letter are significantly different, P < 0.05 post hoc comparisons with Tukey test. RM-ANOVA (control vs. CCh: F1,75= 14.265, P < 0.001; control vs. frequency: F3,75= 4.807, P= 0.04; CCh vs. frequency: F3,75= 2.752, P= 0.048). D, a ratio of relative failure rates during the trains (failure rate for uIPSC1 over the failure rate for the steady-state uIPSC) was calculated for experiments in the absence (control) and presence of 10 μM CCh (CCh) for 25, 40 and 60 Hz trains. Data are shown as mean ± SEM, *P < 0.05, **P < 0.01 (paired t test).
Extracellular stimulation
When cell-attached recordings were used to record AP firing in PCs, the ability of the recorded neurons to initiate APs was monitored at the beginning and the end of the experiment by suprathreshold stimulation of synaptic inputs. Focal stimulation electrodes were fabricated with theta-type capillary glass pulled to an open tip diameter of ∼3–5 μm and filled with oxygenated ACSF. Silver wires inserted into the theta glass were connected to a stimulus isolation unit (World Precision Instruments) commanded by TTL pulses. Stimulation electrodes were typically placed within 50–100 μm of the soma of the recorded neuron. Stimuli of 100 μs duration had current intensity adjusted (10–100 μA) to produce APs.
Statistical analysis
Results are expressed as mean ± SEM. The statistical analysis was performed using SPSS 20 (IBM). The significance of differences between group means was determined using Student's t test, paired Student's t test, repeated measurements (RM) one-way ANOVA, RM two-way ANOVA, Pearson's correlation test, Kolmogorov– Smirnov test or Chi-square test, as indicated in each case. Differences between group means were considered significant if P < 0.05. The results of statistical comparison of differences between group means are shown in the text and/or in the figure legend of each figure.
Results
Cholinergic receptor activation stimulates pyramidal neuron firing
During PING oscillations, the firing of PCs is driven by an asynchronous excitatory input and then synchronized by feedback inhibition from FSNs (Whittington et al. 2000, 2011; Tiesinga & Sejnowski, 2009). Therefore, cholinergic neuromodulation may contribute to the production of gamma oscillations by driving PC firing. To test whether cholinergic receptor activation stimulates PC firing in layer 3 of mouse mPFC, we determined the effects of 10 μM CCh. In 71% of the PCs tested (15 of 21), bath-applied CCh produced a significant subthreshold depolarization, whereas in the absence of CCh, the PC membrane potential showed a significantly smaller change after a similar period of recording (Fig. 1A; Table 1).
Table 1.
CCh-induced depolarization of PCs and FSNs
| CCh | ||||
|---|---|---|---|---|
| Control | Non-firing | Firing | ||
| PCs | RMPi (mV) | −75.1 ± 2.9 (12) | −71.1 ± 0.9 (15) | −70.1 ± 1.3 (6) |
| Depolarization (mV) | 0.7 ± 0.6 (12) | 3.2 ± 0.6 (15)* | 11.0 ± 0.7 (6)*,† | |
| FSNs | RMPi (mV) | −72.9 ± 1.2 (18) | −71.2 ± 3.3 (23) | — |
| Depolarization (mV) | 0.3 ± 0.3 (18) | 1.9 ± 0.5 (23)* | — | |
CCh, carbachol; FSN, fast-spiking interneuron; PC, pyramidal cell; RMPi, initial resting membrane potential. In the case of firing PCs the depolarization change was measured immediately before the onset of AP firing. *P < 0.05 vs. control, †P < 0.05 vs. non-firing PCs under CCh, the sample size is in parentheses.
In the remaining 29% of the PCs tested (6 of 21 cells), CCh produced a suprathreshold depolarization that induced AP firing (Fig. 1B) at a frequency of 8.7 ± 1.6 Hz (measured during the first 10 s of firing). PCs with CCh-induced firing had a resting potential similar to that of non-firing PCs (P= 0.604, t test; Table 1); however, the depolarization observed 0.5 s before the onset of CCh-evoked firing was significantly larger than the depolarization in non-firing PCs (Table 1). Furthermore, firing was not observed in any of 28 PCs tested when injecting hyperpolarizing current through the recording pipette to prevent the CCh-induced depolarization (P < 0.01 vs. CCh with no current injection, Chi-square test), suggesting that CCh induces firing via suprathreshold depolarization in some PCs. Importantly, the input resistance, membrane time constant, AP amplitude, AP width, AP threshold, adaptation ratio and afterhyperpolarization amplitude before CCh application did not differ between PCs that fired APs with bath-applied CCh versus those that did not (Supplemental Table S1).
The suprathreshold stimulation by CCh of only a fraction of PCs may be caused in part by attenuation of the excitatory effects of CCh by intracellular effects of the pipette solution or capacitive load by the recording electrode under whole-cell recording conditions. To test this possibility, we examined the effects of CCh in cell-attached recordings and found that, whereas strong synaptic stimulation evoked APs in 29 of 29 PCs tested (Fig. 1C), CCh elicited firing in 9 of the 29 PCs (Fig. 1C), a proportion not significantly different from that observed in whole-cell recordings (Fig. 1D; P= 0.752, Chi-square test). Moreover, the time course of CCh-induced PC firing was similar in whole-cell and cell-attached conditions (Fig. 1E). Therefore, whole-cell recording conditions do not seem to significantly alter the excitatory effects of CCh.
Bath application of CCh increases the frequency of spontaneous IPSCs in PCs (Kawaguchi, 1997; Martin et al. 2001; Yoshino et al. 2011), an effect that may inhibit AP initiation and decrease the proportion of PCs with CCh-induced firing. However, in the presence of the GABAA receptor antagonist gabazine (10 μM), in 18 of 26 PCs CCh produced a subthreshold depolarization (4.5 ± 0.9 mV, n= 18) that was not significantly different from than that observed in the absence of gabazine (P= 0.257, t test). Moreover, CCh evoked APs in 30.8% (8 of 26) of the PCs, a proportion nearly identical to that observed without gabazine (P= 0.904, Chi-square test). Therefore, inhibitory effects of IPSPs do not affect CCh-induced firing in mPFC PCs.
During gamma rhythms, FSNs fire tightly synchronized with the population oscillation (Bragin et al. 1995; Hajos et al. 2004; Dugladze et al. 2012). Gamma oscillation-associated FSN firing may originate in part from direct effects of cholinergic modulation on the FSNs. However, whether ACh directly activates FSN firing remains poorly understood. mAChR activation hyperpolarized FSNs in some studies (Xiang et al. 1998), whereas other studies showed little or no change of the FSN membrane potential with muscarinic signalling (Kawaguchi, 1997; Gulledge et al. 2007; Kruglikov & Rudy, 2008; Cea-del Rio et al. 2010; Szabo et al. 2010). We found that CCh produced in FSNs a small but significant depolarization compared with the changes of membrane potential observed in the absence of CCh (Table 1). However, contrasting with its effects on PCs, CCh did not elicit firing in any of the 23 FSNs tested (P < 0.05, Chi-square test; Fig. 2Aa, b). The stronger effect of CCh on the excitability of PCs versus FSNs is in agreement with the PING model, in which PCs receive an external drive and FSNs are driven mainly by synaptic input from the PCs (Whittington et al. 2000, 2011; Borgers & Kopell, 2003; Tiesinga & Sejnowski, 2009). Additionally, because FSNs typically fire APs during gamma oscillations, the lack of FSN firing in the presence of CCh is consistent with previous studies showing that bath-applied CCh, alone, is not sufficient to produce gamma activity in neocortical slices.
Figure 2. Cholinergic modulation induced a small depolarization and increased the number of spontaneous (s)EPSPs in FSNs.
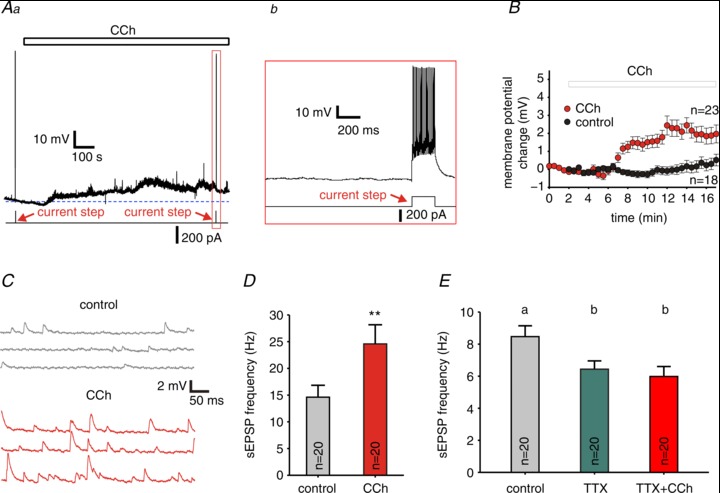
Aa, representative trace of recordings from a FSN, the continuous line below the trace indicates the timing of test current steps, the open bar above the trace shows the timing of carbachol (CCh) application, and the dashed line shows the baseline membrane resting potential. Ab, expanded region of the trace in a, indicated by the vertical rectangle. B, changes in the membrane potential versus time for FSNs in control conditions (n= 18) and in the presence of 10 μM CCh (n= 23), the open bar indicates CCh bath application. Data are mean ± SEM. C, representative traces of recordings from FSNs showing EPSPs in control conditions and in the presence of 10 μM CCh. D, sEPSP frequency in the presence (CCh) and absence (control) of 10 μM CCh. Data are means ± SEM, n= 20, **P < 0.01 (paired t test). E, sEPSP frequency in control conditions and in the presence of 1 μM TTX or 1 μM TTX + 10 μM CCh. Data are means ± SEM, n= 20. RM ANOVA indicated significant differences between group means; F2,38= 14.118, P < 0.001. Individual groups not sharing the same letter are significantly different, P < 0.05 post hoc comparisons with the Tukey test.
In PING models interneuron firing is mainly driven by phasic input from local PCs. Thus, the stimulation of PC firing by CCh (Fig. 1) may contribute to gamma oscillation generation if it involves PCs synaptically connected onto FSNs, thus producing EPSPs in FSNs in an AP-dependent manner. Consistent with this prediction, bath-application of CCh increased the EPSP frequency by 68% in FSNs (Fig. 2C and D; P < 0.01, paired t test), and this effect was reverted by the mAChR antagonist ipratropium (10 μM; Supplemental Fig. S1). Moreover, the CCh-induced increase in EPSP frequency was prevented by blocking APs with 1 μM TTX (Fig. 2E; F2,38= 1.291, P= 0.6356, by RM ANOVA). Although we cannot rule out that TTX blocked ectopic AP generation (Dugladze et al. 2012) or subthreshold depolarization (Shu et al. 2006) in distal PC axons that normally enhance EPSP frequency, the TTX-sensitivity of the increase in EPSP frequency by CCh likely is produced by blockade of CCh-induced AP firing in local PCs that provide excitation onto the FSNs, as in PING models.
Cholinergic modulation equalizes synaptic strength at connections between PCs and FSNs during repetitive presynaptic cell firing
FSN–PC inhibitory synapses are crucial in PING oscillations, as they provide the feedback inhibition of PCs that generates gamma band synchrony. Importantly, in recordings from synaptically connected pairs, we found that repetitive presynaptic firing at gamma band frequency produced short-term depression of the uIPSCs at FSN–PC synapses in mPFC layer 3 (Fig. 3A), as shown previously in other cortical regions (Galarreta & Hestrin, 1998; Reyes et al. 1998; Ali et al. 2001). Short-term depression during repetitive firing of each FSN at gamma frequency would produce uIPSCs of progressively smaller amplitudes. If so, then the strength of the compound IPSC generated by the FSN network on each PC would decrease toward the end of the gamma oscillation episodes, consequently reducing the oscillation power. Importantly, if, as suggested by several lines of evidence, cholinergic modulation is required for gamma oscillation production (Munk et al. 1996; Cape et al. 2000; Rodriguez et al. 2004, 2010; Janiesch et al. 2011), then repetitive firing of FSNs at gamma frequency may be at all times coincident with activation of the presynaptic mAChRs found at FSN–PC synapses (Hajos et al. 1998; Freund & Katona, 2007). Because short-term plasticity is mainly a presynaptic phenomenon (Regehr, 2012), one possibility is that the effects of presynaptic mAChR activation attenuate short-term depression thus maintaining uIPSC strength throughout oscillation episodes. In order to compare the effects of repetitive presynaptic firing in the presence versus absence of CCh, in FSN–PC connected pairs, we stimulated the presynaptic FSN repetitively at 25, 40 or 60 Hz, in 1.5 s-long episodes that had duration similar to the duration of gamma oscillation episodes observed in the rodent mPFC in vivo (Ruiz-Mejias et al. 2011; Massi et al. 2012).
Figure 3. Cholinergic modulation reduces the unitary (u)IPSC amplitude at fast-spiking interneuron (FSN)–pyramidal cell (PC) connections.
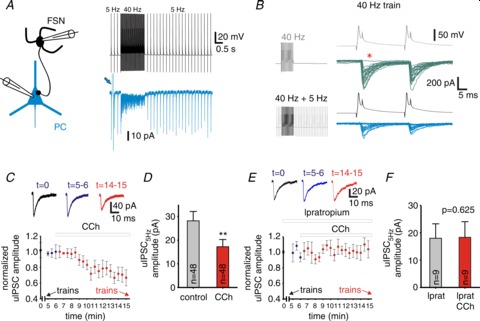
A, representative traces of recordings in a synaptically connected FSN–PC pair. Membrane potential in the presynaptic FSN and membrane current in the postsynaptic PC are shown from an experiment in which the FSN was stimulated with a protocol including baseline stimulation at 5 Hz and a 1.5 s episode of 40 Hz stimulation. The traces are averages of 40 repetitions. The arrow marks the response to a voltage step used to monitor the series resistance during voltage-clamp recording. B, representative traces illustrating the effects of baseline stimulation at 5 Hz on uIPSCs in a connected FSN–PC pair. The FSN was stimulated with a 40 Hz train in the absence (grey) or presence (black) of 5 Hz baseline stimulation, as indicated in the left panel. The right panel shows the first two uIPSCs evoked by a 40 Hz train without (upper traces) or with (lower traces) 5 Hz baseline stimulation. The asterisk indicates a single failure of synaptic transmission, shown are 25 superimposed consecutive traces. C, uIPSC amplitude (relative to the initial uIPSC amplitude) for events evoked at 0.13 Hz in control and during bath application of 10 μM carbachol (CCh). Each symbol is the average of four consecutive uIPSCs ± SEM. The arrows indicate the times when the stimulus train protocols were applied (in the absence and presence of CCh, respectively). Traces in the top panel show representative recordings of uIPSCs in a PC at t= 0 (control), t= 5–6 min (control) and t= 14–15 min (CCh). See Results and Methods for further details. D, uIPSC amplitudes in FSN–PC synapses in the absence and presence of 10 μM CCh at 5 Hz stimulation measured on the first uIPSC of the 25, 40 and 60 Hz trains. **P < 0.01 paired t test. E, uIPSC amplitude (relative to the initial uIPSC amplitude) for events evoked at 0.13 Hz during bath application of 10 μM ipratropium, at t= 6 min 10 μM CCh was added to the superfusion medium (ipratropium was included in the perfusion medium at least 15 min before the onset of CCh bath application). Each symbol is the average of four consecutive uIPSCs from 9 pairs ± SEM. The arrows indicate the times when the stimulus train protocols were applied (in the absence and presence of CCh, respectively). Traces in the top panel show representative recordings of uIPSCs in a PC at t= 0 (control), t= 5–6 min (control) and t= 14–15 min (CCh). F, uIPSC amplitudes in FSN–PC synapses in the presence of 10 μM ipratropium or 10 μM ipratropium + 10 μM CCh at 5 Hz stimulation measured on the first uIPSC of 40 Hz trains. P= 0.625, paired t test.
To mimic the effects on synaptic transmission of gamma activity episodes that, as observed in vivo, arise from some baseline activity level as opposed to an inactive state, we stimulated the presynaptic FSNs at a baseline frequency of 5 Hz, and every 7.5 s delivered stimulus trains (Fig. 3A and B). The 5 Hz baseline stimulation had a significant impact on FSN–PC transmission, as the amplitude of the first uIPSC in the gamma frequency trains (uIPSC1) was reduced by 40 ± 8% compared with the absence of baseline stimulation. Moreover, whereas the failure rate for uIPSC1 was virtually zero without baseline stimulation, it increased to 14.0 ± 1.8% with 5 Hz baseline stimulation (Fig. 3B). These somewhat closer to physiological conditions were used to study short-term plasticity of uIPSCs induced by stimulus trains under cholinergic modulation.
To test whether the uIPSCs remained stable throughout the stimulus protocol, we measured the amplitude of uIPSCs produced by single APs evoked in the presynaptic FSN at 0.13 Hz before and after stimulation with trains in control conditions. Next, we monitored the effects of CCh application on the uIPSCs at 0.13 Hz before testing the effects of stimulus trains in the presence of CCh. As illustrated in Fig. 3C, relative to its value at the beginning of the experiment (t= 0), the uIPSC amplitude remained stable after the first series of stimulus trains (t= 5–6 min), showing the absence of long-term changes in uIPSC amplitude. After about 4 min of CCh application (10 μM), the 0.13 Hz uIPSC amplitude decreased, reaching a nearly steady-state reduction of 30 ± 7.4% by 7–8 min in the presence of CCh, as reported previously in hippocampus and insular cortex (Hefft et al. 2002; Yamamoto et al. 2010; Szabo et al. 2010). After 10 min in the presence of CCh, stimulation with trains was resumed, revealing that CCh reduced the amplitude of uIPSCs evoked at basal 5 Hz baseline frequency by 29.4 ± 6.2% (Fig. 3D; P < 0.01 paired t test; see also Fig. 4D). The CCh-dependent reduction of the uIPSC amplitude was mediated by mAChR activation, as it was prevented by bath-applying 10 μM ipratropium at least 15 min prior to CCh (Fig. 3E and F). Importantly, we found that for stimulus trains at gamma frequency (40 and 60 Hz), short-term uIPSC depression was less pronounced with CCh than in the absence of CCh (Fig. 4A–C). The reduction in short-term depression was reflected in significant changes in the amplitude of the uIPSCs at steady-state (uIPSCSS) relative to uIPSC1 (Fig. 4A–C) and was effectively blocked by ipratropium (Fig. 4E). As a consequence of the reduced depression, with CCh the uIPSCSS amplitude, relative to 5 Hz baseline, was independent of stimulus frequency (Fig. 4D; F3,86= 2.008, P= 0.119, RM ANOVA), whereas in the absence of CCh the stimulation frequency had a highly significant effect (Fig. 4D; F3,86= 13.331, P < 0.001, RM ANOVA). These results indicate that, by reducing short-term depression, activation of mAChRs by cholinergic modulation equalizes the strength of uIPSCs produced by FSN activity at frequencies within the gamma band, while reducing the uIPSC amplitude at lower firing frequency.
Figure 4. Cholinergic modulation decreases relative unitary (u)IPSC depression by presynaptic gamma frequency activity at FSN–PC connections.
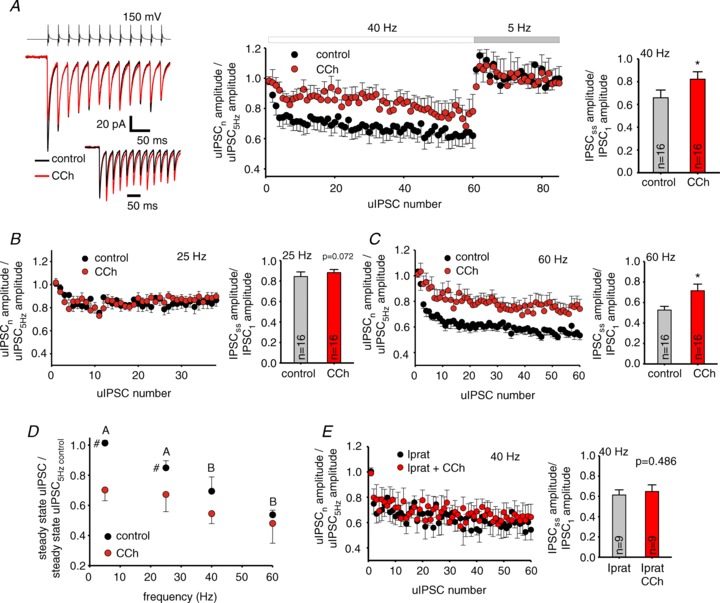
A, left, representative traces of a FSN–PC connected pair in the presence (carbachol, CCh) and absence (control) of 10 μM CCh. The inset shows the traces standardized to the first uIPSC amplitude. Centre, a plot of relative uIPSC amplitude during 40 Hz trains. The relative uIPSC amplitudes were obtained by dividing the amplitude of each uIPSC in the train by the average amplitude of four uIPSCs evoked during 5 Hz baseline stimulation. The plot also shows relative uIPSC amplitude at 5 Hz shortly after the 40 Hz train. Data are shown as mean ± SEM, n= 16 pairs. Right, relative depression during the stimulus trains quantified using a ratio between steady-state uIPSC amplitude and the amplitude of the first uIPSC of the train. The ratio was compared between the absence (control) and presence of 10 μM CCh (CCh). Data are mean ± SEM, *P < 0.05 (paired t test). B, C, left, plots of relative uIPSC amplitude as shown in A, in this case for 25 Hz (B, n= 16 pairs) or 60 Hz trains (C, n= 16 pairs). The period of 5 Hz stimulation immediately following 25 or 60 Hz trains is not shown. Each connected pair was tested with either 25, 40 or 60 Hz, no pairs were tested with more than one frequency.Right, relative depression during the stimulus trains as shown in A. Data are mean ± SEM, *P < 0.05 (paired t test). D, the uIPSC amplitude at the steady-state of stimulus trains relative to its value at 5 Hz baseline was plotted as a function of stimulus train frequency, in data from the experiments shown in A–C. In the absence of CCh (control), stimulus frequency had a significant effect (F3,86= 13.331, P < 0.001), whereas with 10 μM CCh (CCh) the effects of stimulus frequency were not significant (F3,86= 2.008, P= 0.119). Accordingly, RM two-way ANOVA showed a significant effect of CCh (F1,86= 16.715, P < 0.001). Results are mean ± SEM, #P < 0.05 control vs. CCh at the same frequency. For control values, individual groups not sharing the same upper case letter are significantly different, P < 0.05 post hoc comparisons with Tukey test. E, left, plots of relative uIPSC amplitude as shown in A, in the presence of 10 μM ipratropium (n= 9 pairs). The period of 5 Hz stimulation immediately following the 40 Hz trains is not shown. Right, relative depression during the stimulus trains as shown in A. Data are mean ± SEM, P= 0.486 (paired t test).
Consistent with a presynaptic mechanism of depression at FSN–PC connections, the probability of uIPSC failures increased during stimulus trains (Fig. 5A and B; Supplemental Fig. S2 and S3), and the magnitude of short-term depression of the uIPSC amplitude was positively correlated with the increase in failure rate for uIPSCSS relative to uIPSC1 (Pearson's r= 0.6505, P < 0.001). In the presence of CCh, the steady-state failure rate was significantly higher during 5 Hz or 25 Hz stimulation (5 Hz: F1,75= 20.602, P < 0.001, RM ANOVA; 25 Hz: F1,75= 5.571, P < 0.05, RM ANOVA), but did not differ between the presence or absence of CCh at 40 or 60 Hz stimulation (Fig. 5B and C; see also Supplemental Fig. S2). Consequently, stimulus frequency strongly affected the failure probability in the absence of CCh (F3,75= 4.807, P= 0.004, RM ANOVA; Fig. 5C), but had weak effects on failure rate in the presence of CCh (F3,75= 2.752, P= 0.048, RM ANOVA; Fig. 5C).
To additionally investigate if CCh modulates synaptic depression via presynaptic mechanisms, we determined whether CCh affected the increase in failure rate associated with synaptic depression in the absence of CCh. To test this possibility, we computed a ratio between the failure rates for uIPSC1 and uIPSCss. If CCh reduces synaptic depression in part presynaptically, it should increase uIPSC1/uIPSCss failure rate ratio. Figure 5D shows that the uIPSC1/uIPSCss ratio of failure rates was higher in the presence of CCh at 40 and 60 Hz (P < 0.05, paired t test), but not at 25 Hz (P= 0.925, paired t test). Therefore, equalization of uIPSCs by CCh during presynaptic FSN firing at gamma frequency is at least in part due to a tuning of synaptic depression via presynaptic mechanisms.
Similar to FSN–PC synapses, in various cortical regions excitatory PC–FSN synapses display presynaptically mediated short-term depression during repetitive PC firing (Ali et al. 1998; Galarreta & Hestrin, 1998; Reyes et al. 1998). To evaluate the effects of stimulus trains on PC–FSN synapses in mPFC, in synaptically connected PC–FSN pairs we stimulated the presynaptic PC at a baseline frequency of 2.5 Hz. During gamma oscillation episodes, PCs fire phase-locked to the oscillation cycle; however, they do not fire in every cycle, showing a mean firing rate below the gamma band (Hajos et al. 2004; Oren et al. 2006). Therefore, we stimulated the PCs with 1.5 s-long trains of 7.5, 10 and 20 Hz. These stimulus trains produced short-term depression of the uEPSCs, which was associated with an increase in failure rate consistent with a presynaptic mechanism (Fig. 6A). Similar to that observed in FSN–PC synapses (Fig. 3C), the amplitude of uEPSCs evoked by single stimuli at 0.13 Hz remained stable before and after the first application of stimulus trains (t= 0 and t= 5–6 min in Fig. 6B). Because phasic excitation from local PCs is essential to drive FSNs in the PING model, cholinergic modulation may contribute to PING oscillations by shaping short-term depression at PC–FSN connections. We found that after 7–8 min of CCh bath application, the amplitude of uEPSCs evoked by 0.13 Hz presynaptic stimuli was reduced by 35.3 ± 8% (Fig. 6B). Then, the stimulus trains were resumed, revealing that the amplitude of uEPSCs evoked at basal 2.5 Hz stimulation frequency was 34.8 ± 5.2% smaller in the presence of CCh (Fig. 6C; P < 0.01 paired t test, see also Fig. 7D). The CCh-dependent reduction in the uEPSC amplitude was blocked by bath-applying 10 μM ipratropium at least 15 min prior to CCh application (Fig. 6D and E). In addition, CCh significantly reduced the relative uEPSC depression at 10 and 20 Hz by 24% and 53%, respectively (Fig. 7A–C), and this effect was blocked by the mAChR antagonist ipratropium (Fig. 7E). Consequently, whereas in the absence of CCh stimulus frequency had a highly significant effect on the steady-state uEPSC (uEPSCss) amplitude (F3,40= 50.537, P < 0.001, RM ANOVA), in the presence of CCh the frequency dependence of depression was weaker (CCh: F3,40= 4.009, P= 0.014, RM ANOVA), as shown in Fig. 7D.
Figure 6. Cholinergic modulation decreases the amplitude of unitary (u)EPSCs at pyramidal cell (PC)–fast-spiking interneuron (FSN) connections.
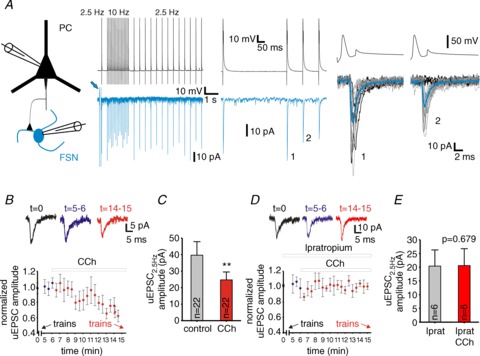
A, representative traces of recordings in a synaptically connected PC–FSN pair. Traces in the left panel are membrane potential in the presynaptic PC and membrane current in the postsynaptic FSN, from an experiment in which the PC was stimulated with a protocol including baseline stimulation at 2.5 Hz and a 1.5 s episode of 10 Hz stimulation. The traces are averages of 35 repetitions. The arrow marks the response to a voltage step used to monitor the series resistance during voltage-clamp recording. The traces in the centre panel are a zoom-in of the beginning of the 10 Hz train shown on the left. The right panel shows superimposed consecutive traces of the first two uIPSCs of the 10 Hz train. The thin grey traces are cases in which both stimuli produced a uEPSC. The thin black traces are cases in which a failure of synaptic transmission was found in the response to the second stimulus. The thick traces show the average of all individual recordings. B, uEPSC amplitude (relative to the uIPSC amplitude in control conditions) for events evoked at 0.13 Hz in control and during bath application of 10 μM carbachol (CCh). Data are the average of four consecutive uEPSCs ± SEM. The arrows indicate the times where the stimulation train protocols were applied (in the absence and presence of CCh). Traces in the top panel show the representative recordings of uEPSCs at t= 0 (control), t= 5–6 min (control) and t= 14–15 min (CCh). See Methods for further details. C, uEPSC amplitudes in PC–FSN synapses in the absence and presence of 10 μM CCh at 2.5 Hz stimulation. **P < 0.01 paired t test (uEPSC1 of the 7.5, 10 and 20 Hz trains were used). D, uIPSC amplitude (relative to the initial uIPSC amplitude) for events evoked at 0.13 Hz during bath application of 10 μM ipratropium, at t= 6 min 10 μM CCh was added to the superfusion medium (ipratropium was included in the perfusion medium at least 15 min before the onset of CCh bath application). Each symbol is the average of four consecutive uEPSCs from 6 pairs ± SEM. The arrows indicate the times when the stimulus train protocols were applied (in the absence and presence of CCh, respectively). The traces in the top panel show representative recordings of uEPSCs in a FSN at t= 0 (control), t= 5–6 min (control) and t= 14–15 min (CCh). E, uEPSC amplitudes in PC–FSN synapses in the presence of 10 μM ipratropium or 10 μM ipratropium + 10 μM CCh at 2.5 Hz stimulation measured on the first uEPSC of 10 Hz trains. P= 0.679 paired t test.
Figure 7. Cholinergic modulation decreases relative unitary (u)EPSC depression at PC–FSN connections.
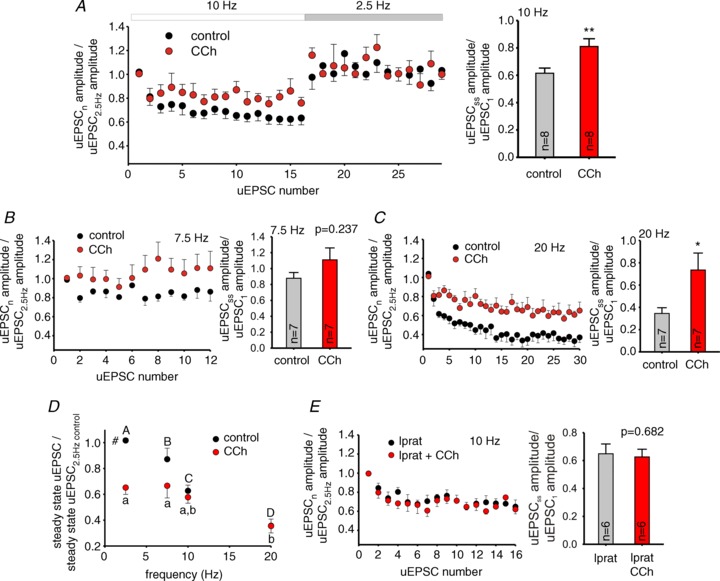
A, left, relative uEPSC amplitudes during 10 Hz trains. The relative uEPSC amplitudes were obtained by dividing the amplitude of each uEPSC in the train by the average amplitude of three uEPSCs evoked during 2.5 Hz baseline stimulation. The plot also shows relative uEPSC amplitude at 2.5 Hz shortly after the 10 Hz train. Symbols represent uEPSCs recorded in control conditions (control) and uEPSCs in the presence of 10 μM carbachol (CCh). Data are shown as mean ± SEM, n= 8 pairs. Right, relative depression during the stimulus trains quantified using a ratio between steady-state uEPSC amplitude and the amplitude of the first uEPSC of the train. The ratio was compared between the absence (control) and presence of 10 μM CCh (CCh). Data are mean ± SEM, **P < 0.01 (paired t test). B, C, left, relative uEPSC amplitudes in the absence and presence of CCh for 7.5 Hz (B, n= 7) and 20 Hz trains (C, n= 7), results are mean ± SEM. The period of 2.5 Hz stimulation immediately following 7.5 or 20 Hz trains is not shown. Right, relative depression during the stimulus trains as shown for A. Data are mean ± SEM, *P < 0.05. D, the uEPSC amplitude at the steady-state of stimulus trains relative to its value at 2.5 Hz baseline was plotted as a function of stimulus train frequency, in data from the experiments shown in A–C. In the absence of CCh (control), stimulus frequency had a highly significant effect (F3,40= 50.537, P < 0.001), whereas with 10 μM CCh (CCh) the effects of stimulus frequency were weaker (F3,40= 4.009, P= 0.014). Accordingly, the RM two-way ANOVA shows a significant effect of CCh (F1,40= 11.097, P= 0.002). Results are mean ± SEM, #P < 0.05 control vs. CCh at the same frequency. For control values, individual groups not sharing the same upper case letter are significantly different, P < 0.05 post hoc comparisons with Tukey test. For CCh, individual groups not sharing the same lower case letter are significantly different, P < 0.05 post hoc comparisons with Tukey test. E, left, plots of relative uIPSC amplitude as shown in A, in the presence of 10 μM ipratropium (n= 6 pairs). The period of 2.5 Hz stimulation immediately following the 10 Hz trains is not shown. Right, relative depression during the stimulus trains as shown in A. Data are mean ± SEM, P= 0.682 (paired t test).
The effects of CCh on short-term uEPSC depression could be explained at least in part by presynaptic effects, as CCh increased the uEPSC1/uEPSCss ratio of failure rates for stimulus trains at 10 Hz (38%, P= 0.037, paired t test; Fig. 8A and C) and 20 Hz (67%, P= 0.035, paired t test; Fig. 8C; Supplemental Fig. S4). Consequently, the steady-state failure rate showed frequency dependence only in control conditions (Fig. 8B; control: F3,38= 3.183, P= 0.035; CCh: F3,38= 0.658, P= 0.583, RM ANOVA). Our results suggest that during repetitive PC activity, CCh equalizes uEPSC strength across stimulus frequencies via a mechanism that involves modulation of failure rate, suggesting that CCh-sensitive presynaptic receptors are found at the PC–FSN cell synapses.
Figure 8. The effects of carbachol (CCh) on the unitary (u)EPSC failure rate at PC–FSN synapses during gamma frequency activity are consistent with presynaptic cholinergic modulation.
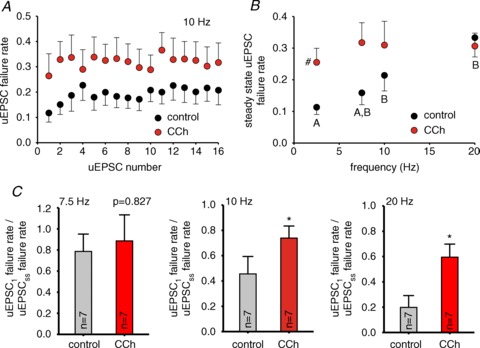
A, uEPSC failure rate during the trains at 10 Hz in control and 10 μM CCh. Data are mean ± SEM (n= 7). B, uEPSC failure rate at the steady-state from experiments as shown in A for 7.5, 10 and 20 Hz trains in control and 10 μM CCh. The steady-state failure rate values at 2.5 Hz are the failure rates of the first uEPSC of the trains. For 7.5, 10 and 20 Hz the steady-state failure rate was computed by averaging the failures for the last three uEPSCs in the trains. Results are mean ± SEM, #P < 0.05 control vs. CCh at the same frequency. For control values, individual groups not sharing the same upper case letter are significantly different, P < 0.05 post hoc comparisons with Tukey test. RM-ANOVA (control vs. CCh: F1,38= 7.754, P= 0.008; control vs. frequency: F3,38= 3.183, P= 0.035; CCh vs. frequency: F3,38= 0.658, P= 0.583).C,relative failure rate during the trains (failure rate of the first uEPSC of the train over the uEPSC failure rate in the steady-state) in the absence (control) and presence of 10 μM CCh (CCh) for7.5, 10 and 20 Hz trains. Data are shown as mean ± SEM, *P < 0.05 (paired t test).
Cholinergic receptor activation potentiates the firing response of PFC neurons to oscillatory inputs
We found that CCh reduced short-term depression at FSN–PC and PC–FSN connections, thus equalizing the unitary synaptic current amplitude, possibly serving to maintain a similar input strength throughout PING oscillation episodes. However, this effect was associated with an increase in failure probability that reduced unitary synaptic current amplitude. Thus, a key question is whether additional CCh effects may contribute to generating the large rhythmic IPSCs and EPSCs observed during network gamma oscillations (Mann et al. 2005; Oren et al. 2006; Atallah & Scanziani, 2009). CCh increases the intrinsic excitability of hippocampal and cortical neurons (Tang et al. 1997; Cea-del Rio et al. 2011; Dasari & Gulledge, 2011; Santini et al. 2012), including in the mPFC (Gulledge et al. 2009; Dembrow et al. 2010). Thus, CCh may increase the number of neurons recruited in each oscillation cycle and that contribute to the compound synaptic currents elicited in the postsynaptic targets, compensating for the reduction of the unitary synaptic currents.
Whereas CCh potentiates mPFC neuron firing elicited by rectangular depolarizing currents (Gulledge et al. 2009; Dembrow et al. 2010), during gamma oscillations, PCs and FSNs are driven by gamma wave-like changes in membrane potential (Penttonen et al. 1998; Buhl et al. 1998; Atallah & Scanziani, 2009; Buzsaki & Wang, 2012) caused by rhythmic inhibitory and excitatory synaptic currents (Mann et al. 2005; Oren et al. 2006; Atallah & Scanziani, 2009). Oscillatory versus rectangular inputs differentially activate voltage-dependent conductances that regulate neuronal excitability (Volgushev et al. 1998). Moreover, cell type-specific intrinsic membrane properties determine a different firing rate response to oscillatory inputs in PCs and FSNs (Otte et al. 2010). Therefore, to determine if CCh modulation of mPFC neuron excitability increases the probability of firing in each gamma oscillation cycle, we stimulated mPFC neurons using a gamma wave protocol that combined injection of a 50 Hz sinusoidal current wave of constant subthreshold strength with rectangular current steps of progressively larger amplitude, to drive the cells to spike threshold (Fig. 9A and B).
We found that with weaker gamma wave stimuli (smaller rectangular current steps), mPFC neurons fired spikes once per stimulus cycle and in a relatively small fraction of the cycles (Fig. 9A–C). As the stimulus strength increased (larger rectangular current steps), PCs and FSNs similarly fired a single spike per cycle, but the proportion of cycles with APs increased (Fig. 9A–C). Moreover, in both PCs and FSNs, the spike timing shifted to an earlier phase of the gamma wave stimulus as the stimulus strength increased, whereas the standard deviation of the spike timing remained fairly small and did not change significantly with stimulus strength (Supplemental Fig. S6). As shown in Fig. 9D, the rheobase (minimum step current that produced firing) was higher in FSNs (122 ± 13 pA, n= 22) than PCs (59 ± 7 pA, n= 28, P < 0.001, t test), and the input–output gain (slope of the linear region in the relation between firing frequency and injected current) was steeper in FSNs (FSN: 0.91 ± 0.07 Hz pA−1, n= 19; PCs: 0.21 ± 0.02 Hz pA−1, n= 25, P < 0.001, t test).
Next, we determined the effects of the gamma wave stimulus protocol before and after CCh application, while the depolarizing effects of CCh (Figs 1 and 2) were prevented by injecting hyperpolarizing current. Gamma wave stimuli of a given magnitude produced APs in a larger proportion of cycles in PCs stimulated in the presence of 10 μM CCh (Fig. 10A and B), without affecting the spike timing or its standard deviation (Supplemental Fig. S6). The increase by CCh in the probability of PC firing per gamma cycle was associated with a 35% reduction of the rheobase (Fig. 10Bb) and a 8.5% decrease in the AP threshold (Fig. 10Bc; F2,46= 5.176, P < 0.01 by RM ANOVA). These changes in oscillatory
Figure 10. Carbachol (CCh) increased the probability of firing per oscillation cycle in pyramidal cells (PCs) and fast-spiking interneurons (FSNs).
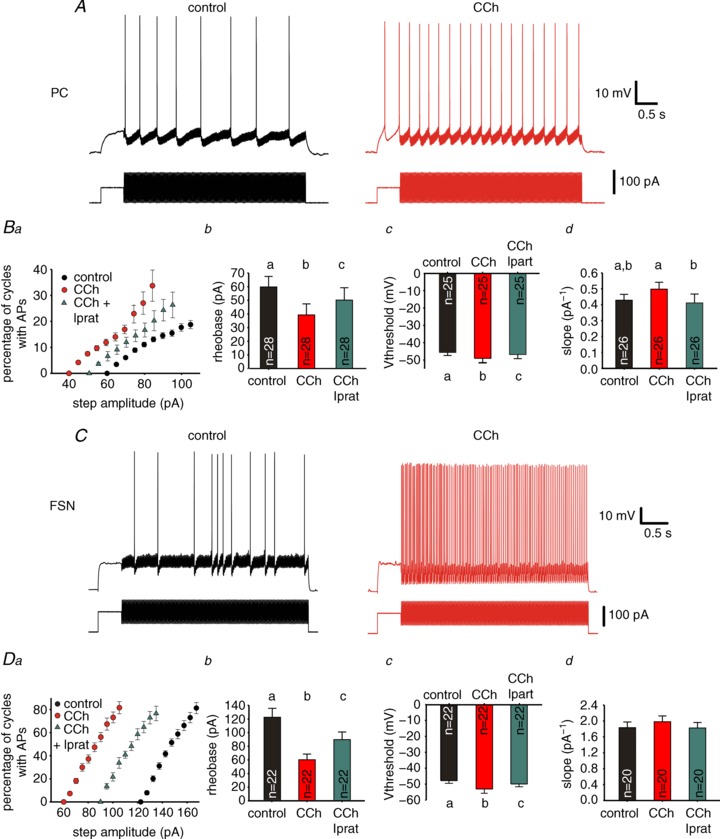
A, representative traces of recordings from a PC during gamma wave stimulation (as in Fig. 9A), in control conditions (left), and with the same stimulus amplitude during 10 μM CCh bath application (right). Ba, relation between AP firing probability per cycle and gamma wave current step amplitude in control, 10 μM CCh and 10 μM CCh + 10 μM ipratropium (Iprat). Symbols represent mean ± SEM, n= 28. b, spike current threshold (rheobase) from the experiments shown in Ba, c, voltage threshold for action potential (AP) firing (Vthreshold) for the first AP evoked by gamma wave stimuli at the rheobase, same experiments as in Ba, d, slope of the input–output relation (gamma wave amplitude vs. spike frequency) from the results shown in Ba. Data are mean ± SEM. RM ANOVA indicated significant effects of CCh bath application: Bb: F2,54= 22.892, P < 0.001; Bc: F2,48= 5.176, P < 0.01; Bd: F2,50= 3.312, P < 0.05.Individual groups not sharing the same letter are significantly different, P < 0.05 post hoc comparisons with Tukey test. C, representative traces of recordings from a FSN (as in Fig. 9B): left: control; right: same step amplitude during 10 μM CCh bath application. Da, relation between AP firing probability and gamma wave current step amplitude in control, 10 μM CCh and 10 μM CCh + 10 μM ipratropium. Symbols represent mean ± SEM, n= 22. b, rheobase calculated from the experiments shown in Da, c, Vthreshold for the first AP evoked by gamma wave stimuli at the rheobase, from the experiments shown in Da, d, slope of the spike frequency vs. gamma wave current step amplitude from the results shown in Da. Data are shown as mean ± SEM. Individual groups not sharing the same letter are significantly different, P < 0.05 post hoc comparisons with Tukey test (by RM ANOVA, b: F2,42= 27.246, P < 0.001; c: F2,42= 6.696, P < 0.01; d: F2,38= 1.201, P= 0.312).
PC firing were reversed by the mAChR antagonist ipratropium (Fig. 10Ba–c). In PCs, the input–output gain was significantly affected by cholinergic receptor manipulation (F2,50= 3.312, P < 0.05, RM ANOVA), although the gain did not differ significantly between control and CCh conditions (Fig. 10Bd; P= 0.136). In FSNs, CCh similarly increased the probability of firing in each gamma cycle (Fig. 10C), and produced an ipratropium-reversible reduction of rheobase (51%; Fig. 10Da,b) and decrease in AP threshold (11%; Fig. 10Dc; F2,38= 6.696, P < 0.01, RM ANOVA), but without changing the gain of the input–output relation (Fig. 10Dd; F2,38= 1.201, P= 0.312, RM ANOVA). These data show that mAChR stimulation increases the efficacy of oscillatory inputs to recruit mPFC neurons.
The potentiation of oscillatory firing by CCh is not correlated with changes in basic membrane properties, because, as reported elsewhere for mPFC PCs (Dembrow et al. 2010), the input resistance did not change significantly in PCs or FSNs (Table 2). Similarly, the membrane time constant was unaffected by CCh in PCs or FSNs (Table 2). However, here (Fig. 2) and in previous studies (Kawaguchi, 1997; Martin et al. 2001; Yoshino et al. 2011), CCh increased the frequency of excitatory and inhibitory synaptic events. Thus, one possibility is that the CCh-mediated potentiation of oscillatory firing of PCs and FSNs is produced by CCh-induced sEPSPs or that CCh-induced sIPSPs reduced the effects of CCh on oscillatory firing. To address these possibilities, we next tested the effects of CCh on oscillatory firing after blocking glutamate synapses with 6-cyano-7-nitroquinoxaline-2,3-dione (CNQX) and (2R)-amino-5-phosphonovaleric acid; (2R)-amino-5-phosphonopentanoate (APV), or by blocking GABA synapses with gabazine. We found that CCh similarly potentiated the response to oscillatory inputs with or without synaptic transmission blockers, in either PCs or FSNs (Supplemental Fig. S7). However, both glutamate and GABA synaptic transmission blockers revealed a significant increase of the input–output gain by CCh in both PCs (13–27%) and FSNs (31–41%), which was not found with synaptic transmission intact. These results show that the CCh potentiation of oscillatory firing was not due to an excitatory effect of increased EPSP frequency and that synaptic background activity in fact attenuated some of the effects of CCh. Because in the absence of synaptic blockers CCh did affect the input resistance of PCs and FSNs, one possibility is that CCh produced two opposing effects: first, an increase in the input resistance that boosts the probability of oscillatory firing in PCs and FSNs; and second an increase in synaptic activity that decreases the membrane resistance, reducing oscillatory firing. In agreement with this hypothesis, we found that in the presence of synaptic blockers, CCh increased the input resistance in FSNs and PCs (Table 3). Therefore, the increase in oscillatory firing of PCs and FSNs was mediated, at least in part, by an increase in the input resistance that was partially counteracted by the effects of synaptic background activity.
Table 2.
Bath application of CCh does not modulate the input resistance and membrane time constant of PCs and FSNs
| Control | CCh | P | ||
|---|---|---|---|---|
| PCs (18) | Rm (MΩ) | 233 ± 23 | 258 ± 20 | 0.369 |
| τm (ms) | 30.4 ± 2.7 | 29.2 ± 2.5 | 0.753 | |
| FSNs (18) | Rm (MΩ) | 192 ± 22 | 187 ± 18 | 0.755 |
| τm (ms) | 11.2 ± 0.7 | 11.6 ± 0.7 | 0.832 |
FSN, fast-spiking interneuron; PC, pyramidal cell; Rm, input resistance; τm, membrane time constant. The sample size is in parentheses and the result of repeated measurements Student's t test is shown.
Table 3.
Effects of CCh on the input resistance of PCs and FSNs in the presence of synaptic receptor blockers
| Rmcontrol (MΩ) | RmCCh (MΩ) | P | ||
|---|---|---|---|---|
| PCs | CNQX + APV (24) | 268 ± 25 | 295 ± 28 | 0.029 |
| gabazine (20) | 285 ± 32 | 346 ± 39 | 0.032 | |
| FSNs | CNQX + APV (20) | 211 ± 16 | 242 ± 21 | 0.005 |
| gabazine (23) | 186 ± 17 | 201 ± 18 | 0.032 |
APV, (2R)-amino-5-phosphonovaleric acid; (2R)-amino- 5-phosphonopentanoate; CNQX, 6-cyano-7-nitroquinoxaline- 2,3-dione; FSN, fast-spiking interneuron; PC, pyramidal cell; Rm, input resistance. The sample size is in parentheses and the result of repeated measurements Student's t test is shown.
Discussion
The study of the contribution of cholinergic modulation to production of gamma oscillations is greatly facilitated by the use of in vitro slice preparations. Importantly, in slices of somatosensory (Buhl et al. 1998), motor (Yamawaki et al. 2008) or visual cortex (Oke et al. 2010; Anver et al. 2011), CCh alone is not capable of inducing gamma oscillations and the combined effects of CCh and kainate are required. The mechanisms by which the addition of kainate facilitates CCh-induced neocortical gamma oscillations are unclear, and may involve either additive effects or complex non-linear interactions between the effects of each modulator. While here we assessed the contribution of cholinergic modulation to PING mechanisms, a more complete understanding of the mechanism underlying cholinergic gamma oscillations in mPFC requires future testing of the effects of kainate, and of CCh and kainate combined, on circuit components of the PING model.
In recordings from single neurons in mPFC layer 3, the mAChR agonist CCh depolarized the cell membrane and evoked APs in a substantial fraction of PCs, leading to increased EPSP frequency in the FSN population. At PC–FSN and FSN–PC synapses, CCh had significant presynaptic effects, reducing short-term depression and equalizing synaptic strength during repetitive presynaptic firing. Furthermore, CCh increased the probability of firing in each oscillation cycle, when PCs and FSNs were stimulated with oscillatory inputs at gamma frequency. The significant CCh modulation in mPFC of cortical circuit components crucial for the PING model thus reveals important effects by which cholinergic modulation may contribute to the production of gamma activity, given the current evidence that gamma oscillations are produced via PING-like mechanisms.
Cholinergic modulation provides excitatory drive onto PCs in mPFC
In previous studies of mouse mPFC neurons, bath-applied CCh depolarized layer 5 PCs, and induced AP firing in a subset of these neurons, but did not affect layer 2/3 PCs (Gulledge et al. 2009). Because our experiments excluded layer 2 or the layer 2/3 interface, and preferentially targeted PCs in deeper layer 3, in concert with previous studies, our results suggest that cholinergic effects are stronger in deeper layers of mPFC. Layer-dependent effects of CCh are not related to layer-specific localization of mAChRs or cholinergic fibres, as both are abundant in superficial and deep mPFC layers (Zhang et al. 2010). Interestingly, neuromodulation differs across subtypes of mPFC PCs defined by their long-distance projection targets (Dembrow et al. 2010; Avesar & Gulledge, 2012). Because CCh produced subthreshold depolarization but not AP firing in a subgroup of PCs, one possibility to be tested in future studies is that the effects of CCh observed here vary across PC subtypes that differ in long-distance projection targets. Importantly, CCh increased the EPSP frequency in FSNs in a TTX-sensitive manner, suggesting that those PCs in which CCh stimulates AP firing project onto FSNs. As in previous studies (Kawaguchi, 1997; Gulledge et al. 2007, 2009), here CCh had minimal direct effects on the FSN membrane potential and did not elicit FSN firing. Therefore, as proposed by the PING model, mAChR activation may increase the excitatory drive onto FSNs primarily via synaptic input from PCs.
While our experiments focused on the parvalbumin- positive FSNs that are the main source of synaptic inhibition producing network synchrony in gamma band (Buzsaki & Wang, 2012), mAChR activation elicits firing of cholecystokinin (CCK)-containing and somatostatin (SST)-containing interneurons (Kawaguchi, 1997; Fanselow et al. 2008). However, SST and CCK cell firing is weakly coupled to the gamma oscillation cycle (Tukker et al. 2007), while strongly coupled to the theta rhythm (Klausberger et al. 2003, 2005). Because CCh induces oscillatory firing at theta frequency in SST and CCK neurons (Fanselow et al. 2008; Nagode et al. 2011), and SST and CCK cells synapse onto FSNs (Karson et al. 2009; Lovett-Barron et al. 2012), CCh may convey theta modulation of FSN firing and contribute to theta–gamma coupling, an effect that could be addressed in future studies. In addition, we have not examined the potential effects of mAChR activation of FSN–FSN chemical and electrical synapses, which may be relevant for gamma oscillation mechanisms (Galarreta & Hestrin, 2002).
Presynaptic modulation of short-term depression by CCh equalizes synaptic strength during gamma frequency activity
As synaptic depression decreases the strength of synaptic connections in a frequency-dependent manner, short-term depression at FSN–PC and PC–FSN synapses may significantly affect functional connectivity in mPFC circuits during gamma rhythms. Because cholinergic neuromodulation contributes to in vivo gamma oscillation production (Munk et al. 1996; Cape et al. 2000; Rodriguez et al. 2004, 2010; Janiesch et al. 2011), repetitive gamma frequency activity may be found mostly during cholinergic modulation. We report here that mAChR activation significantly attenuates synaptic depression, and that this effect equalized the strength of FSN–PC and PC–FSN synaptic connections. Because FSNs and PCs fire at variable instantaneous frequencies during gamma oscillation episodes (Bragin et al. 1995; Atallah & Scanziani, 2009), their synaptic output would have variable degrees of short-term synaptic depression. By reducing such variability in synaptic output, the CCh-mediated equalization observed here may produce more homogeneous unitary synaptic currents during gamma oscillation episodes.
The equalizing effect of CCh on synaptic strength during presynaptic spike trains was associated with an increase in the rate of transmission failures, thus consistent with presynaptic effects. CCh may modulate uIPSC failure rate via activation of the presynaptic mAChRs present at FSN–PC synapses (Hajos et al. 1998; Fukudome et al. 2004). While the effects of CCh had not been tested previously at PC–FSN connections, we found that the effects of CCh at these synapses are consistent with a presynaptic locus of action, suggesting the presence of presynaptic mAChRs at PC–FSN synapses, a prediction that must be confirmed by immunolabelling, as for FSN–PC synapses.
CCh potentiates oscillatory firing of PFC neurons
Once gamma network activity is ongoing, firing of individual neurons is driven by oscillatory changes in membrane potential induced by rhythmic synaptic currents (Bringuier et al. 1997; Buhl et al. 1998; Penttonen et al. 1998; Atallah & Scanziani, 2009; Buzsaki & Wang, 2012). Here we show that when mPFC neurons were stimulated with gamma wave-like input currents, bath-applied CCh enhanced the probability of PC and FSN firing per oscillation cycle. We did not investigate in detail the ionic basis of these effects; however, CCh reduced the rheobase and produced a hyperpolarizing shift in the AP voltage threshold, along with changes in input resistance. A limitation of our gamma wave-like input experimental design is that the amplitude and shape of the sinusoidal current injection remains constant, whereas the oscillatory changes in synaptic conductance that take place during gamma rhythms generate synaptic currents that vary with the actual membrane potential. Thus, our experiments could overestimate the gain of the input–output curves, because as the step current increases and produces more membrane depolarization, it changes the driving force for the synaptic currents. However, the peak-to-peak amplitude and shape of our sinusoidal current injection are unaltered with increasingly larger step currents.
Functional significance
Equalization of the unitary synaptic currents during stimulus trains occurred at the expense of increasing the failure rate and thus decreasing the unitary synaptic current amplitude. The decrease in unitary synaptic strength by CCh was stronger for lower frequency transmission, as in the hippocampus (Gulyas et al. 2010). If, during gamma oscillations, individual cells firing at low frequency are out of synchrony, then CCh may favour network synchrony by suppressing their asynchronous output. Such an effect may be more significant for FSNs than for PCs, as the latter show smaller differences in firing frequency between baseline and gamma activity episodes.
A decrease by CCh in the strength of the synaptic connections appears inconsistent with gamma oscillation generation; however, unitary synaptic currents are also decreased in amplitude by CCh in hippocampal slices, where CCh readily induces gamma activity (Gulyas et al. 2010; Szabo et al. 2010). A critical question is therefore how gamma oscillations are associated with production of rhythmic synaptic currents with an amplitude larger than the typical unitary synaptic current (Mann et al. 2005; Oren et al. 2006; Atallah & Scanziani, 2009), even though CCh decreases the unitary synaptic strength. We suggest that the particular connectivity between FSNs and PCs plays a crucial role, as recent studies revealed that FSNs are synaptically connected onto nearly 100% of the nearby PCs, in a highly convergent manner (Fino & Yuste, 2011; Packer & Yuste, 2011), and that cortical interneurons receive very frequent and apparently non-selective input from many nearby PCs (Kerlin et al. 2010; Bock et al. 2011). Thus, in the local microcircuit, connectivity rate is not a substantial limiting factor for the functional interactions between the PC and FSN populations and, when CCh increases the probability of cell firing per gamma cycle, most of the cells recruited would contribute to the compound rhythmic conductance produced by summation, cycle by cycle, of unitary synaptic inputs. Therefore, the increased probability of cell firing per oscillation cycle by CCh may compensate, at the circuit level, for the decrease in unitary synaptic input strength. The validity of this model must be tested in future studies comparing, in the same experiment, the size of unitary synaptic currents in connected cell pairs before CCh modulation with the size of the rhythmic synaptic current observed during CCh-induced oscillatory activity. Furthermore, an analysis of the effects of kainate and of the combined effects of CCh and kainate on the mPFC circuit components studied here is necessary to determine how kainate facilitates gamma oscillation induction in combination with the cholinergic effects described in the current study.
The decrease of synaptic depression that equalized synaptic strength at FSN–PC and PC–FSN connections and the increased probability of oscillatory mPFC neuron firing by CCh were both stable during relatively prolonged episodes of gamma activity, such as those observed during the delay period of working memory tasks (Howard et al. 2003; Roux et al. 2012). We therefore suggest that the effects observed here may contribute to the role of gamma oscillations during working memory and possibly other cognitive functions dependent on PFC circuitry.
Acknowledgments
We are grateful to Ms Olga Krimer for excellent technical assistance.
Glossary
- ACSF
artificial cerebrospinal fluid
- AP
action potential
- APV
(2R)-amino-5-phosphonovaleric acid; (2R)-amino-5-phosphonopentanoate
- CCh
carbachol
- CCK
cholecystokinin
- CNQX
6-cyano-7-nitroquinoxaline-2, 3-dione
- FSN
fast-spiking interneuron
- GFP
green fluorescent protein
- ING
interneuron network gamma
- mAChR
muscarinic ACh receptor
- mPFC
medial prefrontal cortex
- PC
pyramidal cell
- PFC
prefrontal cortex
- PING
pyramidal interneuron network gamma
- RM ANOVA
repeated measurements ANOVA
- sEPSP
spontaneous EPSP
- SST
somatostatin
- uEPSC
unitary EPSC
- uEPSCss
unitary EPSC at the steady-state
- uIPSC
unitary IPSC
- uIPSCss
unitary IPSC at the steady-state
Additional information
Competing interests
D.A.L. currently receives investigator-initiated research support from Bristol-Myers Squibb, Curidium Ltd and Pfizer, and serves as a consultant to Bristol-Myers Squibb and Concert.
Author contributions
D.E.P., T.M. and G.G.-B. designed, and D.E.P. and T.M. performed all the electrophysiology experiments in the Translational Neuroscience Program, University of Pittsburgh. D.E.P. and T.M. analysed the electrophysiological data. D.E.P., T.M., D.A.L. and G.G.-B. wrote the paper. All authors approved the final version of the manuscript.
Funding
This work was funded by National Institutes of Health Grant MH084053.
Supplementary material
Supporting Information
References
- Akam T, Oren I, Mantoan L, Ferenczi E, Kullmann DM. Oscillatory dynamics in the hippocampus support dentate gyrus-CA3 coupling. Nat Neurosci. 2012;15:763–768. doi: 10.1038/nn.3081. [DOI] [PMC free article] [PubMed] [Google Scholar]
- Ali AB, Deuchars J, Pawelzik H, Thomson AM. CA1 pyramidal to basket and bistratified cell EPSPs: dual intracellular recordings in rat hippocampal slices. J Physiol. 1998;507:201–217. doi: 10.1111/j.1469-7793.1998.201bu.x. [DOI] [PMC free article] [PubMed] [Google Scholar]
- Ali AB, Rossier J, Staiger JF, Audinat E. Kainate receptors regulate unitary IPSCs elicited in pyramidal cells by fast-spiking interneurons in the neocortex. J Neurosci. 2001;21:2992–2999. doi: 10.1523/JNEUROSCI.21-09-02992.2001. [DOI] [PMC free article] [PubMed] [Google Scholar]
- Anver H, Ward PD, Magony A, Vreugdenhil M. NMDA receptor hypofunction phase couples independent gamma-oscillations in the rat visual cortex. Neuropsychopharmacology. 2011;36:519–528. doi: 10.1038/npp.2010.183. [DOI] [PMC free article] [PubMed] [Google Scholar]
- Atallah BV, Scanziani M. Instantaneous modulation of gamma oscillation frequency by balancing excitation with inhibition. Neuron. 2009;62:566–577. doi: 10.1016/j.neuron.2009.04.027. [DOI] [PMC free article] [PubMed] [Google Scholar]
- Avesar D, Gulledge AT. Selective serotonergic excitation of callosal projection neurons. Front Neural Circuits. 2012;6:12. doi: 10.3389/fncir.2012.00012. [DOI] [PMC free article] [PubMed] [Google Scholar]
- Bock DD, Lee WC, Kerlin AM, Andermann ML, Hood G, Wetzel AW, Yurgenson S, Soucy ER, Kim HS, Reid RC. Network anatomy and in vivo physiology of visual cortical neurons. Nature. 2011;471:177–182. doi: 10.1038/nature09802. [DOI] [PMC free article] [PubMed] [Google Scholar]
- Borgers C, Kopell N. Synchronization in networks of excitatory and inhibitory neurons with sparse, random connectivity. Neural Comput. 2003;15:509–538. doi: 10.1162/089976603321192059. [DOI] [PubMed] [Google Scholar]
- Bragin A, Jando G, Nadasdy Z, Hetke J, Wise K, Buzsaki G. Gamma (40–100 Hz) oscillation in the hippocampus of the behaving rat. J Neurosci. 1995;15:47–60. doi: 10.1523/JNEUROSCI.15-01-00047.1995. [DOI] [PMC free article] [PubMed] [Google Scholar]
- Bringuier V, Fregnac Y, Baranyi A, Debanne D, Shulz DE. Synaptic origin and stimulus dependency of neuronal oscillatory activity in the primary visual cortex of the cat 32. J Physiol. 1997;500:751–774. doi: 10.1113/jphysiol.1997.sp022056. [DOI] [PMC free article] [PubMed] [Google Scholar]
- Buhl EH, Tamas G, Fisahn A. Cholinergic activation and tonic excitation induce persistent gamma oscillations in mouse somatosensory cortex in vitro. J Physiol. 1998;513:117–126. doi: 10.1111/j.1469-7793.1998.117by.x. [DOI] [PMC free article] [PubMed] [Google Scholar]
- Buzsaki G, Wang XJ. Mechanisms of gamma oscillations. Annu Rev Neurosci. 2012;35:203–225. doi: 10.1146/annurev-neuro-062111-150444. [DOI] [PMC free article] [PubMed] [Google Scholar]
- Cape EG, Manns ID, Alonso A, Beaudet A, Jones BE. Neurotensin-induced bursting of cholinergic basal forebrain neurons promotes gamma and theta cortical activity together with waking and paradoxical sleep. J Neurosci. 2000;20:8452–8461. doi: 10.1523/JNEUROSCI.20-22-08452.2000. [DOI] [PMC free article] [PubMed] [Google Scholar]
- Cea-del Rio CA, Lawrence JJ, Erdelyi F, Szabo G, McBain CJ. Cholinergic modulation amplifies the intrinsic oscillatory properties of CA1 hippocampal cholecystokinin- positive interneurons. J Physiol. 2011;589:609–627. doi: 10.1113/jphysiol.2010.199422. [DOI] [PMC free article] [PubMed] [Google Scholar]
- Cea-del Rio CA, Lawrence JJ, Tricoire L, Erdelyi F, Szabo G, McBain CJ. M3 muscarinic acetylcholine receptor expression confers differential cholinergic modulation to neurochemically distinct hippocampal basket cell subtypes. J Neurosci. 2010;30:6011–6024. doi: 10.1523/JNEUROSCI.5040-09.2010. [DOI] [PMC free article] [PubMed] [Google Scholar]
- Chattopadhyaya B, Di CG, Higashiyama H, Knott GW, Kuhlman SJ, Welker E, Huang ZJ. Experience and activity-dependent maturation of perisomatic GABAergic innervation in primary visual cortex during a postnatal critical period. J Neurosci. 2004;24:9598–9611. doi: 10.1523/JNEUROSCI.1851-04.2004. [DOI] [PMC free article] [PubMed] [Google Scholar]
- Croxson PL, Kyriazis DA, Baxter MG. Cholinergic modulation of a specific memory function of prefrontal cortex. Nat Neurosci. 2011;14:1510–1512. doi: 10.1038/nn.2971. [DOI] [PMC free article] [PubMed] [Google Scholar]
- Csicsvari J, Jamieson B, Wise KD, Buzsaki G. Mechanisms of gamma oscillations in the hippocampus of the behaving rat. Neuron. 2003;37:311–322. doi: 10.1016/s0896-6273(02)01169-8. [DOI] [PubMed] [Google Scholar]
- Dasari S, Gulledge AT. M1 and M4 receptors modulate hippocampal pyramidal neurons. J Neurophysiol. 2011;105:779–792. doi: 10.1152/jn.00686.2010. [DOI] [PMC free article] [PubMed] [Google Scholar]
- Dembrow NC, Chitwood RA, Johnston D. Projection-specific neuromodulation of medial prefrontal cortex neurons. J Neurosci. 2010;30:16922–16937. doi: 10.1523/JNEUROSCI.3644-10.2010. [DOI] [PMC free article] [PubMed] [Google Scholar]
- Drummond GB. Reporting ethical matters in the Journal of Physiology: standards and advice. J Physiol. 2009;587:713–719. doi: 10.1113/jphysiol.2008.167387. [DOI] [PMC free article] [PubMed] [Google Scholar]
- Dugladze T, Schmitz D, Whittington MA, Vida I, Gloveli T. Segregation of axonal and somatic activity during fast network oscillations. Science. 2012;336:1458–1461. doi: 10.1126/science.1222017. [DOI] [PubMed] [Google Scholar]
- Fanselow EE, Richardson KA, Connors BW. Selective, state-dependent activation of somatostatin-expressing inhibitory interneurons in mouse neocortex. J Neurophysiol. 2008;100:2640–2652. doi: 10.1152/jn.90691.2008. [DOI] [PMC free article] [PubMed] [Google Scholar]
- Fino E, Yuste R. Dense inhibitory connectivity in neocortex. Neuron. 2011;69:1188–1203. doi: 10.1016/j.neuron.2011.02.025. [DOI] [PMC free article] [PubMed] [Google Scholar]
- Fisahn A, Pike FG, Buhl EH, Paulsen O. Cholinergic induction of network oscillations at 40 Hz in the hippocampus in vitro. Nature. 1998;394:186–189. doi: 10.1038/28179. [DOI] [PubMed] [Google Scholar]
- Freund TF, Katona I. Perisomatic inhibition. Neuron. 2007;56:33–42. doi: 10.1016/j.neuron.2007.09.012. [DOI] [PubMed] [Google Scholar]
- Fuchs EC, Zivkovic AR, Cunningham MO, Middleton S, LeBeau FE, Bannerman DM, Rozov A, Whittington MA, Traub RD, Rawlins JN, Monyer H. Recruitment of parvalbumin-positive interneurons determines hippocampal function and associated behavior. Neuron. 2007;53:591–604. doi: 10.1016/j.neuron.2007.01.031. [DOI] [PubMed] [Google Scholar]
- Fukudome Y, Ohno-Shosaku T, Matsui M, Omori Y, Fukaya M, Tsubokawa H, Taketo MM, Watanabe M, Manabe T, Kano M. Two distinct classes of muscarinic action on hippocampal inhibitory synapses: M2-mediated direct suppression and M1/M3-mediated indirect suppression through endocannabinoid signalling. Eur J Neurosci. 2004;19:2682–2692. doi: 10.1111/j.0953-816X.2004.03384.x. [DOI] [PubMed] [Google Scholar]
- Galarreta M, Hestrin S. Frequency-dependent synaptic depression and the balance of excitation and inhibition in the neocortex. Nat Neurosci. 1998;1:587–594. doi: 10.1038/2822. [DOI] [PubMed] [Google Scholar]
- Galarreta M, Hestrin S. Electrical and chemical synapses among parvalbumin fast-spiking GABAergic interneurons in adult mouse neocortex. Proc Natl Acad Sci U S A. 2002;99:12438–12443. doi: 10.1073/pnas.192159599. [DOI] [PMC free article] [PubMed] [Google Scholar]
- Gulledge AT, Bucci DJ, Zhang SS, Matsui M, Yeh HH. M1 receptors mediate cholinergic modulation of excitability in neocortical pyramidal neurons. J Neurosci. 2009;29:9888–9902. doi: 10.1523/JNEUROSCI.1366-09.2009. [DOI] [PMC free article] [PubMed] [Google Scholar]
- Gulledge AT, Park SB, Kawaguchi Y, Stuart GJ. Heterogeneity of phasic cholinergic signaling in neocortical neurons. J Neurophysiol. 2007;97:2215–2229. doi: 10.1152/jn.00493.2006. [DOI] [PubMed] [Google Scholar]
- Gulyas AI, Szabo GG, Ulbert I, Holderith N, Monyer H, Erdelyi F, Szabo G, Freund TF, Hajos N. Parvalbumin-containing fast-spiking basket cells generate the field potential oscillations induced by cholinergic receptor activation in the hippocampus. J Neurosci. 2010;30:15134–15145. doi: 10.1523/JNEUROSCI.4104-10.2010. [DOI] [PMC free article] [PubMed] [Google Scholar]
- Hajos N, Palhalmi J, Mann EO, Nemeth B, Paulsen O, Freund TF. Spike timing of distinct types of GABAergic interneuron during hippocampal gamma oscillations in vitro. J Neurosci. 2004;24:9127–9137. doi: 10.1523/JNEUROSCI.2113-04.2004. [DOI] [PMC free article] [PubMed] [Google Scholar]
- Hajos N, Papp EC, Acsady L, Levey AI, Freund TF. Distinct interneuron types express m2 muscarinic receptor immunoreactivity on their dendrites or axon terminals in the hippocampus. Neuroscience. 1998;82:355–376. doi: 10.1016/s0306-4522(97)00300-x. [DOI] [PubMed] [Google Scholar]
- Hajos N, Paulsen O. Network mechanisms of gamma oscillations in the CA3 region of the hippocampus. Neural Netw. 2009;22:1113–1119. doi: 10.1016/j.neunet.2009.07.024. [DOI] [PubMed] [Google Scholar]
- Hefft S, Kraushaar U, Geiger JR, Jonas P. Presynaptic short-term depression is maintained during regulation of transmitter release at a GABAergic synapse in rat hippocampus. J Physiol. 2002;539:201–208. doi: 10.1113/jphysiol.2001.013455. [DOI] [PMC free article] [PubMed] [Google Scholar]
- Howard MW, Rizzu DS, Caplan JB, Madsen JR, Lisman J, Aschenbrenner-Scheiber R, Schulze-Bonhage A, Kahana MJ. Gamma oscillations correlate with working memory load in humans. Cerebral Cortex. 2003;13:1369–1374. doi: 10.1093/cercor/bhg084. [DOI] [PubMed] [Google Scholar]
- Janiesch PC, Kruger HS, Poschel B, Hanganu-Opatz IL. Cholinergic control in developing prefrontal- hippocampal networks. J Neurosci. 2011;31:17955–17970. doi: 10.1523/JNEUROSCI.2644-11.2011. [DOI] [PMC free article] [PubMed] [Google Scholar]
- Karson MA, Tang AH, Milner TA, Alger BE. Synaptic cross talk between perisomatic-targeting interneuron classes expressing cholecystokinin and parvalbumin in hippocampus. J Neurosci. 2009;29:4140–4154. doi: 10.1523/JNEUROSCI.5264-08.2009. [DOI] [PMC free article] [PubMed] [Google Scholar]
- Kawaguchi Y. Selective cholinergic modulation of cortical GABAergic cell subtypes. J Neurophysiol. 1997;78:1743–1747. doi: 10.1152/jn.1997.78.3.1743. [DOI] [PubMed] [Google Scholar]
- Kerlin AM, Andermann ML, Berezovskii VK, Reid RC. Broadly tuned response properties of diverse inhibitory neuron subtypes in mouse visual cortex. Neuron. 2010;67:858–871. doi: 10.1016/j.neuron.2010.08.002. [DOI] [PMC free article] [PubMed] [Google Scholar]
- Klausberger T, Magill PJ, Marton LF, Roberts JD, Cobden PM, Buzsaki G, Somogyi P. Brain-state- and cell-type-specific firing of hippocampal interneurons in vivo. Nature. 2003;421:844–848. doi: 10.1038/nature01374. [DOI] [PubMed] [Google Scholar]
- Klausberger T, Marton LF, O’Neill J, Huck JH, Dalezios Y, Fuentealba P, Suen WY, Papp E, Kaneko T, Watanabe M, Csicsvari J, Somogyi P. Complementary roles of cholecystokinin- and parvalbumin-expressing GABAergic neurons in hippocampal network oscillations. J Neurosci. 2005;25:9782–9793. doi: 10.1523/JNEUROSCI.3269-05.2005. [DOI] [PMC free article] [PubMed] [Google Scholar]
- Kobayashi M, Hamada T, Kogo M, Yanagawa Y, Obata K, Kang Y. Developmental profile of GABAA-mediated synaptic transmission in pyramidal cells of the somatosensory cortex. Eur J Neurosci. 2008;28:849–861. doi: 10.1111/j.1460-9568.2008.06401.x. [DOI] [PubMed] [Google Scholar]
- Kraushaar U, Jonas P. Efficacy and stability of quantal GABA release at a hippocampal interneuron-principal neuron synapse. J Neurosci. 2000;20:5594–5607. doi: 10.1523/JNEUROSCI.20-15-05594.2000. [DOI] [PMC free article] [PubMed] [Google Scholar]
- Kruglikov I, Rudy B. Perisomatic GABA release and thalamocortical integration onto neocortical excitatory cells are regulated by neuromodulators. Neuron. 2008;58:911–924. doi: 10.1016/j.neuron.2008.04.024. [DOI] [PMC free article] [PubMed] [Google Scholar]
- Lovett-Barron M, Turi GF, Kaifosh P, Lee PH, Bolze F, Sun XH, Nicoud JF, Zemelman BV, Sternson SM, Losonczy A. Regulation of neuronal input transformations by tunable dendritic inhibition. Nat Neurosci. 2012;15:423–430. doi: 10.1038/nn.3024. [DOI] [PubMed] [Google Scholar]
- Mann EO, Paulsen O. Mechanisms underlying gamma (‘40 Hz’) network oscillations in the hippocampus–a mini-review. Prog Biophys Mol Biol. 2005;87:67–76. doi: 10.1016/j.pbiomolbio.2004.06.004. [DOI] [PubMed] [Google Scholar]
- Mann EO, Suckling JM, Hajos N, Greenfield SA, Paulsen O. Perisomatic feedback inhibition underlies cholinergically induced fast network oscillations in the rat hippocampus in vitro. Neuron. 2005;45:105–117. doi: 10.1016/j.neuron.2004.12.016. [DOI] [PubMed] [Google Scholar]
- Martin LA, Wei DS, Alger BE. Heterogeneous susceptibility of GABA(A) receptor-mediated IPSCs to depolarization-induced suppression of inhibition in rat hippocampus. J Physiol. 2001;532:685–700. doi: 10.1111/j.1469-7793.2001.0685e.x. [DOI] [PMC free article] [PubMed] [Google Scholar]
- Massi L, Lagler M, Hartwich K, Borhegyi Z, Somogyi P, Klausberger T. Temporal dynamics of parvalbumin-expressing axo-axonic and basket cells in the rat medial prefrontal cortex in vivo. J Neurosci. 2012;32:16496–16502. doi: 10.1523/JNEUROSCI.3475-12.2012. [DOI] [PMC free article] [PubMed] [Google Scholar]
- Munk MH, Roelfsema PR, Konig P, Engel AK, Singer W. Role of reticular activation in the modulation of intracortical synchronization. Science. 1996;272:271–274. doi: 10.1126/science.272.5259.271. [DOI] [PubMed] [Google Scholar]
- Nagode DA, Tang AH, Karson MA, Klugmann M, Alger BE. Optogenetic release of ACh induces rhythmic bursts of perisomatic IPSCs in hippocampus. PLoS One. 2011;6:e27691. doi: 10.1371/journal.pone.0027691. [DOI] [PMC free article] [PubMed] [Google Scholar]
- Oke OO, Magony A, Anver H, Ward PD, Jiruska P, Jefferys JG, Vreugdenhil M. High-frequency gamma oscillations coexist with low-frequency gamma oscillations in the rat visual cortex in vitro. Eur J Neurosci. 2010;31:1435–1445. doi: 10.1111/j.1460-9568.2010.07171.x. [DOI] [PubMed] [Google Scholar]
- Oren I, Hajos N, Paulsen O. Identification of the current generator underlying cholinergically induced gamma frequency field potential oscillations in the hippocampal CA3 region. J Physiol. 2010;588:785–797. doi: 10.1113/jphysiol.2009.180851. [DOI] [PMC free article] [PubMed] [Google Scholar]
- Oren I, Mann EO, Paulsen O, Hajos N. Synaptic currents in anatomically identified CA3 neurons during hippocampal gamma oscillations in vitro. J Neurosci. 2006;26:9923–9934. doi: 10.1523/JNEUROSCI.1580-06.2006. [DOI] [PMC free article] [PubMed] [Google Scholar]
- Otte S, Hasenstaub A, Callaway EM. Cell type-specific control of neuronal responsiveness by gamma-band oscillatory inhibition. J Neurosci. 2010;30:2150–2159. doi: 10.1523/JNEUROSCI.4818-09.2010. [DOI] [PMC free article] [PubMed] [Google Scholar]
- Packer AM, Yuste R. Dense, unspecific connectivity of neocortical parvalbumin-positive interneurons: a canonical microcircuit for inhibition. J Neurosci. 2011;31:13260–13271. doi: 10.1523/JNEUROSCI.3131-11.2011. [DOI] [PMC free article] [PubMed] [Google Scholar]
- Penttonen M, Kamondi A, Acsady L, Buzsaki G. Gamma frequency oscillation in the hippocampus of the rat: intracellular analysis in vivo. Eur J Neurosci. 1998;10:718–728. doi: 10.1046/j.1460-9568.1998.00096.x. [DOI] [PubMed] [Google Scholar]
- Regehr WG. Short-term presynaptic plasticity. Cold Spring Harb Perspect Biol. 2012;4:a005702. doi: 10.1101/cshperspect.a005702. [DOI] [PMC free article] [PubMed] [Google Scholar]
- Reyes A, Lujan R, Rozov A, Burnashev N, Somogyi P, Sakmann B. Target-cell-specific facilitation and depression in neocortical circuits. Nat Neurosci. 1998;1:279–285. doi: 10.1038/1092. [DOI] [PubMed] [Google Scholar]
- Rodriguez R, Kallenbach U, Singer W, Munk MH. Short- and long-term effects of cholinergic modulation on gamma oscillations and response synchronization in the visual cortex. J Neurosci. 2004;24:10369–10378. doi: 10.1523/JNEUROSCI.1839-04.2004. [DOI] [PMC free article] [PubMed] [Google Scholar]
- Rodriguez R, Kallenbach U, Singer W, Munk MH. Stabilization of visual responses through cholinergic activation. Neuroscience. 2010;165:944–954. doi: 10.1016/j.neuroscience.2009.10.059. [DOI] [PubMed] [Google Scholar]
- Roopun AK, LeBeau FE, Ramell J, Cunningham MO, Traub RD, Whittington MA. Cholinergic neuromodulation controls directed temporal communication in neocortex in vitro. Front Neural Circuits. 2010;4:8. doi: 10.3389/fncir.2010.00008. [DOI] [PMC free article] [PubMed] [Google Scholar]
- Rossi MA, Hayrapetyan VY, Maimon B, Mak K, Je HS, Yin HH. Prefrontal cortical mechanisms underlying delayed alternation in mice. J Neurophysiol. 2012;108:1211–1222. doi: 10.1152/jn.01060.2011. [DOI] [PubMed] [Google Scholar]
- Roux F, Wibral M, Mohr HM, Singer W, Uhlhaas PJ. Gamma-band activity in human prefrontal cortex codes for the number of relevant items maintained in working memory. J Neurosci. 2012;32:12411–12420. doi: 10.1523/JNEUROSCI.0421-12.2012. [DOI] [PMC free article] [PubMed] [Google Scholar]
- Ruiz-Mejias M, Ciria-Suarez L, Mattia M, Sanchez-Vives MV. Slow and fast rhythms generated in the cerebral cortex of the anesthetized mouse. J Neurophysiol. 2011;106:2910–2921. doi: 10.1152/jn.00440.2011. [DOI] [PubMed] [Google Scholar]
- Santini E, Sepulveda-Orengo M, Porter JT. Muscarinic receptors modulate the intrinsic excitability of infralimbic neurons and consolidation of fear extinction. Neuropsychopharmacology. 2012;37:2047–2056. doi: 10.1038/npp.2012.52. [DOI] [PMC free article] [PubMed] [Google Scholar]
- Seamans JK, Lapish CC, Durstewitz D. Comparing the prefrontal cortex of rats and primates: insights from electrophysiology. Neurotox Res. 2008;14:249–262. doi: 10.1007/BF03033814. [DOI] [PubMed] [Google Scholar]
- Senior TJ, Huxter JR, Allen K, O’Neill J, Csicsvari J. Gamma oscillatory firing reveals distinct populations of pyramidal cells in the CA1 region of the hippocampus. J Neurosci. 2008;28:2274–2286. doi: 10.1523/JNEUROSCI.4669-07.2008. [DOI] [PMC free article] [PubMed] [Google Scholar]
- Shu Y, Hasenstaub A, Duque A, Yu Y, McCormick DA. Modulation of intracortical synaptic potentials by presynaptic somatic membrane potential. Nature. 2006;441:761–765. doi: 10.1038/nature04720. [DOI] [PubMed] [Google Scholar]
- Sohal VS, Zhang F, Yizhar O, Deisseroth K. Parvalbumin neurons and gamma rhythms enhance cortical circuit performance. Nature. 2009;459:698–702. doi: 10.1038/nature07991. [DOI] [PMC free article] [PubMed] [Google Scholar]
- Szabo GG, Holderith N, Gulyas AI, Freund TF, Hajos N. Distinct synaptic properties of perisomatic inhibitory cell types and their different modulation by cholinergic receptor activation in the CA3 region of the mouse hippocampus. Eur J Neurosci. 2010;31:2234–2246. doi: 10.1111/j.1460-9568.2010.07292.x. [DOI] [PMC free article] [PubMed] [Google Scholar]
- Tang AC, Bartels AM, Sejnowski TJ. Effects of cholinergic modulation on responses of neocortical neurons to fluctuating input. Cereb Cortex. 1997;7:502–509. doi: 10.1093/cercor/7.6.502. [DOI] [PubMed] [Google Scholar]
- Tiesinga P, Sejnowski TJ. Cortical enlightenment: are attentional gamma oscillations driven by ING or PING. Neuron. 2009;63:727–732. doi: 10.1016/j.neuron.2009.09.009. [DOI] [PMC free article] [PubMed] [Google Scholar]
- Tukker JJ, Fuentealba P, Hartwich K, Somogyi P, Klausberger T. Cell type-specific tuning of hippocampal interneuron firing during gamma oscillations in vivo. J Neurosci. 2007;27:8184–8189. doi: 10.1523/JNEUROSCI.1685-07.2007. [DOI] [PMC free article] [PubMed] [Google Scholar]
- Uhlhaas PJ, Singer W. Abnormal neural oscillations and synchrony in schizophrenia. Nat Rev Neurosci. 2010;11:100–113. doi: 10.1038/nrn2774. [DOI] [PubMed] [Google Scholar]
- Volgushev M, Chistiakova M, Singer W. Modification of discharge patterns of neocortical neurons by induced oscillations of the membrane potential. Neuroscience. 1998;83:15–25. doi: 10.1016/s0306-4522(97)00380-1. [DOI] [PubMed] [Google Scholar]
- Wang XJ, Buzsaki G. Gamma oscillation by synaptic inhibition in a hippocampal interneuronal network model. J Neurosci. 1996;16:6402–6413. doi: 10.1523/JNEUROSCI.16-20-06402.1996. [DOI] [PMC free article] [PubMed] [Google Scholar]
- Whittington MA, Cunningham MO, LeBeau FE, Racca C, Traub RD. Multiple origins of the cortical gamma rhythm. Dev Neurobiol. 2011;71:92–106. doi: 10.1002/dneu.20814. [DOI] [PubMed] [Google Scholar]
- Whittington MA, Traub RD, Jefferys JG. Synchronized oscillations in interneuron networks driven by metabotropic glutamate receptor activation [see comments] Nature. 1995;373:612–615. doi: 10.1038/373612a0. [DOI] [PubMed] [Google Scholar]
- Whittington MA, Traub RD, Kopell N, Ermentrout B, Buhl EH. Inhibition-based rhythms: experimental and mathematical observations on network dynamics. Int J Psychophysiol. 2000;38:315–336. doi: 10.1016/s0167-8760(00)00173-2. [DOI] [PubMed] [Google Scholar]
- Wulff P, Ponomarenko AA, Bartos M, Korotkova TM, Fuchs EC, Bahner F, Both M, Tort AB, Kopell NJ, Wisden W, Monyer H. Hippocampal theta rhythm and its coupling with gamma oscillations require fast inhibition onto parvalbumin-positive interneurons. Proc Natl Acad Sci U S A. 2009;106:3561–3566. doi: 10.1073/pnas.0813176106. [DOI] [PMC free article] [PubMed] [Google Scholar]
- Xiang Z, Huguenard JR, Prince DA. Cholinergic switching within neocortical inhibitory networks. Science. 1998;281:985–988. doi: 10.1126/science.281.5379.985. [DOI] [PubMed] [Google Scholar]
- Yamamoto K, Koyanagi Y, Koshikawa N, Kobayashi M. Postsynaptic cell type-dependent cholinergic regulation of GABAergic synaptic transmission in rat insular cortex. J Neurophysiol. 2010;104:1933–1945. doi: 10.1152/jn.00438.2010. [DOI] [PubMed] [Google Scholar]
- Yamamoto S, Nishiyama S, Kawamata M, Ohba H, Wakuda T, Takei N, Tsukada H, Domino EF. Muscarinic receptor occupancy and cognitive impairment: a PET study with [11C](+)3-MPB and scopolamine in conscious monkeys. Neuropsychopharmacology. 2011;36:1455–1465. doi: 10.1038/npp.2011.31. [DOI] [PMC free article] [PubMed] [Google Scholar]
- Yamawaki N, Stanford IM, Hall SD, Woodhall GL. Pharmacologically induced and stimulus evoked rhythmic neuronal oscillatory activity in the primary motor cortex in vitro. Neuroscience. 2008;151:386–395. doi: 10.1016/j.neuroscience.2007.10.021. [DOI] [PubMed] [Google Scholar]
- Yoshino H, Miyamae T, Hansen G, Zambrowicz B, Flynn M, Pedicord D, Blat Y, Westphal RS, Zaczek R, Lewis DA, Gonzalez-Burgos G. Postsynaptic diacylglycerol lipase mediates retrograde endocannabinoid suppression of inhibition in mouse prefrontal cortex. J Physiol. 2011;589:4857–4884. doi: 10.1113/jphysiol.2011.212225. [DOI] [PMC free article] [PubMed] [Google Scholar]
- Zhang ZW, Burke MW, Calakos N, Beaulieu JM, Vaucher E. Confocal analysis of cholinergic and dopaminergic inputs onto pyramidal cells in the prefrontal cortex of rodents. Front Neuroanat. 2010;4:21. doi: 10.3389/fnana.2010.00021. [DOI] [PMC free article] [PubMed] [Google Scholar]
- Zhou X, Qi XL, Douglas K, Palaninathan K, Kang HS, Buccafusco JJ, Blake DT, Constantinidis C. Cholinergic modulation of working memory activity in primate prefrontal cortex. J Neurophysiol. 2011;106:2180–2188. doi: 10.1152/jn.00148.2011. [DOI] [PMC free article] [PubMed] [Google Scholar]
Associated Data
This section collects any data citations, data availability statements, or supplementary materials included in this article.