

Abstract
Synaptic weight changes induced by temporal correlations between the spikes of pre- and postsynaptic neurons are referred to as spike-timing-dependent plasticity (STDP). Transcranial magnetic stimulation (TMS) induces long-lasting effects on corticospinal excitability, if it is repetitively paired with stimulation of afferents from a corresponding contralateral hand region at short intervals (paired associative stimulation, PAS). PAS-induced plasticity has been linked with synaptic STDP. We aimed to investigate which elements of the cortical microcircuitry sustain and govern PAS-induced depression of corticospinal excitability in the target muscle representation (and enhancement of excitability in its functional surround). We show that the time window during which the interaction between both stimulus-induced cortical events leads to immediate post-interventional depression is short (<4.5 ms). The depressant PAS effects at the target representation were completely blocked by applying a subthreshold magnetic pulse 3 ms before the principal TMS pulse, even when the strength of the latter was adjusted to generate a motor-evoked potential of similar amplitude to that with the unconditioned magnetic pulse. Epidural recordings from the cervical cord of a patient showed that under this condition late TMS-evoked I-waves remain suppressed. When the intensity of the TMS component during PAS was lowered – sufficient to allow activation of inhibitory neurons, but insufficient to activate corticospinal neurons – excitability of short-latency intracortical inhibition remained unchanged. PAS-induced facilitation in the functional surround followed the same pattern as the centre-depressant effects. These findings may suggest that excitability-depressant PAS-induced effects are due to weakening of excitatory synapses between upper cortical layer principal neurons, but not those located on the corticospinal neuron, or inhibitory synapses. Inhibitory interneurons involved in short-latency intracortical inhibition are gate-keepers to producing centre-depressant/surround-facilitatory PAS effects. Based on these and earlier findings we propose a model specifying the composition and laminar location of the involved microcircuit of PAS-induced plasticity that may enhance its utility as a model of STDP in humans.
Key points
Repetitively pairing peripheral nerve stimulation with transcranial magnetic stimulation of the corresponding contralateral motor cortex at 10 ms (paired associative stimulation; PAS10) leads to centre-depressant effects on corticospinal excitability in a short time window.
PAS10-induced centre-depressant effects are due to weakening of excitatory synapses between principal cortical neurons, but not those located on corticospinal neurons, or inhibitory synapses.
Inhibitory interneurons are gate-keepers to producing centre-depressant PAS effects. The same mechanisms appear to govern PAS10-induced surround-facilitatory effects.
We propose a model specifying the composition and laminar location of the involved microcircuit of PAS-induced plasticity that may enhance its utility as a model of spike-timing- dependent plasticity in humans.
Introduction
Long-term potentiation (LTP) and long-term depression (LTD) of cortical synapses are considered key mechanisms of learning and memory. According to the principles of spike-timing-dependent plasticity (STDP), the direction of changes in synaptic efficacy is determined by the temporal order of pre- and postsynaptic neuronal activity in two synaptically interconnected neurons within a distinct time window (Markram et al. 1997; Feldman, 2000; Dan & Poo, 2004, 2006). In STDP of efficacy of excitatory synapses, LTP is induced if the postsynaptic neuron fires an action potential after the excitatory postsynaptic potential is induced by the weak input of the presynaptic neuron. In contrast, LTD is generated if the sequence of events is reversed. For example, LTD is produced in layer (L) 2/3 and L5 pyramidal cells of the neocortex (visual and sensory cortex) in vitro when postsynaptic spikes lead presynaptic spikes by up to 20–50 ms (Markram et al. 1997; Feldman, 2000; Sjöström et al. 2001; Froemke & Dan, 2002).
Excitability changes similar to STDP can be evoked in human motor cortex (M1) by a paired associative stimulation (PAS) protocol. PAS consists of pairing repetitively low-frequency peripheral nerve stimulation with transcranial magnetic stimulation (TMS) over the region of the corresponding contralateral motor cortex (Stefan et al. 2000). Following PAS, long-lasting bidirectional changes in M1 excitability are induced whose polarity is determined by the interval between the elements of a pair of associative stimuli (Stefan et al. 2000; Wolters et al. 2003; Müller-Dahlhaus et al. 2010). When electric stimulation of the median nerve is timed such that afferent signals reach the primary motor cortex approximately synchronous to, or shortly before, the events induced in M1 by TMS, corticospinal excitability is enhanced. The enhancement is maximal in the muscle representation receiving spatially corresponding stimulation, but is considerably less pronounced or absent in a muscle representation that is spatially discongruent with the cutaneous afferent stimulation (Stefan et al. 2000). In contrast, a pattern quite distinct from the simple spatial gradient of facilitatory PAS effects is induced when electric stimulation of a peripheral nerve is timed such that afferent signals reach M1 after the events induced by the TMS. At an interstimulus interval of 10 ms (PAS10), depression of corticospinal excitability is induced in a muscle which is homotopic to the cutaneous afferents activated by peripheral nerve stimulation (Wolters et al. 2003), whereas excitability of the cortical representation of a muscle which is heterotopic to the cutaneous innervation of the stimulated peripheral nerve is enhanced (Weise et al. 2006, 2011). Because cortical motoneurons projecting to different intrinsic hand muscles are intermingled at the level of the motor cortex (Schieber, 2001), it thus appears that the spatial response pattern toward PAS10 is markedly shaped by the topography of the sensory afferent input. If a muscle representation is defined by the afferent input as functionally ‘centre’, because this muscle is homotopic to the cutaneous input, excitability is depressed. Conversely, if a muscle representation is defined as functionally ‘surround’, because it is heterotopic, i.e. close to, but outside the cutaneous region subserved by the stimulated peripheral nerve, excitability is enhanced. This definition of a sensorimotor centre/surround organization resembles the concept of centre/surround in sensory physiology (e.g. Born, 2000; Cavanaugh et al. 2002; Tadin et al. 2003; Klein et al. 2004) where it refers to the phenomenon that the response properties of neurons are changed by stimulation outside the neuron's classical receptive field.
Although it is commonly held that PAS-induced depressant effects resemble LTD of excitatory cortical synapses as observed in animal studies (Wolters et al. 2003; Dan & Poo, 2006; Caporale & Dan, 2008; Müller-Dahlhaus et al. 2010), it remains in fact unknown exactly which elements of the cortical microcircuitry are involved. While one theory holds that PAS modulates excitatory synapses between neocortical pyramidal excitatory ‘principal’ neurons (Stefan et al. 2002; Müller-Dahlhaus et al. 2010) an alternative hypothesis is that changes in inhibitory intracortical connections underlie PAS-induced depressant effects on corticospinal excitability (Di Lazzaro et al. 2012). Indeed, Hebbian modulation of the strength of some inhibitory synapses is governed by a temporal rule mirroring that regulating excitatory synapses in that they are strengthened with a post–pre sequence and weakened with a pre–post sequence (Holmgren & Zilberter, 2001; Dan & Poo, 2006). Because TMS at the moderate intensities typically used in PAS activates both excitatory and inhibitory neurons (Hallett, 2007), synapses of either species may undergo changes that could result in identical net effects of cortical excitability. Even if it were accepted, however, that changes in excitatory synapses are involved, it remains unclear whether they are located on corticospinal neurons (CSNs) or upstream from them. In addition, it remains unknown what underlies the peculiar pattern of centre-depressant/surround-facilitatory excitability changes after PAS.
Here we used a variety of different TMS protocols to isolate elements of the cortical microcircuitry involved in PAS-induced centre-depressant/surround-facilitatory physiological changes. Using paired-pulse TMS techniques, in which a weak conditioning magnetic stimulus precedes a test pulse at short (e.g. at 3 ms) intervals, excitation of the CSN by a presynaptic cortical principal neuron can be reduced or abolished by GABAergic interneurons (Kujirai et al. 1993; Ilic et al. 2002). This approach has previously generated valuable insight related to mechanisms governing excitability- enhancing PAS effects (Elahi et al. 2012). However, the interpretation of these results is hampered by the fact that the physiological effects of afferent stimulation on the principal TMS pulse could not be unequivocally disentangled from those on the conditioning TMS pulse. In addition, resolving the question of whether the mechanisms underlying centre-depressant effects of PAS are similar to those governing the excitability-enhancing effects of PAS (Elahi et al. 2012) will be crucial for generating general models of plasticity induction by external brain stimulation that go beyond predictions derived from experiments in reduced animal preparations. For example, whereas inhibition is known to strongly regulate LTP of excitatory synapses, it remains unclear whether the same is true for LTD (Wigström & Gustafsson, 1986; Caporale & Dan, 2008). Combining paired TMS pulse techniques with direct recordings of descending activity in a rare patient having undergone spinal surgery allowed us to generate a basis for a model explaining PAS-induced plasticity. Our findings not only suggest surprising physiological selectivity of PAS-induced depressant effects and a common physiological origin of centre-depressant and surround-facilitatory effects, but also an influence of intracortical inhibition that is equally powerful on both directions of induced associative plasticity.
Methods
Subjects
Experiments were performed on 88 healthy subjects (45 females), aged 19–37 years (24.5 ± 3.1 years, mean ± standard deviation) with normal results on neurological examination. The protocol was approved by the ethics committees of the Universities of Würzburg and Leipzig. All subjects gave their written informed consent. Eighty participants were right-handed, 8 left-handed (handedness was assessed by self-report).
Experiment 2b was performed on a female patient aged 44 who had undergone surgery for stabilization of the lumbar spine 10 years before. She had no abnormalities of the central nervous system at brain and spinal cord level and had an electrode inserted at the high cervical epidural space for control of intractable dorso-lumbar pain. She was taking analgesic therapy with 900 mg day−1 gabapentin and 60 mg day−1 duloxetine that was suspended 24 h before the study. Recording of descending activity was made 2 days after implantation during the trial screening period when the electrode connections are externalized. The patient gave her written informed consent. The experiment was approved by the ethics committee of the Medical Faculty of the Catholic University of Rome.
All parts of the study were performed according to the Declaration of Helsinki.
Stimulation
Focal TMS was performed using a figure-of-eight-shaped magnetic coil (outer diameter of each wing, 7 cm) connected to a Magstim 200 stimulator (Magstim, Whitland, Dyfed, UK). The coil was held tangentially to the skull with the handle pointing backwards and laterally at an angle of 45 deg to the sagittal plane. For the paired pulse experiments (Expts 2 and 3) two Magstim 200 stimulators were connected to the same coil through a Bistim module (Magstim). Electrical mixed median nerve (MN) stimulation was performed at the wrist using a standard stimulation block (cathode proximal) connected to a Digitimer DS7A stimulator (Digitimer, Welwyn Garden City, UK). Stimulus duration was set at 200 μs and stimulus intensity at 300% of the perceptual threshold. For the recordings of the somatosensory-evoked potentials (SSEPs, see below) the stimulus duration was 300 μs and the intensity adjusted to the intensity needed to produce a visible abductor pollicis brevis (APB) muscle contraction.
Recordings
Surface EMG activity was recorded from the APB and the abductor digiti minimi (ADM; Expt 3, see below) muscle of the dominant hand using disposable surface electrodes (Ag–AgCl; Dantec Medical, Skovlunde, Denmark; Ambu Neuroline 710, Ambu GmbH, Bad Nauheim, Germany) with the active electrode mounted on the muscle belly and the inactive electrode placed over the base of the metacarpophalangeal joint of dig. I.
Raw signals were amplified using a differential amplifier (CED 1902, Cambridge Electronic Design, Cambridge, UK) and bandpass-filtered between 1 and 2000 Hz. EMG signals were sampled at 5 kHz, digitized using an analog–digital converter (CED 1401 plus, Cambridge Electronic Design) and stored in a laboratory computer for display and later off-line analysis.
Experimental procedures
Subjects were seated in a comfortable reclining chair. The optimal position of the magnetic coil (‘hotspot’) for eliciting motor-evoked potentials (MEPs) in the target muscle (APB) of the dominant hand was assessed over the contralateral motor cortex at a moderately suprathreshold stimulation intensity and marked directly on the scalp with a soft-tip pen. At the hotspot the resting motor threshold (RMT) was determined as the stimulator intensity needed to produce a response of at least 50 μV in the relaxed APB in at least 5 of 10 consecutive trials (Rossini et al. 1994).
Excitability changes were monitored by TMS before and immediately after PAS intervention using a stimulus intensity of 1.3 × RMT. Previous studies (Stefan et al. 2000, 2002; Wolters et al. 2003; Weise et al. 2006) had shown that this stimulation intensity evokes MEP amplitudes averaging to approximately 1 mV in the resting APB. Identical stimulus intensities were used before and after intervention. Subjects were instructed to keep the target muscles at complete rest during the whole experiment. Complete muscle relaxation was continuously monitored by visual and auditory feedback from the surface EMG.
Somatosensory-evoked potentials (SSEPs)
To obtain the individual latency of the N20 component, MN-SSEPs were recorded according to international guidelines (Nuwer et al. 1994) using acupuncture needle electrodes (Expt 1). The active electrode was placed over the skull region overlying the dominant primary somatosensory cortex (C3′ or C4′) using the international 10–20 system while the reference electrode was placed over Fz. Two hundred electrical stimuli (3 Hz, stimulation intensity just above the intensity eliciting a visible muscle twitch) were applied to the contralateral MN.
Paired associative stimulation (PAS)
PAS was performed by combining repetitively electric stimulation of the MN of the dominant hand with subsequent TMS of the contralateral motor cortex (0.1 Hz). The magnetic coil was placed over the optimal position for eliciting an MEP in the contralateral APB. Excitability changes were monitored by TMS before and after PAS intervention. The different experiments were separated by at least 2 days.
Expt 1. Determination of the width of the interaction window for PAS-induced depressant effects on MEP size
To accurately determine the width of the time window within which pairing leads to depressant effects, we tested a variety of intervals between the afferent median nerve stimulation and the paired TMS pulse within a narrow range of intervals. To enhance the precision of determination of the effective pairing window we took into account the interindividual variability in afferent conduction times by adapting the PAS interval using the latency of the individual N20 component of the MN-SSEP. Eleven healthy subjects (mean age 24.9 ± 2.3 years, 6 females, no left-handed) participated in Expt 1. PAS was performed by applying 90 pairs of MN-stimulation combined with TMS with an intensity of 1.3 × RMT over a period of 15 min (0.1 Hz). The latency of the N20 component of the MN-SSEP was assessed in each subject. PAS was performed using interstimulus intervals (ISIs) adjusted to the N20 latency (adjISI = N20 latency – ISI). At five different adjISIs (5.5 ms, 7.0 ms, 8.5 ms, 10 ms and 11.5 ms) 10 experimental sessions were performed for each condition, termed PAS5.5adj, PAS7.0adj, …, PAS11.5adj, respectively. The sequence of the sessions was pseudo-randomized between subjects. To compare the efficacy of the conventional PAS protocol, PAS was also performed with the (conventional) fixed ISI of 10 ms (PAS10) in six subjects.
Twenty MEPs evoked by single pulse TMS stimuli were collected before and after all PAS interventions (stimulation rate of 0.1 (±20%) Hz).
Expt 2a. Effect of variations of properties of the TMS component during PAS on motor-evoked potential amplitude of APB muscle
Sixty-four subjects (mean age 24.9 ± 3.3 years, 31 females, 7 left-handed) were examined. PAS was performed using 180 pairs of stimuli of different modality (afferent MN stimulation plus TMS) at 0.1 Hz and a fixed ISI of 10 ms.
Twenty subjects were examined in each of the conditions described below, except for the supplementary control condition, in which seven subjects were studied. Subjects participated on average in 2.3 ± 1.6 different sessions (minimum 1, maximum 7).
In order to preferentially activate different components of the intracortical microcircuitry (Hallett, 2007) we applied different TMS stimulation intensities and modes during the PAS intervention.
In three variants of the PAS protocol, a single TMS pulse was used as in the conventional PAS protocol employed in Expt 1. The intensity of the TMS pulse was set at 0.8 × RMT (PAS100.8RMT), 0.95 × RMT (PAS100.95RMT), or 1.3 × RMT (PAS101.3RMT). At an intensity of 0.8 × RMT strong inhibitory effects are evoked, with little, if any, descending corticospinal activity (Di Lazzaro et al. 2012). At 0.95 × RMT some descending activity may be evoked (Di Lazzaro et al. 2012) and 1.3 × RMT triggers a descending activity that usually results in MEP size of ∼1 mV in APB muscle.
By applying a preceding conditioning TMS pulse 3 ms and 13 ms, respectively, before the primary TMS pulse (Kujirai et al. 1993) activation of the CSN may be diminished or facilitated through activation of inhibitory and excitatory interneurons. Therefore, in a further four variants, the PAS TMS pulse was conditioned by a preceding subthreshold (0.8 × RMT) TMS pulse (conditioning stimulus, CS) at either 3 ms or 13 ms. The intensity of the PAS TMS pulse was either 1.3 × RMT (CS3-PAS101.3RMT or CS13-PAS101.3RMT), as in the conventional PAS protocol, or adapted to generate an MEP response approximately matching in size that elicited by a single TMS pulse at 1.3 × RMT in the absence of a conditioning TMS pulse (CS3-PAS101.3RMTadj or CS13-PAS101.3RMTadj).
Sixty MEPs evoked by single pulse TMS were collected before and after each PAS intervention (stimulation rate of 0.1 (±20%) Hz).
In two control experiments (control experiments 1 and 2), in seven subjects, excitability was tracked for 32 min after CS30.7RMT-PAS101.3RMT. Control experiment 1 addressed the possibility that depressant effects would emerge at some delay after application of this PAS intervention. The principal PAS TMS pulse (1.3 × RMT) was conditioned by a preceding subthreshold (0.7 × RMT) TMS pulse at 3 ms. In control experiment 2, CS3-PAS1.3RMTadj was tested with an ISI of 14 ms (CS3-PAS141.3RMTadj). This experiment addressed the possibility that the optimal temporal window of an LTD-like effect in the CS3-PAS101.3RMTadj condition might have been changed by enhancing the intensity of the principal PAS-TMS pulse.
Baseline excitability was assessed by recording (at 0.2 Hz ± 10%) 60 MEPs before the intervention. Following CS30.7RMT-PAS101.3RMT, excitability changes were monitored by collecting 12 MEP responses (0.2 Hz ± 10%) every 2 min for up to 32 min (16 blocks, starting with 1 min of rest, then 1 min measurement, 1 min rest,…). Post-interventional values were binned at four time points (T1: min 2, 4, 6, 8 following the intervention; T2: min 10, 12, 14, 16; T3: min 18, 20, 22, 24; T4: min 26, 28, 30, 32; 48 MEPs each).
To visualize the essential elements of the variants of the PAS interventions, Fig. 1 illustrates the time-line of events occurring in CS3-PAS101.3RMT. The nine different conditions are listed in Table 1.
Figure 1. Schematic illustration of the time-line of events during CS3-PAS101.3RMT.

Arrow, electric compound median nerve stimulation at the wrist of the dominant side. Grey triangle, time of arrival of signals from afferent stimulation at the dominant primary motor cortex. Because of the conduction delay, afferent information reaches the dominant primary motor cortex after the release of the principal TMS pulse. Large magnetic coil symbol and black triangle, principal TMS pulse (1.3 × RMT) delivered to the dominant primary motor cortex. Small magnetic coil symbol and open triangle, weak (0.8 × RMT) conditioning TMS pulse preceding the principal TMS pulse at 3 ms. Conditioning TMS pulse and principal TMS pulse were delivered through the same coil.
Table 1.
Stimulus conditions and outcome parameters used in Expt 2a
| Condition | Strength of CS | ISI (ms) | Strength of S* | Symbol for PAS intervention | Outcome parameters |
|---|---|---|---|---|---|
| PAS101.3RMT | — | — | 1.3 × RMT |  |
MEP(APB) |
| PAS100.95RMT | — | — | 0.95 × RMT |  |
MEP(APB) |
| PAS100.8RMT | — | — | 0.8 × RMT |  |
MEP(APB) |
| CS3-PAS101.3RMT | 0.8 × RMT | 3 | 1.3 × RMT |  |
MEP(APB) |
| CS30.7RMT-PAS101.3RMT | 0.7 × RMT | 3 | 1.3 × RMT |  |
MEP(APB) |
| CS30.7RMT-PAS141.3RMTadj | 0.7 × RMT | 3 | 1.3 × RMTadj |  |
MEP(APB) |
| CS13-PAS101.3RMT | 0.8 × RMT | 13 | 1.3 × RMT |  |
MEP(APB) |
| CS3-PAS101.3RMTadj | 0.8 × RMT | 3 | 1.3 × RMTadj |  |
MEP(APB) |
| CS13-PAS101.3RMTadj | 0.8 × RMT | 13 | 1.3 × RMTadj |  |
MEP(APB) |
CS, magnetic conditioning stimulus; RMT, resting motor threshold; ISI, interstimulus interval between the magnetic CS and the principal magnetic PAS pulse (S*); adj, stimulus intensity adjusted to generate a motor-evoked potential response approximately matching in size that elicited by a single TMS pulse at 1.3 × RMT in the absence of a conditioning TMS pulse; MEP(APB), motor-evoked potential of the abductor pollicis brevis muscle. Black triangle, principal TMS pulse; open triangle, weak conditioning TMS pulse; grey triangle, time of arrival of afferent signals at the primary motor cortex.
Expt 2b. Effect of increasing the strength of a TMS pulse in the presence of a subthreshold TMS pulse, on I-waves recorded epidurally
The physiological mechanisms allowing a stronger TMS pulse to generate a matching MEP size in CS3-PAS101.3RMTadj are not known. A subthreshold TMS pulse reduces preferentially late I-waves (Di Lazzaro et al. 2012). Conceivably, in the presence of a preceding (3 ms) subthreshold TMS pulse, the adapted suprathreshold TMS pulse may restore the original pattern of I-wave amplitudes as elicited with an unconditioned TMS pulse. Alternatively, however, the suppression of late I-waves may persist, and the amplitudes of only the D-wave and early I-waves may increase. Because these two scenarios lead to different interpretations of the nature of effects induced by PAS performed with conditioned TMS pulses, we examined this question by analysing epidural recordings in a surgical patient.
We recorded descending corticospinal activity evoked by single and paired TMS of the motor cortex directly from the high cervical epidural space of one conscious female patient.
Recordings were made simultaneously from the epidural electrode and from the left first dorsal interosseous muscle (FDI). MEPs were recorded with two 9 mm diameter Ag–AgCl surface electrodes with the active electrode over the motor point of the muscle and the reference on the metacarpophalangeal joint of the index finger. MEPs and epidural volleys were amplified and filtered (bandwidth 3 Hz to 3 kHz) by D360 amplifiers (Digitimer). Data were collected on a computer with a sampling rate of 10 kHz per channel and stored for later analysis using a CED 1401 A/D converter (Cambridge Electronic Design) and Signal software (Cambridge Electronic Design). TMS was performed with a high power Magstim 200. Both single and conditioned TMS, at an ISI of 3 ms, were performed with the stimulator(s) connected to a Bistim module. A figure-of-eight coil was held over the right motor cortex at the optimal scalp position to elicit MEPs in the contralateral FDI with a posterior-to-anterior-induced current in the brain. In order to identify the different components of the descending activity we also performed single pulse TMS with a lateral-to-medial-induced current in the brain. Using this orientation of the induced current a D-wave evoked by direct activation of the corticospinal axons is recorded (Di Lazzaro et al. 2012). RMT was defined as described above. Active motor threshold (AMT) was defined as the minimum stimulus intensity that produced an MEP of about 200 μV in 5 of 10 trials during isometric contraction of the tested muscle at 10% maximum force.
Twenty-five repeats were delivered for single pulse TMS and for conditioned cortical stimulation. In the study of conditioned cortical stimulation, two magnetic stimuli were given through the same coil at an ISI of 3 ms (Kujirai et al. 1993). For single pulse TMS we used a stimulus intensity of 110% RMT. For conditioned TMS, the conditioning stimulus intensity was set at an intensity of 5% of maximum stimulator output below AMT; two different intensities of test stimulus were used: the same intensity used for single pulse TMS (110% RMT) and an intensity adjusted in order to evoke an MEP in relaxed FDI matching the amplitude of the MEP evoked by single pulse TMS.
Expt 3. Effect of variations of properties of the TMS component during PAS on short-latency inhibition in centre/surround representations
Twenty subjects were studied (mean age 23.2 ± 1.8 years, 13 females, two left-handed) in three different protocols (Table 2). MEPs were recorded from the APB and ADM muscles. We here define the APB representation as functionally ‘centre’, as this muscle is homotopic to the cutaneous input of the median nerve. Conversely, ADM representation was defined as functionally ‘surround’, because it is heterotopic, i.e. close to, but outside the cutaneous region subserved by the median nerve (cf. Weise et al. 2006, 2011). The coil was placed over the hotspot of the APB (see above). PAS was performed as in Expt 2 using 180 pairs of stimuli at 0.1 Hz and a fixed ISI of 10 ms. In all conditions, short interval intracortical inhibition (SICI) was tested according to Kujirai et al. (1993) by delivering a subthreshold conditioning stimulus at 0.7 × RMT 3 ms before the test stimulus, which was applied at 1.3 × RMT. The mean amplitude of the MEP responses obtained by this conditioning–test pulse was expressed as a percentage of the mean amplitude of the unconditioned test responses. This value was termed conditioned response (CR)3 (Werhahn et al. 1999; Stefan et al. 2002). As RMT is not altered following excitability-depressant PAS (Wolters et al. 2003), no adjustment of the RMT-based TMS intensity was performed.
Table 2.
Stimulus conditions and outcome parameters used in Expt 3
| Condition | Strength of CS | ISI (ms) | Strength of S* | Symbol for PAS intervention | Outcome parameters |
|---|---|---|---|---|---|
| PAS101.3RMT | — | — | 1.3 × RMT |  |
MEP(APB), MEP(ADM); CR3(APB), CR3(ADM) |
| PAS100.7RMT | — | — | 0.7 × RMT |  |
MEP(APB), MEP(ADM); CR3(APB), CR3(ADM) |
| CS3-PAS101.3RMT | 0.7 × RMT | 3 | 1.3 × RMT |  |
MEP(APB), MEP(ADM); CR3(APB), CR3(ADM) |
RMT, resting motor threshold; ISI, interstimulus interval between the conditioning magnetic stimulus (CS) and the principal magnetic stimulus (S*); MEP(APB) and MEP(ADM), motor-evoked potential of the abductor pollicis brevis (APB) and abductor digiti minimi muscle (ADM), respectively; CR3(APB) and CR3(ADM), amplitude of conditioning–test pulse response normalized to the amplitude of the unconditioned test response, of the APB and ADM, respectively. Black triangle, principal TMS pulse; open triangle, weak conditioning TMS pulse; grey triangle, time of arrival of afferent signals at the primary motor cortex.
In the first condition the intensity of the PAS TMS pulse was 1.3 × RMT (PAS101.3RMT, as in one of the conditions in Expt 2) and in the second condition the PAS TMS pulse was 0.7 × RMT (PAS100.7RMT). 0.7 × RMT was chosen because at this intensity no descending corticospinal volleys are induced by TMS (Chen et al. 1998; Di Lazzaro et al. 1998). In the third condition, termed CS3-PAS101.3RMT, the PAS TMS pulse (‘principal TMS pulse’) was conditioned by a preceding subthreshold (0.7 × RMT) TMS pulse at 3 ms. The intensity of the principal TMS pulse was 1.3 × RMT.
MEP amplitudes upon single pulse TMS and CR3 were collected before all PAS interventions in two, following the intervention in four, blocks of 2 × 12 stimuli (TMS and CR3 each, stimulation rate of 0.2 (±10%) Hz). Single and double-pulse TMS (CR3) assessments were performed in a pseudorandomized order. Data were pooled from blocks before and after all PAS interventions, respectively, for further statistical analysis.
Statistics
MEP amplitudes were measured peak-to-peak in each individual trial before and after intervention. For each subject, amplitudes were averaged according to the different conditions described above, normalized to baseline (mean MEP amplitude before PAS) and entered into the final statistical analyses. Normal distribution of the data was tested using the Kolmogorov–Smirnov test. For comparison of different conditions, univariate analyses of variance (ANOVA) were employed. Post-intervention values were tested against unity using one-sample t tests. The false discovery rate correction (FDRC) procedure was used for correction for multiple comparisons (Curran-Everett, 2000). Effects were considered significant if P < 0.05. All data are given as means ± SD.
Results
Demographic and baseline (electro-)physiological data are shown in Table 3. No side effects of PAS were reported.
Table 3.
Demographic and baseline data in Expts 1–3
| Expt | Condition | Sex (F/M) | Age (years) | Handedness (R/L) | RMT | N20 latency (ms) | MN SI (mA) | MEP(APB) (mV) | MEP (ADM) (mV) |
|---|---|---|---|---|---|---|---|---|---|
| 1 | PAS5.5adj | 5/5 | 24.4 ± 1.7 | 11/0 | 34.0 ± 4.0 | 18.9 ± 1.1 | 2.8 ± 0.5 | 0.9 ± 0.4 | — |
| PAS7.0adj | 5/5 | 24.4 ± 1.7 | 11/0 | 34.2 ± 3.8 | 18.9 ± 1.1 | 2.9 ± 0.5 | 1.2 ± 0.8 | — | |
| PAS8.5adj | 6/4 | 24.8 ± 2.4 | 11/0 | 33.7 ± 3.0 | 18.4 ± 1.0 | 2.6 ± 0.4 | 1.6 ± 1.0 | — | |
| PAS10.0adj | 5/5 | 24.4 ± 1.7 | 11/0 | 34.2 ± 2.7 | 18.9 ± 1.1 | 2.9 ± 0.5 | 1.4 ± 1.0 | — | |
| PAS11.5adj | 6/4 | 24.9 ± 2.5 | 11/0 | 34.7 ± 3.8 | 18.7 ± 1.3 | 2.9 ± 0.6 | 1.2 ± 0.8 | — | |
| 2a | PAS101.3RMT | 6/14 | 25.3 ± 3.5 | 18/2 | 46.5 ± 5.5 | — | 2.8 ± 0.7 | 1.3 ± 0.6 | — |
| PAS100.95RMT | 9/11 | 24.9 ± 3.2 | 19/1 | 49.1 ± 5.4 | — | 2.8 ± 0.7 | 1.4 ± 1.2 | — | |
| PAS100.8RMT | 7/13 | 25.2 ± 3.1 | 17/3 | 49.5 ± 3.9 | — | 3.0 ± 0.6 | 1.4 ± 1.2 | — | |
| CS3-PAS101.3RMT | 7/13 | 24.7 ± 4.0 | 16/4 | 46.2 ± 5.6 | — | 2.9 ± 0.8 | 1.1 ± 0.7 | — | |
| CS30.7RMT-PAS101.3RMT | 5/2 | 24.4 ± 2.3 | 6/1 | 52.9 ± 5.5 | — | 2.1 ± 0.7 | 0.9 ± 0.3 | — | |
| CS30.7RMT-PAS141.3RMTadj | 5/2 | 24.4 ± 2.3 | 6/1 | 52.1 ± 5.5 | — | 2.2 ± 0.4 | 0.9 ± 0.3 | — | |
| CS13-PAS101.3RMT | 13/7 | 23.5 ± 3.6 | 16/4 | 46.4 ± 8.8 | — | 3.0 ± 1.6 | 1.4 ± 1.0 | — | |
| CS3-PAS101.3RMTadj | 12/8 | 23.9 ± 4.1 | 15/5 | 47.3 ± 5.6 | — | 2.8 ± 1.3 | 1.1 ± 0.6 | — | |
| CS13-PAS101.3RMTadj | 12/8 | 23.6 ± 2.8 | 14/6 | 47.3 ± 5.3 | — | 2.3 ± 0.4 | 1.2 ± 0.6 | — | |
| 3 | PAS101.3RMT | 13/7 | 23.2 ± 1.8 | 18/2 | 48.9 ± 6.2 | — | 2.4 ± 0.7 | 1.3 ± 0.9 | 1.2 ± 0.7 |
| PAS100.7RMT | 49.3 ± 6.7 | — | 2.6 ± 0.8 | 1.4 ± 1.0 | 1.2 ± 0.8 | ||||
| CS3-PAS101.3RMT | 48.8 ± 5.8 | — | 2.4 ± 0.7 | 1.3 ± 0.9 | 1.3 ± 0.8 |
RMT, resting motor threshold; MN SI, median nerve stimulus intensity; MEP(APB) and MEP(ADM), motor-evoked potential of the abductor pollicis brevis (APB) and abductor digiti minimi muscle (ADM), respectively, before the PAS intervention; mean ± SD. Please note that RMTs differ between Expt 1 and Expts 2 and 3 because the latter were performed using a Bistim module (Magstim) resulting in higher RMTs.
Width of the interaction window for PAS-induced depressant effects on MEP size (Expt 1)
We tested the width of the time window inducing excitability-depressant plasticity in M1 by adjusting the ISI to the individual N20 latency. The mean N20 latency was 18.9 ± 1.2 ms (range 16.5–21.0 ms).
Motor cortical excitability decreased following PAS with an adjusted ISI (adjISI) of 8.5 ms and 10 ms, whereas it remained essentially unchanged following PAS using the remaining intervals. Univariate ANOVA revealed a significant interaction of time and adjISI indicating that motor cortex excitability changed following PAS as a function of the adjusted ISI (ANOVA, Time (pre, post) × adjISI (5.5, 7.0, 8.5, 10.0, 11.5), F(4,90)= 3.443, P= 0.012; Fig. 2). Post hoc analysis of the change of MEP amplitudes (Δ%) revealed significant effects for adjISI = 8.5 ms and 10 ms. PAS8.5adj led to a decrease of MEP amplitudes by 26.1 ± 22% (post hoc t test; P= 0.002) while following PAS10adj, MEP amplitudes decreased by 22.3 ± 19% (P= 0.002). MEP amplitudes were not significantly different from baseline after PAS5.5adj (−4.2 ± 17%, P= 0.435), PAS7.0adj (+5.1 ± 32%, P= 0.620) and PAS11.5adj (−8.8 ± 16%, P= 0.098).
Figure 2. Determination of the width of the interaction window for PAS-induced depressant effects on MEP size (Expt 1).

Individual data (grey dots) and group mean data ± SEM (black bars) of the changes of the normalized MEP amplitudes following PAS with different interstimulus intervals adjusted to the individual N20 latency (adjISI = N20 latency – ISI, Expt 1). §Significant change from baseline. Inset, schematic illustration of the varying cortical arriving times of the afferent pulse reaching the primary motor cortex.
In six subjects we subsequently compared the effects of PAS using a fixed ISI of 10 ms with the effects of that PAS intervention that was performed with an N20-adjusted interval and yielded on average the strongest depressant effect (PAS8.5adj) in the same subjects. There was no significant difference between the effect of PAS performed with the N20-adjusted interval (−31.8 ± 12%) and PAS performed with a fixed interval of 10 ms (−20.7 ± 22%, paired t test, P= 0.235, Fig. 3) suggesting that, although the depressant effects are dependent on interaction of neuronal events in a narrow time window, adjustment of the ISI to the individual N20 latency is not a necessary requirement to elicit excitability-depressant effects of PAS. A fixed ISI was therefore used in the subsequent experiments.
Figure 3. Comparison of the effects of PAS using a fixed ISI of 10 ms with the effects of the PAS intervention that was performed with an N20 adjustment.

Reducing N20 latency by 8.5 ms yielded on average the strongest depressant effect. Group mean data (filled column) + SEM (black bars) and individual data (squares) of the changes of the normalized MEP amplitudes following PAS.
Effect of variations of properties of the TMS component during PAS on MEP amplitude of APB muscle (Expt 2a)
This experiment was designed to isolate and locate specific components of the cortical microcircuitry during PAS.
In a first analysis, we confirmed that different PAS protocols were associated with different effects on MEP amplitudes (ANOVA, Intervention (PAS100.8RMT, PAS100.95RMT, PAS101.3RMT, CS3-PAS101.3RMT, CS13-PAS101.3RMT, CS3-PAS101.3RMTadj, CS13-PAS101.3RMTadj) × Time (pre, post), F(6,266)= 5.942, P < 0.001, Fig. 4). The effects of different aspects of the cortical microcircuitry were examined in separate analyses.
Figure 4. Effect of variations of properties of the TMS component during PAS on MEP amplitude of APB muscle (Expt 2a).
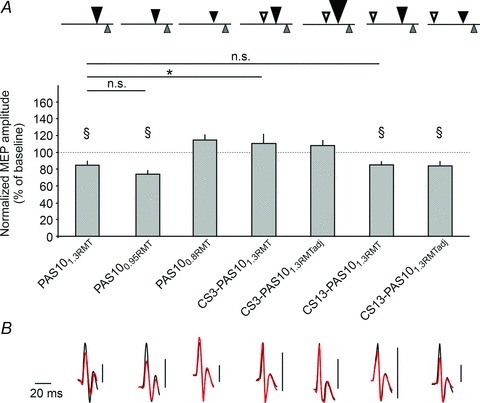
A, top row, symbols refer to the different variants of PAS10 as described in Table 1. Group data of the changes of the normalized MEP amplitudes + SEM (black bars) following different PAS variants. §Significant change from baseline. Asterisk indicates a significant difference between different PAS10 variants. B, MEP amplitudes from a representative subject before (black) and following PAS (red). Right vertical bars represent calibration bars (0.5 mV). All baseline MEPs are scaled to the same size for better comparison between different interventions.
By comparing the effects of PAS employing TMS pulse intensities subthreshold and suprathreshold for evoking MEPs we aimed at determining (i) whether activation of inhibitory interneurons by TMS during PAS is sufficient to generate depressant effects on corticospinal excitability and (ii) activity in CSNs during PAS is a necessary requirement for inducing depressant effects on corticospinal excitability. At an intensity of 0.8 × RMT (PAS100.8RMT) strong inhibitory effects are evoked (Kujirai et al. 1993), whereas descending corticospinal activity appears to be absent or minimal (Di Lazzaro et al. 2012). By contrast, TMS at 0.95 × RMT (PAS100.95RMT) or at 1.3 × RMT (PAS101.3RMT) evokes descending activity reflecting CSN activation (Di Lazzaro et al. 2012).
PAS10-induced depressant effects were markedly influenced by TMS intensity during PAS (ANOVA, TMS pulse (0.8RMT, 0.95RMT, 1.3RMT) × Time (pre, post), F(2,114)= 15.156, P < 0.001). Post hoc testing revealed that MEP amplitudes from APB were reduced following PAS101.3RMT (−15.3 ± 20.5%, P= 0.002) and following PAS100.95RMT (−24.1 ± 19.6%, P < 0.001). Although PAS100.95RMT-induced depression was more pronounced than for PAS101.3RMT-induced depression, the difference did not reach significance (P= 0.097). Following PAS100.8RMT, however, MEP amplitudes did not decrease (+14.5 ± 30.6%, P= 0.041, not significant after FDRC). This experiment suggested that strong activation of inhibitory interneurons at TMS intensities subthreshold for inducing an MEP is unlikely to underlie PAS10-induced depressant effects. Furthermore, since PAS100.95RMT was followed by a suppression of MEP amplitudes that was no less pronounced than after PAS101.3RMT, strong activation of the CSN is not required for depressant effects. However, as some descending activity is evoked at 0.95 × RMT (Di Lazzaro et al. 2012), it remains a possibility that PAS100.95RMT-induced depressant effects require some CSN activation (perhaps of those recruited at low TMS intensities).
The question of whether CSN activity is required for PAS10-induced depressant effects was addressed by the analysis of the series of different PAS protocols using pairs of TMS pulses during PAS.
As expected (Kujirai et al. 1993), addition of a subthreshold TMS pulse 3 ms before the principal TMS pulse (CS3-PAS101.3RMT) decreased MEP amplitudes recorded during the PAS intervention (−48.6 ± 43.7%, P= 0.004) and addition of a subthreshold TMS pulse 13 ms before the principal TMS pulse (CS13-PAS101.3RMT) increased MEP amplitudes recorded during the PAS intervention (+50.7 ± 58.3%, P < 0.001).
Depressant PAS effects depended on the presence and timing of a conditioned TMS pulse (ANOVA, CS (no CS, CS3, CS13) × Time (pre, post), F(2,114)= 3.772, P= 0.026). Following CS3-PAS101.3RMT, MEP amplitudes were not significantly changed (+10.6 ± 52.6%, P= 0.373; CS3-PAS101.3RMT vs. PAS101.3RMT, P= 0.047).
In control experiment 1 on seven subjects, excitability was tracked for 32 min following CS3-PAS101.3RMT, performed with the conditioning TMS pulse set at 0.7 × RMT (CS30.7RMT-PAS101.3RMT). Tracking excitability for 32 min served to address the possibility that a depressant effect might emerge at a later time after termination of CS3-PAS101.3RMT. Excitability remained unchanged at all time epochs (T1(min 2, 4, 6, 8), −5.3 ± 20%; T2(min 10, 12, 14, 16), +1.7 ± 8%; T3(min 18, 20, 22, 24), +2.2 ± 12%; T4(min 26, 28, 30, 32), −2.8 ± 9%) after CS30.7RMT-PAS101.3RMT (repeated measures ANOVA ‘Time’F(4,24)= 0.073, P= 0.571). This finding rendered the possibility unlikely that adding a conditioning magnetic pulse to the principal TMS pulse had just delayed, but not abolished the excitability-depressant effect of PAS101.3RMT.
The fact that PAS10-depressant effects were abolished by adding a conditioning pulse before the principal TMS pulse could be due (i) to the presence of a subthreshold TMS pulse, (ii) diminished activity of the CSN, or (iii) to blockade of an excitatory connection presynaptic to the CSN, but unrelated to the CSN activity itself. These possibilities were addressed in subsequent analyses. Following CS13-PAS101.3RMT, MEP amplitudes were reduced (−15.0 ± 19.6%, P= 0.002; CS13-PAS101.3RMT vs. PAS101.3RMT, P= 0.968). This finding suggested that it was not the presence of a subthreshold TMS pulse per se which blocked the depressant effects of PAS10. The fact that the size of MEPs elicited by the principal TMS pulse during CS3-PAS101.3RMT was smaller than that elicited with PAS10 employing a single TMS pulse raised the possibility that blockade of PAS-induced depressant effects on corticospinal excitability was directly related to reduced activity in CSNs during induction. Increasing the intensity of the principal TMS pulse during CS3-PAS10 generated a conditioned MEP size of about 1 mV (CS3-PAS101.3RMTadj, mean increase of TMS pulse intensity +16 ± 7%). However, CS3-PAS101.3RMTadj did not restore the depressant effect (+7.7 ± 28.5%, P= 0.232; CS3-PAS101.3RMTadj vs. PAS101.3RMT, P= 0.006). Similarly, we considered the possibility that CS13-PAS101.3RMT had led to depressant effects because the presence of a subthreshold conditioning pulse had been compensated by the larger amplitude of the MEP during PAS. The intensity of the principal TMS pulse during the intervention (CS13-PAS101.3RMTadj) was reduced to generate a conditioned MEP size of about 1 mV (mean decrease of the TMS pulse intensity, −5 ± 4%). Adjusting the intensity of the principal TMS pulse, however, did not diminish the capacity of the protocol to induce depressant effects (CS13-PAS101.3RMTadj, −16.1 ± 20.1%, P < 0.001; vs. CS13-PAS101.3RMT (P= 0.861; vs. PAS101.3RMT, P= 0.895). In control experiment 2, excitability was tracked in seven subjects for 32 min following CS3-PAS141.3RMTadj using an ISI of 14 ms between the MN stimulation and the principal PAS-TMS pulse. This control experiment addressed the possibility that the emergence of a D-wave, elicited by the greater intensity of the principal PAS-TMS pulse, had shifted the optimal temporal window of an LTD-like effect in the CS3-PAS101.3RMTadj condition. According to this idea, CS3-PAS101.3RMTadj would not be informative about the role of specific I-waves in PAS10-induced depression because the decisive postsynaptic signal would be advanced to the newly emerged D-wave, away from the sensory signal. If this were the case, then moving the timing of the D-wave closer to the estimated appearance of the sensory signal in M1 would re-install the depressant effect of PAS. Therefore, CS3-PAS1.3RMTadj was tested with an ISI of 14 ms (CS-PAS141.3RMTadj). We reasoned that at this timing the hypothetical D-wave would occur at a similar timing to the I3-wave in CS3-PAS1.3RMTadj. CS3-PAS141.3RMTadj did not result in a significant excitability change, neither immediately after termination of the intervention, nor at any later time epoch (T1, +5.1 ± 20%; T2, −3.1 ± 11%; T3, −2.6 ± 9%; T4, −7 ± 15%; repeated measures ANOVA ‘Time’F(4,24)= 2.451, P= 0.073). Thus, the results of control experiment 2 argue against the possibility that the lack of an excitability depressant effect in the CS3-PAS101.3RMTadj condition might have been due to a shift of the optimal temporal window by the enhanced principal PAS-TMS pulse.
The result of this series of experiments suggested that the activity of the CSN was not the decisive factor responsible for the PAS10 depressant effects. In particular, the experiments suggested that the blockade of the depressant effects of PAS10 by adding a conditioning pulse 3 ms before the principal TMS pulse was not mediated by inhibition of the CSN. An alternative explanation would be that the CS3-PAS101.3RMT was ineffective because the conditioning pulse had blocked an excitatory connection presynaptic to the CSN. Previous findings have demonstrated that a subthreshold conditioning TMS pulse reduces the size of late I-waves, which are believed to reflect CSN activation related to the activity of excitatory neurons located in superficial cortical layers (Di Lazzaro et al. 2008). It is possible, therefore, that the blockade of depressant PAS10 effects was mediated by inhibition of interneuronal activity related to late I-wave activity. However, this hypothesis would be refuted if the activity of these excitatory interneurons could be restored by enhancing the intensity of the principal TMS pulse (as done in CS3-PAS101.3RMTadj). The effects of enhancing the intensity of the principal TMS pulse in the presence of a subthreshold conditioning TMS pulse are not known. Therefore, we addressed this question in the subsequent experiment using epidural recordings in a surgical patient.
Effect of increasing the strength of a TMS pulse in the presence of a subthreshold TMS pulse on I-waves recorded epidurally (Expt 2b)
Single pulse TMS with a lateral-to-medial-induced current in the brain evoked the earliest descending wave with a latency of 2.6 ms (Fig. 5). Based on considerations described elsewhere (Di Lazzaro et al. 2012) we considered this wave a D-wave originating from the direct activation of the corticospinal axons. Single pulse TMS with a posterior-to-anterior-induced current in the brain evoked an MEP and three descending waves at epidural level (Fig. 5). The earliest descending wave evoked by this type of stimulation had a latency of 3.7 ms, i.e. 1.1 ms longer than the latency of the D-wave evoked by lateral-to-medial TMS. We termed this wave I1, and numbered the following I-waves in order of their appearance (Di Lazzaro et al. 2012). Conditioning the TMS pulse by a subthreshold TMS pulse delivered 3 ms beforehand led to suppression of the MEP by 46% and to complete suppression of the I3-wave (Fig. 5). Subsequently, in paired pulse stimulation the intensity of the test stimulus was adjusted in order to obtain an MEP of the same amplitude as that recorded using single pulse TMS. This was achieved by increasing the stimulus intensity from 110% to 125% of RMT. Conditioned stimulation evoked three descending waves. The first volley (absent in single pulse posterior-to-anterior TMS) corresponded in latency to the first wave with lateral-to-medial-induced current and was therefore probably a D-wave. The D-wave was followed by two I-waves (I1 and I2), whereas the I3-wave was no longer present (Fig. 5). The MEP evoked by conditioned TMS had a shorter latency when compared with the MEP evoked by single pulse posterior-to-anterior stimulation (22.5 ms instead of 23.8 ms), in agreement with the appearance of the D-wave in epidural recordings. Thus, the volleys evoked by single pulse and conditioned TMS were substantially different, even though the MEPs were matched in amplitude. In a similar experiment, Ni and co-workers (2011) found that the amplitude of the I3-wave was reduced in the presence of a conditioning pulse delivered 2 ms before the principal TMS pulse. The I3-wave remained partially suppressed when the PAS-TMS pulse intensity was increased in order to obtain an MEP of the original size.
Figure 5. Effect of increasing the strength of a TMS pulse in the presence of a subthreshold TMS pulse, on I-waves recorded epidurally (Expt 2b).

Corticospinal volleys (left) and MEPs (right) evoked by single pulse and conditioned TMS. A, single pulse TMS (grey line); conditioned TMS with unadjusted intensity of principal TMS pulse (dotted black line). B, single pulse TMS (grey line, same as in A); conditioned TMS with intensity of principal TMS pulse adjusted to match the amplitude of MEP evoked by single pulse TMS (continuous black line). Insets: black triangle, principal TMS pulse delivered to the primary motor cortex; small open triangle, conditioning TMS pulse preceding the principal TMS pulse at 3 ms; large black triangle, TMS pulse adjusted to match the amplitude of MEP evoked by single pulse TMS. Single pulse TMS evoked three I-waves, whereas conditioned TMS evoked a large D-wave and only I1- and I2-waves, irrespective of the magnitude of the principal TMS pulse. The latency of the MEP evoked by conditioned TMS with adjusted test pulse was shorter by 1.7 ms than the latency of MEPs evoked by single pulse TMS.
Effect of variations in the properties of the TMS component during PAS on short-latency inhibition in centre/surround representations (Expt 3)
TMS at (0.95–1.3) × RMT (Expt 2) activates both excitatory and inhibitory intracortical elements and leads to activation of corticospinal projection neurons, even in the absence of MEPs (Di Lazzaro et al. 2012). Some activity in corticospinal projection neurons may still be present even at 0.8 × RMT (Di Lazzaro et al. 2012). Therefore, this series of experiments was designed to (i) re-examine the hypothesis that PAS10-induced centre-depressant effects on corticospinal excitability may be related to repetitive pairings of inhibitory intereurons with afferent pulses, or (ii) to changes of intracortical inhibition. We hypothesized that preferential activation of inhibitory interneurons by PAS performed with the PAS TMS pulse set at an intensity subthreshold for eliciting descending activity (PAS100.7RMT) might provide important evidence for an effect mediated by inhibitory interneurons if, for example, PAS100.7RMT resulted in depressant effects on APB MEPs, or by changes in SICI.
MEP amplitudes of the APB changed as a function of Intervention (ANOVA; Time (pre, post) × Intervention (PAS101.3RMT, CS3-PAS101.3RMT, PAS100.7RMT), F(2,114)= 4.369, P= 0.015; Fig. 6). Following PAS101.3RMT MEP amplitudes decreased in APB (−14.8 ± 17.9%, P < 0.001; Fig. 6) in agreement with Expts 1 and 2. Following PAS100.7RMT (−0.3 ± 16.0%, P= 0.928), or CS3-PAS101.3RMT (−3.0 ± 15.8%, P= 0.401) MEP amplitudes remained unchanged in APB.
Figure 6. Effect of variations of properties of the TMS component during PAS on corticospinal excitability in centre/surround representations (Expt 3).

A, top row, symbols refer to different variants of PAS10 used in Expt 3 as described in Table 1. Group data of the changes of the normalized MEP amplitudes of the APB (horizontal stripes) and ADM (vertical stripes) + SEM (black bars) following different PAS variants. §Significant change from baseline. Asterisks indicate significant difference between different PAS10 variants. B, MEP amplitudes from a representative subject before (black) and following PAS (red). Right vertical bars represent calibration bars (0.5 mV). All baseline MEPs are scaled to the same size for better comparison between different interventions.
CR3 did not change as a function of Intervention (ANOVA, Intervention (PAS101.3RMT, CS3-PAS101.3RMT, PAS100.7RMT) × Time (pre, post), F(2,114)= 0.561, P= 0.572; Fig. 7). Because CR3 was found to be increased (SICI decreased) in previous studies following PAS101.3RMT (Russmann et al. 2009; Di Lazzaro et al. 2011), an exploratory analysis on changes of CR3 was performed. CR3 was increased (SICI decreased) in APB after PAS101.3RMT (pre 0.40 ± 0.22, post 0.52 ± 0.28, P= 0.010; Fig. 7A), in agreement with Russmann et al. (2009) and Di Lazzaro et al. (2011). CR3 of the APB remained unchanged after PAS100.7RMT (pre 0.40 ± 0.23, post 0.41 ± 0.20, P= 0.702) and after CS3-PAS101.3RMT (pre 0.38 ± 0.26, post 0.40 ± 0.24, P= 0.327).
Figure 7. Effect of variations of properties of the TMS component during PAS on SICI in centre/surround representations (Expt 3).

CR3, mean MEP amplitudes from the APB (A, horizontal stripes) and ADM (B, vertical stripes) + SEM (black bars) conditioned by a subthreshold TMS pulse (ISI 3 ms), normalized to the mean amplitude of the unconditioned test responses before (white striped columns) and after (grey striped columns) interventions with different PAS variants. Asterisk indicates significant change.
The differential effect of PAS10 interventions on MEP amplitudes recorded from APB and ADM was examined by performing a three-way ANOVA (Intervention (PAS101.3RMT, PAS100.7RMT, CS3-PAS101.3RMT) × Muscle (APB, ADM) × Time (pre, post)). MEP amplitude of APB and ADM muscle changed time- and muscle-dependently as a function of the protocol (Intervention × Muscle × Time, F(2,228)= 6.336, P= 0.002). Post hoc testing revealed that, following PAS101.3RMT, MEP amplitudes increased in ADM (+15.5 ± 26.4%, P= 0.012; Fig. 6), in agreement with previous studies (Weise et al. 2006, 2011), but at variance from Russmann and coworkers (2009). Following PAS100.7RMT (+2.5 ± 22.3%, P= 0.622), or CS3-PAS101.3RMT (+0.8 ± 17.4%, P= 0.848), MEP amplitudes remained unchanged in ADM. Thus, in the present experiments, PAS10-induced surround-facilitatory effects did not emerge in the absence of centre-depressant effects.
Similarly, the differential effect of PAS10 interventions on CR3 responses recorded from APB and ADM was examined by performing a three-way ANOVA (Intervention (PAS101.3RMT; PAS100.7RMT; CS3-PAS101.3RMT) × Muscle (APB; ADM) × Time (pre, post)). No triple-interaction effect was found (F(2,228)= 0.574, P= 0.564). In an exploratory analysis, following PAS101.3RMT CR3 remained unchanged in ADM (pre 0.39 ± 0.22, post 0.40 ± 0.25, P= 0.890; Fig. 7B) confirming Russmann and coworkers (2009).
We further addressed the question of whether surround facilitation was related to reduction of inhibitory activity as seen in APB representation (increase of CR3 and decrease of SICI, respectively, in APB following PAS101.3RMT, as described above). Following PAS101.3RMT, CR3 change in APB was not correlated with MEP amplitude change in ADM (Pearson's correlation r= 0.005, P= 0.982). Similarly, although CR3 in ADM remained unchanged after PAS101.3RMT, it remains a possibility that PAS101.3RMT-induced surround facilitation was related to reduction of inhibitory activity as seen in ADM representation (see above). Following PAS101.3RMT, CR3 change in ADM was not correlated with MEP amplitude change in ADM (r= 0.035, P= 0.884). Therefore, we did not find evidence suggesting that surround facilitation was mediated by intracortical inhibition as tested by paired TMS pulses.
Discussion
The principal goal of the study was to gain further insight into the physiological mechanisms governing depressant effects induced by associative stimulation of the human motor cortex and to develop a unifying model of PAS based on the present and previous findings (Elahi et al. 2012).
PAS-induced centre-depressant effects are probably located at excitatory synapses between cortical principal neurons
Inhibitory synapses can undergo potentiation and depression by correlated Hebbian activation (Caporale & Dan, 2008). Although changing the efficacy of most inhibitory synapses by associative activity is governed by symmetrical time windows, at some inhibitory synapses strengthening occurs after repetitive post→pre activation, a temporal rule reverse of that governing excitatory synapses (Caporale & Dan, 2008). At ISI = 10 ms, post→pre activation of intracortical GABAergic inhibitory interneurons at near-synchronicity with afferent activity may theoretically contribute to lasting effects on corticospinal excitability as the size of MEPs is determined by the net effects of excitatory and inhibitory elements activated by TMS (Hallett, 2007). PAS100.7RMT and PAS100.8RMT, which powerfully activate intracortical inhibitory circuits (Kujirai et al. 1993; Ilic et al. 2002), had no effect on the amplitude of subsequently evoked MEPs suggesting that pre→post associative activation of intracortical GABAergic inhibitory interneurons, if it were to strengthen inhibitory synapses, is not sufficient to induce lasting effects on corticospinal excitability. We also found that PAS100.7RMT did not enhance SICI (decrease CR3) as tested with double-pulse TMS (Kujirai et al. 1993). Hence, although some lasting effects may be induced by PAS10 in inhibitory cortical circuits (decrease of SICI (increase of CR3) after PAS101.3RMT, in agreement with Russmann et al. (2009) and Di Lazzaro et al. (2011)), the depressant PAS effect on corticospinal excitability is more likely to result from changes within the chain of glutamatergic connections between excitatory neurons. However, the contribution of inhibitory mechanisms other than those activated at subthreshold magnetic stimulation intensities and other than those underlying SICI remains a theoretical possibility.
Inhibition regulates PAS-induced depressant effects
The window within which interaction between the two stimulus modalities led to an immediate depressant PAS effect was less than 4.5 ms wide. Even though we cannot rule out the possibility that some depressant effect may have emerged at some delay after the termination of PAS performed with slightly different intervals, this window is much less wide than the window of LTD induction in in vitro STDP studies. For instance, LTD is produced in layer 2/3 (L2/3) and L5 pyramidal cells in vitro when postsynaptic spikes lead presynaptic spikes by up to 20–50 ms (Markram et al. 1997; Feldman, 2000; Sjöström et al. 2001; Froemke & Dan, 2002). This window, however, may be up to 100 ms wide (Dan & Poo, 2006; Caporale & Dan, 2008). One explanation for the narrow width of the time window may lie in the fact that afferent signals may reach M1 via multiple pathways with different conduction times (cf. Hamada et al. 2012), possibly inducing overlapping effects of opposite direction. Activation of GABAergic inhibition, an unavoidable accompaniment of TMS-induced neuronal activation (Hallett, 2007), may provide an alternative, or complementary explanation. Concomitant inhibitory activity (Jacob et al. 2007) may shorten the range of post→pre delays that drive synaptic depression in vivo (Feldman, 2000; Celikel et al. 2004), a conclusion also emerging from experimental (Nishiyama et al. 2010) and modelling (Cutsuridis, 2011) STDP studies. The narrow window may suggest that an oligosynaptic mechanism is involved in constraining the effective window of interaction, similar to the disynaptic somatic inhibition that secures temporal fidelity of action potential generation in pyramidal neurons (Pouille & Scanziani, 2001).
Support for direct involvement of inhibition in regulating PAS10-induced depressant effects was derived from the observation that depressant effects were abolished when a conditioning subthreshold TMS pulse was applied 3 ms each time before the principal TMS pulse as part of the PAS intervention was delivered (CS3-PAS10). Elahi and coworkers (2012) found that PAS-induced facilitatory effects may similarly be blocked, by way of delivering a subthreshold TMS pulse before the principal TMS pulse (‘CS3-PAS25’). Of note, whereas the intervals related to afferent stimulation differ between the two protocols (CS3-PAS10, this study, and CS3-PAS25, Elahi et al. 2012), in both of them the conditioning TMS pulse precedes the principal TMS pulse by the same interval. Therefore, the blocking effect of the subthreshold TMS pulse is probably mediated by its effect on events generated by the principal TMS pulse. The depressant effect of a conditioning TMS pulse on MEP evoked by a suprathreshold TMS pulse released 3 ms later is thought to be due to GABAergic inhibition acting at postsynaptic GABAA receptors (Ziemann et al. 1996; Werhahn et al. 1999) located on intracortical principal neurons. Therefore, the present findings provide strong evidence to suggest that PAS-induced effects are tightly controlled by GABAergic inhibition of events set up by the principal TMS pulse during the intervention, to the extent that GABAergic inhibition may gate these effects. A study by Delvendahl and colleagues (2010) reported blockade of the excitability depressant effect of PAS after prolonged repetitive (0.1 Hz) magnetic stimulation. Low frequency magnetic stimulation was found to enhance GABAergic inhibition, as tested by short-latency paired-TMS pulse inhibition in the study by Delvendahl et al. (2010), but not in others (Heide et al. 2006; Bashir et al. 2011). Therefore, the evidence linking blockade of PAS effects to enhanced GABAergic inhibition was not clear. Similarly, pharmacological enhancement of GABAergic inhibition via binding to the α1-subunit of the GABAA complex, by the non-benzodiazepine hypnotic zolpidem, blocked the PAS-induced depressant effects (Fuhl et al. 2012). However, because other GABAergic agents such as alprazolam did not block PAS-induced depressant effects (Fuhl et al. 2012), the evidence concerning GABA-mediated inhibition was not conclusive. Therefore, the present experiments along with those of Elahi and co-workers (2012) appear to provide strong support for the conclusion that modulatory effects induced by PAS are tightly controlled by GABAergic inhibition. Whilst several in vitro studies have indicated that LTP formation at excitatory synapses is gated by inhibitory interneurons (Wigström & Gustafsson, 1986; Caporale & Dan, 2008), similarly powerful inhibitory gating of LTD formation appears to be a new and surprising finding.
PAS-induced centre-depressant effects are unlikely to depend on activity of corticospinal neurons
PAS101.3RMT, but not CS3-PAS101.3RMTadj, induced depressant effects, despite the fact that both protocols produced matching MEP responses. Furthermore, PAS100.95RMT induced a depressant effect that was at least as strong as that induced by PAS101.3RMT although there is little descending corticospinal tract activity at an intensity of 0.95 × RMT (Di Lazzaro et al. 2012). Dissimilar effects with similar descending activity and similar effects with dissimilar descending activity locate PAS10-induced effects upstream of the spinal cord, supporting previous conclusions (Wolters et al. 2003).
In STDP, the postsynaptic signal is thought to be represented by a backpropagating action potential (BAP, Magee & Johnston, 1997; Markram et al. 1997). So far, it is not clear whether the BAPs of the CSN, or of some other pyramidal cell provide the necessary postsynaptic signal to the afferent input in PAS10. A clue might be provided by the findings that CS3-PAS10 remained ineffective even when the principal TMS pulse was increased to generate an MEP of the original size (Expt 2a) and that, under this condition, the I3-wave remained suppressed (Expt 2b). The fact that the analysis of I-wave responses was drawn from the recordings obtained in a single patient represents a limitation of the present study. However, our findings and conclusions gain support from an experiment in which Ni and co-workers (2011), using a slightly different conditioning–test protocol, found sustained partial suppression of the I3-wave when the test pulse intensity was adjusted. Blockade of I3-waves by a conditioning TMS indicates that no corresponding somatic action potential (and BAP) has been generated at this timing by either the CSN or the pyramidal cell driving it. Because BAPs may have invaded the CSN's dendrites only ∼1.3 ms earlier, at the latency of the I2-wave, the timing of coupling of pre- and postsynaptic events would still have allowed for effective interaction. Therefore, it is not the absence of CSN activity, but the absence of activity of the pyramidal cell driving the CSN to fire at I3-wave latency, which probably underlies blockade of PAS10-induced depressant effects. The contention that activity in CSN is not critically important for synaptic modifications is also supported by the fact that PAS100.95RMT was as effective as conventional PAS10. I-waves later than I1 or I2 rely on superficial cortical elements (Amassian et al. 1987; for review see Di Lazzaro et al. 2008, 2012). From these considerations, we suggest that BAPs relevant to modulating excitatory synapses are probably generated by pyramidal cells located in L2/3. Input from somatosensory cortex preferentially impinges onto L2/3 neurons but much less onto L5 CSN (Mao et al. 2011) and synapses from somatosensory cortex projections onto L2/3 neurons in motor cortex are crucially involved in learning new motor skills (Pavlides et al. 1993; Rioult-Pedotti et al. 1998). Therefore, the above conclusions may be relevant for understanding mechanisms related to motor learning. LTD-like processes are probably equally as important as LTP for the storing of information (Massey & Bashir, 2007; Griffiths et al. 2008), although they are frequently neglected in studies of motor learning and human pathophysiological studies. Figure 8 provides a grossly simplified model accounting for depressant effects of PAS that is also consistent with findings on facilitatory PAS (Elahi et al. 2012). The model assumes that sensory input arrives in human M1 layer 2/3. Strong sensory input to layer 2/3 motor neurons has been shown in rodents (Mao et al. 2011) and in cats (Kaneko et al. 1994). Although these observations may suggest a general functional anatomical motor cortical design in mammals, the exact anatomy of short-latency sensory afferents within the human motor cortex (Goldring & Ratcheson, 1972) is not known.
Figure 8. Greatly simplified cortical model illustrating microcircuit mechanisms involved in, and governing PAS-induced depressant effects on MEP amplitudes.

A TMS pulse excites neuron S1 providing direct excitatory synaptic input to neuron M whose activity is necessary for inducing action potentials in the CSNs visible in the I(2 +n)-waves. Somatosensory afferent information from cortico-cortical or thalamocortical fibres (S2) also provides excitatory input to neuron M. M additionally receives input from an inhibitory interneuron which receives low-threshold excitatory input from TMS and represents the essential element underlying SICI. Activation of the synapse between S1 and the dendrite of M may contribute to firing M and eventually be followed by an action potential backpropagating into M's dendritic tree. The synapse between S1 and the dendrite of M will be weakened if the BAP leads an excitatory postsynaptic potential generated by activation of S2. Because a BAP is needed for weakening effects at the S1–M synapse, the time window for effective interaction between events induced by S1 and S2 is limited by the time latency needed to produce effective inhibition of M (equivalent to at least two interposed synaptic delays). Note that the S1–M synapse undergoing PAS-induced changes is neither part of the CSN nor involved in the inhibitory circuit and also independent of the pathway conveying afferent activity to M. M is prevented from firing an action potential if intracortical inhibition is activated by a conditioning subthreshold TMS pulse released 3 ms before activation of S1. In particular, in this case no BAP will invade M's dendritic tree. Grey box, neuronal elements participating in generating the I3-wave. Synapse between principal neurons undergoing PAS-induced weakening is highlighted by circle in light grey. Roman numerals refer to cortical layers.
Mechanisms of PAS-induced surround facilitation
PAS-induced depression of corticospinal excitability in APB was accompanied by enhancement of corticospinal excitability in ADM. Facilitation in a functionally separated muscle representation not corresponding to the cutaneous region innervated by the median nerve (‘surround facilitation’) is in agreement with previous observations (Weise et al. 2006, 2011). The fact that surround facilitation exhibited the same physiological response pattern as centre-depressant effects may indicate that the mechanisms causing them are interrelated. CSNs projecting to ADM muscle are intermingled with those projecting to APB (Schieber, 2001; Rathelot & Strick, 2006). Therefore, the surround-facilitatory effect cannot be explained by assuming an extra time needed for conduction of afferent activity along a longer pathway to an anatomically distant representation. Conceivably, activation of L5 pyramidal neurons, following excitation of L2/3 neurons (Anderson et al. 2010) by TMS may have been transmitted onto neighbouring L2/3 neurons (Weiler et al. 2008), thereby providing the necessary pre–post sequence for LTP generation in synapses onto neurons projecting to the functional surround. This scenario would put the origin of surround facilitation in the cortex. However, late I-waves are suppressed after PAS10 (Di Lazzaro et al. 2009). An L2/3 origin of surround facilitation would be difficult to reconcile with this observation, as epidural recordings do not only reflect outgoing CSN activity from the centre representation alone. Therefore, the possibility exists that surround facilitation arises from activity related to I1- or I2-waves, or has a subcortical origin.
The usage of different principal PAS10 protocols in different experiments represents a limitation of the present study. However, in all experiments the principal PAS10 condition, against which all other experimental conditions were compared, was effective in generating excitability-depressant effects of similar magnitude. We, therefore, consider it unlikely that the main conclusions are affected by differences in the principal PAS10 protocol.
Taken together, our results provide evidence that PAS10-induced centre-depressant effects are located at an excitatory synapse in upper cortical layers onto a principal excitatory neuron which is distinct from CSNs and which is under tight inhibitory control. Mechanisms governing surround-facilitatory effects appear to be gated by the same mechanism.
Acknowledgments
The assistance of Fabio Pizzolato, PhD, in some of the experiments is gratefully acknowledged. Some results of the study are part of the MD thesis of K.E. We thank Jens Eilers, Department of Physiology, University of Leipzig, for helpful discussions and suggestions.
Glossary
- ADM
abductor digiti minimi muscle
- AMT
active motor threshold
- APB
abductor pollicis brevis muscle
- BAP
backpropagating action potential
- CR
conditioned response
- CS
conditioning stimulus
- CSN
corticospinal neuron
- Expt
experiment
- FDI
first dorsal interosseous muscle
- FDRC
false discovery rate correction
- ISI
interstimulus interval
- L2/3
layer 2/3
- L5
layer 5
- LTD
long-term depression
- LTP
long-term potentiation
- M1
primary motor cortex
- MEP
motor-evoked potential
- MN
median nerve
- PAS
paired associative stimulation
- PAS10
paired associative stimulation with an interstimulus interval of 10 ms
- RMT
resting motor threshold
- SICI
short interval intracortical inhibition
- SSEP
somatosensory-evoked potential
- STDP
spike-timing-dependent plasticity
- TMS
transcranial magnetic stimulation
Additional information
Competing interests
The authors declare that they have no potential conflict of interest.
Author contributions
D.W., M.R. and J.C. designed and supervised the project. D.W., J.M., M.R., K.E., M.H. and J.-J.R. conducted the non-invasive TMS experiments. V.DiL., P.M. and F.R. conducted the surgical TMS experiments. D.W. and J.C. performed statistical analyses. D.W. and J.C. wrote the manuscript. All authors critically revised the manuscript for important intellectual content. All authors approved the final version of the manuscript. The experiments were performed at the Dept. of Neurology of the University of Leipzig, Würzburg and Rome.
Funding
This study was supported, in part, by Deutsche Forschung- sgemeinschaft Grant Cl 95/8-1.
References
- Amassian VE, Stewart M, Quirk GJ, Rosenthal JL. Physiological basis of motor effects of a transient stimulus to cerebral cortex. Neurosurgery. 1987;20:74–93. [PubMed] [Google Scholar]
- Anderson CT, Sheets PL, Kiritani T, Shepherd GM. Sublayer-specific microcircuits of corticospinal and corticostriatal neurons in motor cortex. Nat Neurosci. 2010;13:739–744. doi: 10.1038/nn.2538. [DOI] [PMC free article] [PubMed] [Google Scholar]
- Bashir S, Edwards D, Pascual-Leone A. Neuronavigation increases the physiologic and behavioral effects of low-frequency rTMS of primary motor cortex in healthy subjects. Brain Topogr. 2011;24:54–64. doi: 10.1007/s10548-010-0165-7. [DOI] [PMC free article] [PubMed] [Google Scholar]
- Born RT. Center-surround interactions in the middle temporal visual area of the owl monkey. J Neurophysiol. 2000;84:2658–2669. doi: 10.1152/jn.2000.84.5.2658. [DOI] [PubMed] [Google Scholar]
- Caporale N, Dan Y. Spike timing-dependent plasticity: a Hebbian learning rule. Annu Rev Neurosci. 2008;31:25–46. doi: 10.1146/annurev.neuro.31.060407.125639. [DOI] [PubMed] [Google Scholar]
- Cavanaugh JR, Bair W, Movshon JA. Selectivity and spatial distribution of signals from the receptive field surround in macaque V1 neurons. J Neurophysiol. 2002;88:2547–2556. doi: 10.1152/jn.00693.2001. [DOI] [PubMed] [Google Scholar]
- Celikel T, Szostak VA, Feldman DE. Modulation of spike timing by sensory deprivation during induction of cortical map plasticity. Nat Neurosci. 2004;7:534–541. doi: 10.1038/nn1222. [DOI] [PMC free article] [PubMed] [Google Scholar]
- Chen R, Tam A, Butefisch C, Corwell B, Ziemann U, Rothwell JC, Cohen LG. Intracortical inhibition and facilitation in different representations of the human motor cortex. J Neurophysiol. 1998;80:2870–2881. doi: 10.1152/jn.1998.80.6.2870. [DOI] [PubMed] [Google Scholar]
- Curran-Everett D. Multiple comparisons: philosophies and illustrations. Am J Physiol Regul Integr Comp Physiol. 2000;279:R1–R8. doi: 10.1152/ajpregu.2000.279.1.R1. [DOI] [PubMed] [Google Scholar]
- Cutsuridis V. GABA inhibition modulates NMDA-R mediated spike timing dependent plasticity (STDP) in a biophysical model. Neural Netw. 2011;24:29–42. doi: 10.1016/j.neunet.2010.08.005. [DOI] [PubMed] [Google Scholar]
- Dan Y, Poo MM. Spike timing-dependent plasticity of neural circuits. Neuron. 2004;44:23–30. doi: 10.1016/j.neuron.2004.09.007. [DOI] [PubMed] [Google Scholar]
- Dan Y, Poo MM. Spike timing-dependent plasticity: from synapse to perception. Physiol Rev. 2006;86:1033–1048. doi: 10.1152/physrev.00030.2005. [DOI] [PubMed] [Google Scholar]
- Delvendahl I, Jung NH, Mainberger F, Kuhnke NG, Cronjaeger M, Mall V. Occlusion of bidirectional plasticity by preceding low-frequency stimulation in the human motor cortex. Clin Neurophysiol. 2010;121:594–602. doi: 10.1016/j.clinph.2009.09.034. [DOI] [PubMed] [Google Scholar]
- Di Lazzaro V, Dileone M, Pilato F, Capone F, Musumeci G, Ranieri F, Ricci V, Bria P, Di Iorio R, de Waure C, Pasqualetti P, Profice P. Modulation of motor cortex neuronal networks by rTMS: comparison of local and remote effects of six different protocols of stimulation. J Neurophysiol. 2011;105:2150–2156. doi: 10.1152/jn.00781.2010. [DOI] [PubMed] [Google Scholar]
- Di Lazzaro V, Dileone M, Profice P, Pilato F, Oliviero A, Mazzone P, Di Iorio R, Capone F, Ranieri F, Florio L, Tonali PA. LTD-like plasticity induced by paired associative stimulation: direct evidence in humans. Exp Brain Res. 2009;194:661–664. doi: 10.1007/s00221-009-1774-9. [DOI] [PubMed] [Google Scholar]
- Di Lazzaro V, Profice P, Ranieri F, Capone F, Dileone M, Oliviero A, Pilato F. I-wave origin and modulation. Brain Stimul. 2012;5:512–525. doi: 10.1016/j.brs.2011.07.008. [DOI] [PubMed] [Google Scholar]
- Di Lazzaro V, Restuccia D, Oliviero A, Profice P, Ferrara L, Insola A, Mazzone P, Tonali P, Rothwell JC. Magnetic transcranial stimulation at intensities below active motor threshold activates intracortical inhibitory circuits. Exp Brain Res. 1998;119:265–268. doi: 10.1007/s002210050341. [DOI] [PubMed] [Google Scholar]
- Di Lazzaro V, Ziemann U, Lemon RN. State of the art: Physiology of transcranial motor cortex stimulation. Brain Stimul. 2008;1:345–362. doi: 10.1016/j.brs.2008.07.004. [DOI] [PubMed] [Google Scholar]
- Elahi B, Gunraj C, Chen R. Short-interval intracortical inhibition blocks long-term potentiation induced by paired associative stimulation. J Neurophysiol. 2012;107:1935–1941. doi: 10.1152/jn.00202.2011. [DOI] [PubMed] [Google Scholar]
- Feldman DE. Timing-based LTP and LTD at vertical inputs to layer II/III pyramidal cells in rat barrel cortex. Neuron. 2000;27:45–56. doi: 10.1016/s0896-6273(00)00008-8. [DOI] [PubMed] [Google Scholar]
- Froemke RC, Dan Y. Spike-timing-dependent synaptic modification induced by natural spike trains. Nature. 2002;416:433–438. doi: 10.1038/416433a. [DOI] [PubMed] [Google Scholar]
- Fuhl A, Müller-Dahlhaus F, Möller C, Ziemann U. Effects of modulators at different subtypes of GABAA receptors on LTD-like plasticity in the human motor cortex. Klin Neurophysiol. 2012;43:V161. [Google Scholar]
- Goldring S, Ratcheson R. Human motor cortex: sensory input data from single neuron recordings. Science. 1972;175:1493–1495. doi: 10.1126/science.175.4029.1493. [DOI] [PubMed] [Google Scholar]
- Griffiths S, Scott H, Glover C, Bienemann A, Ghorbel MT, Uney J, Brown MW, Warburton EC, Bashir ZI. Expression of long-term depression underlies visual recognition memory. Neuron. 2008;58:186–194. doi: 10.1016/j.neuron.2008.02.022. [DOI] [PubMed] [Google Scholar]
- Hallett M. Transcranial magnetic stimulation: a primer. Neuron. 2007;55:187–199. doi: 10.1016/j.neuron.2007.06.026. [DOI] [PubMed] [Google Scholar]
- Hamada M, Strigaro G, Murase N, Sadnicka A, Galea JM, Edwards MJ, Rothwell JC. Cerebellar modulation of human associative plasticity. J Physiol. 2012;590:2365–2374. doi: 10.1113/jphysiol.2012.230540. [DOI] [PMC free article] [PubMed] [Google Scholar]
- Heide G, Witte OW, Ziemann U. Physiology of modulation of motor cortex excitability by low-frequency suprathreshold repetitive transcranial magnetic stimulation. Exp Brain Res. 2006;171:26–34. doi: 10.1007/s00221-005-0262-0. [DOI] [PubMed] [Google Scholar]
- Holmgren CD, Zilberter Y. Coincident spiking activity induces long-term changes in inhibition of neocortical pyramidal cells. J Neurosci. 2001;21:8270–8277. doi: 10.1523/JNEUROSCI.21-20-08270.2001. [DOI] [PMC free article] [PubMed] [Google Scholar]
- Ilic TV, Meintzschel F, Cleff U, Ruge D, Kessler KR, Ziemann U. Short-interval paired-pulse inhibition and facilitation of human motor cortex: the dimension of stimulus intensity. J Physiol. 2002;545:153–167. doi: 10.1113/jphysiol.2002.030122. [DOI] [PMC free article] [PubMed] [Google Scholar]
- Jacob V, Brasier DJ, Erchova I, Feldman D, Shulz DE. Spike timing-dependent synaptic depression in the in vivo barrel cortex of the rat. J Neurosci. 2007;27:1271–1284. doi: 10.1523/JNEUROSCI.4264-06.2007. [DOI] [PMC free article] [PubMed] [Google Scholar]
- Kaneko T, Caria MA, Asanuma H. Information processing within the motor cortex. II. Intracortical connections between neurons receiving somatosensory cortical input and motor output neurons of the cortex. J Comp Neurol. 1994;345:172–184. doi: 10.1002/cne.903450203. [DOI] [PubMed] [Google Scholar]
- Klein T, Magerl W, Hopf HC, Sandkuhler J, Treede RD. Perceptual correlates of nociceptive long-term potentiation and long-term depression in humans. J Neurosci. 2004;24:964–971. doi: 10.1523/JNEUROSCI.1222-03.2004. [DOI] [PMC free article] [PubMed] [Google Scholar]
- Kujirai T, Caramia MD, Rothwell JC, Day BL, Thompson PD, Ferbert A, Wroe S, Asselman P, Marsden CD. Corticocortical inhibition in human motor cortex. J Physiol. 1993;471:501–519. doi: 10.1113/jphysiol.1993.sp019912. [DOI] [PMC free article] [PubMed] [Google Scholar]
- Magee JC, Johnston D. A synaptically controlled, associative signal for Hebbian plasticity in hippocampal neurons. Science. 1997;275:209–213. doi: 10.1126/science.275.5297.209. [DOI] [PubMed] [Google Scholar]
- Mao T, Kusefoglu D, Hooks BM, Huber D, Petreanu L, Svoboda K. Long-range neuronal circuits underlying the interaction between sensory and motor cortex. Neuron. 2011;72:111–123. doi: 10.1016/j.neuron.2011.07.029. [DOI] [PMC free article] [PubMed] [Google Scholar]
- Markram H, Lübke J, Frotscher M, Sakmann B. Regulation of synaptic efficacy by coincidence of postsynaptic APs and EPSPs. Science. 1997;275:213–215. doi: 10.1126/science.275.5297.213. [DOI] [PubMed] [Google Scholar]
- Massey PV, Bashir ZI. Long-term depression: multiple forms and implications for brain function. Trends Neurosci. 2007;30:176–184. doi: 10.1016/j.tins.2007.02.005. [DOI] [PubMed] [Google Scholar]
- Müller-Dahlhaus F, Ziemann U, Classen J. Plasticity resembling spike-timing dependent synaptic plasticity: the evidence in human cortex. Front Synaptic Neurosci. 2010;2:34. doi: 10.3389/fnsyn.2010.00034. [DOI] [PMC free article] [PubMed] [Google Scholar]
- Ni Z, Gunraj C, Wagle-Shukla A, Udupa K, Mazzella F, Lozano AM, Chen R. Direct demonstration of inhibitory interactions between long interval intracortical inhibition and short interval intracortical inhibition. J Physiol. 2011;589:2955–2962. doi: 10.1113/jphysiol.2011.207928. [DOI] [PMC free article] [PubMed] [Google Scholar]
- Nishiyama M, Togashi K, Aihara T, Hong K. GABAergic activities control spike timing- and frequency-dependent long-term depression at hippocampal excitatory synapses. Front Synaptic Neurosci. 2010;2:22. doi: 10.3389/fnsyn.2010.00022. [DOI] [PMC free article] [PubMed] [Google Scholar]
- Nuwer MR, Aminoff M, Desmedt J, Eisen AA, Goodin D, Matsuoka S, Mauguiere F, Shibasaki H, Sutherling W, Vibert JF. IFCN recommended standards for short latency somatosensory evoked potentials. Report of an IFCN committee. International Federation of Clinical Neurophysiology. Electroencephalogr Clin Neurophysiol. 1994;91:6–11. doi: 10.1016/0013-4694(94)90012-4. [DOI] [PubMed] [Google Scholar]
- Pavlides C, Miyashita E, Asanuma H. Projection from the sensory to the motor cortex is important in learning motor skills in the monkey. J Neurophysiol. 1993;70:733–741. doi: 10.1152/jn.1993.70.2.733. [DOI] [PubMed] [Google Scholar]
- Pouille F, Scanziani M. Enforcement of temporal fidelity in pyramidal cells by somatic feed-forward inhibition. Science. 2001;293:1159–1163. doi: 10.1126/science.1060342. [DOI] [PubMed] [Google Scholar]
- Rathelot JA, Strick PL. Muscle representation in the macaque motor cortex: an anatomical perspective. Proc Natl Acad Sci U S A. 2006;103:8257–8262. doi: 10.1073/pnas.0602933103. [DOI] [PMC free article] [PubMed] [Google Scholar]
- Rioult-Pedotti MS, Friedman D, Hess G, Donoghue JP. Strengthening of horizontal cortical connections following skill learning. Nat Neurosci. 1998;1:230–234. doi: 10.1038/678. [DOI] [PubMed] [Google Scholar]
- Rossini PM, Barker AT, Berardelli A, Caramia MD, Caruso G, Cracco RQ, Dimitrijevic MR, Hallett M, Katayama Y, Lucking CH, Maertens de Noordhout AL, Marsden CD, Murray NMF, Rothwell JC, Swash M, Tomberg C. Non-invasive electrical and magnetic stimulation of the brain, spinal cord and roots: basic principles and procedures for routine clinical application. Report of an IFCN committee. Electroencephalogr Clin Neurophysiol. 1994;91:79–92. doi: 10.1016/0013-4694(94)90029-9. [DOI] [PubMed] [Google Scholar]
- Russmann H, Lamy JC, Shamim EA, Meunier S, Hallett M. Associative plasticity in intracortical inhibitory circuits in human motor cortex. Clin Neurophysiol. 2009;120:1204–1212. doi: 10.1016/j.clinph.2009.04.005. [DOI] [PMC free article] [PubMed] [Google Scholar]
- Schieber MH. Constraints on somatotopic organization in the primary motor cortex. J Neurophysiol. 2001;86:2125–2143. doi: 10.1152/jn.2001.86.5.2125. [DOI] [PubMed] [Google Scholar]
- Sjöström PJ, Turrigiano GG, Nelson SB. Rate, timing, and cooperativity jointly determine cortical synaptic plasticity. Neuron. 2001;32:1149–1164. doi: 10.1016/s0896-6273(01)00542-6. [DOI] [PubMed] [Google Scholar]
- Stefan K, Kunesch E, Benecke R, Cohen LG, Classen J. Mechanisms of enhancement of human motor cortex excitability induced by interventional paired associative stimulation. J Physiol. 2002;543:699–708. doi: 10.1113/jphysiol.2002.023317. [DOI] [PMC free article] [PubMed] [Google Scholar]
- Stefan K, Kunesch E, Cohen LG, Benecke R, Classen J. Induction of plasticity in the human motor cortex by paired associative stimulation. Brain. 2000;123:572–584. doi: 10.1093/brain/123.3.572. [DOI] [PubMed] [Google Scholar]
- Tadin D, Lappin JS, Gilroy LA, Blake R. Perceptual consequences of centre-surround antagonism in visual motion processing. Nature. 2003;424:312–315. doi: 10.1038/nature01800. [DOI] [PubMed] [Google Scholar]
- Weiler N, Wood L, Yu J, Solla SA, Shepherd GM. Top-down laminar organization of the excitatory network in motor cortex. Nat Neurosci. 2008;11:360–366. doi: 10.1038/nn2049. [DOI] [PMC free article] [PubMed] [Google Scholar]
- Weise D, Schramm A, Beck M, Reiners K, Classen J. Loss of topographic specificity of LTD-like plasticity is a trait marker in focal dystonia. Neurobiol Dis. 2011;42:171–176. doi: 10.1016/j.nbd.2010.11.009. [DOI] [PubMed] [Google Scholar]
- Weise D, Schramm A, Stefan K, Wolters A, Reiners K, Naumann M, Classen J. The two sides of associative plasticity in writer's cramp. Brain. 2006;129:2709–2721. doi: 10.1093/brain/awl221. [DOI] [PubMed] [Google Scholar]
- Werhahn KJ, Kunesch E, Noachtar S, Benecke R, Classen J. Differential effects on motorcortical inhibition induced by blockade of GABA uptake in humans. J Physiol. 1999;517:591–597. doi: 10.1111/j.1469-7793.1999.0591t.x. [DOI] [PMC free article] [PubMed] [Google Scholar]
- Wigström H, Gustafsson B. Postsynaptic control of hippocampal long-term potentiation. J Physiol (Paris) 1986;81:228–236. [PubMed] [Google Scholar]
- Wolters A, Sandbrink F, Schlottmann A, Kunesch E, Stefan K, Cohen LG, Benecke R, Classen J. A temporally asymmetric Hebbian rule governing plasticity in the human motor cortex. J Neurophysiol. 2003;89:2339–2345. doi: 10.1152/jn.00900.2002. [DOI] [PubMed] [Google Scholar]
- Ziemann U, Lönecker S, Steinhoff BJ, Paulus W. The effect of lorazepam on the motor cortical excitability in man. Exp Brain Res. 1996;109:127–135. doi: 10.1007/BF00228633. [DOI] [PubMed] [Google Scholar]