

INTRODUCTION
Traditionally, glaucoma has been defined as a progressive optic neuropathy characterized by optic disc excavation and corresponding visual field loss. The gold standard methods of assessing glaucomatous damage have been slit-lamp biomicroscopy, examination of stereographic optic disc photos, and visual field testing.1 In addition, imaging technologies such as optical coherence tomography (OCT) and confocal scanning laser ophthalmoscopy provide objective measurements of the optic disc and retinal nerve fiber layer which correlate well with disease severity.2,3 There is a growing body of literature indicating that glaucomatous damage can be detected beyond the optic nerve head, extending as far back as the lateral geniculate nucleus and visual cortex.4–7 In addition, many patients with glaucoma have media abnormalities or other ocular co-morbidities which limit the usefulness of conventional imaging strategies and perimetric assessment. Thus, there is a need for neuro-imaging techniques that can be used for the evaluation of the visual pathway beyond the nerve fiber layer and optic disc head.
Diffusion tensor imaging (DTI) is an emerging magnetic resonance imaging (MRI) technique that has shown promise in the assessment of central nervous system8 and notably optic nerve disorders.9,10 DTI measures the root mean square displacement of random Brownian motion of water molecules in a given biological structure of interest.11 DTI is able to quantify water diffusivities in three principle orientations within an imaging voxel, which is particularly meaningful for ordered biological tissues.12 Hence, most of the applications of DTI have been in white matter structures. DTI-derived fractional anisotropy provides quantitative information about the extent of anisotropic diffusion of water molecules.13 The fractional anisotropy is smaller in an isotropic medium than in an environment with ordered tissue structure. Mean diffusivity measures the overall magnitude of water molecule diffusion in the three-dimensional space. It has a larger value in a medium without any constraints (e.g., cerebrospinal fluid space) than in a medium with many restrictions and hindrances (e.g., gray and white matter) to water diffusion. Axial and radial diffusivities represent the magnitude of water molecule diffusion parallel and perpendicular to the structure of interest, respectively. Both axial and radial diffusivities are more specific and sensitive for white matter pathologies where the nerve fibers can be modeled as cylindrical structures.14–18
The retrobulbar optic nerve, in particular, lends itself well to study using DTI since it is a discrete structure consisting of regularly-arranged bundles of axons. In mouse models of optic nerve injuries, axial and radial diffusivities have been shown to be specific and sensitive to axonal injury and myelin damage.15,17,19,20 In humans, mean diffusivity and fractional anisotropy have been shown to differ significantly between subjects with a unilateral episode of optic neuritis and unaffected controls.21 Magnetic resonance diffusion parameters in optic neuritis patients have also been shown to correlate with visual functions and be able to predict visual outcome.22–26 In contrast, data on DTI parameter changes in glaucoma are limited.9,27,28 Garaci et al. found significant differences of mean diffusivity and fractional anisotropy in optic nerve and optic radiations between subjects with primary open angle glaucoma and normal controls.27 Zikou et al. demonstrated significantly decreased fractional anisotropy in certain intracranial white matter tracts in glaucoma patients compared to controls, in addition to morphological tissue reduction in various regions of the intracranial part of the visual pathway.28 Furthermore, their neuroimaging findings positively correlated with the retinal nerve fiber thickness measurements obtained by Stratus OCT 3. Both studies suggested the neurodegenerative aspect of glaucoma disease and the potential use of DTI to quantify tissue degeneration within the visual pathway in glaucoma patients.
The goals of our pilot study were to explore differences between glaucoma patients and control subjects for diffusion tensor imaging parameters studied in the optic nerve using a prototype coil, and to evaluate correlation of these parameters with the rim area obtained with Heidelberg Retina Tomography (HRT) and with the severity of glaucomatous damage using the modified Bascom Palmer glaucoma staging system (GSS).
METHODS
Study Population
The study was approved by the institutional review board of the Human Research Protection Office of Washington University in St. Louis, Missouri. Subjects were recruited from the Washington University Eye Center and Vision Centers. All eligible consecutive new and established patients that were willing to participate in the study were included in the study. Recruitment occurred during both new and established patient visits. Subjects were prospectively placed into Glaucoma or Normal Control groups based on an established diagnosis which was confirmed through a complete eye examination performed within one month of enrollment. Inclusion criteria were: (1) ages 18 to 80 years for all subjects; (2) for the glaucoma group, a confirmed diagnosis of glaucoma by a glaucoma specialist; (3) for the normal control group, best corrected Snellen visual acuity ≥20/40 and no major ocular diagnoses other than cataract. Exclusion criteria for both groups were: (1) age <18 years; (2) history or anticipated claustrophobia with MRI testing; (3) any contraindication to MRI testing (e.g. metallic heart valve); (4) known or suspected pregnancy; (5) history or suspicion of non-glaucomatous optic nerve disorders (e.g. optic pit, optic head drusen, ischemic or toxic optic neuropathy); (6) retinal arterial or venous occlusions; (7) diabetic retinopathy; (8) central nervous pathologies (e.g. multiple sclerosis); and (9) visual field defects that were not consistent with optic nerve findings on the ophthalmological exam. Demographic and clinical data of the subjects, including age, sex, race, ocular diagnoses, best corrected visual acuity converted to logarithm of minimum angle of resolution (logMAR), refraction, and indices from their last 24-2 or 30-2 Humphrey visual field were recorded.
DTI
DTI data were acquired using a 4-element phased array custom-fabricated receiver coil on a 3 Tesla scanner (Trio, Siemens; Erlangen, Germany). Oblique trans-axial diffusion weighted images were acquired (field of view 166×72 mm, matrix 128×56, and repetition time/echo time ~8000/103 ms) on nine interleaved contiguous slices of 1.3 mm thick, using a previously described reduced field of view single-shot spin-echo echo-planar imaging sequence for optic nerve diffusion imaging.10 Each slice acquisition started with 300 ms delay after the rise of the sphygmic wave as measured with a peripheral pulse oximeter. Twenty-five diffusion weighted images with b values between 312–600 (bmean = 450 s/mm2) and non-collinear diffusion encoding directions were acquired in addition to two b0 images. Six repetitions including balanced acquisitions with opposite gradient polarity were averaged to increase signal-to-noise ratio. Post-processing, including motion-correction, diffusion tensor diagnolization, resampling with resolution of 0.65×0.65×0.65 mm3, and region of interest definition to avoid cerebrospinal fluid and anterior portion of the optic nerve were performed as described previously 10, 23. The images were analyzed by a single investigator (JX) who was blinded to the subjects’ ocular diagnoses.
HRT II
HRT II (Heidelberg Engineering, Dossenheim, Germany) scans were performed prospectively for each subject unless one was performed within 9 months of the diffusion tensor imaging as part of the subject’s routine clinical care. Quality criteria for the HRT II images to be included in the analysis were standard deviation ≤30 µm, centered optic nerve, and appropriate image brightness and focus.
GSS
The modified Bascom Palmer GSS29 was used to determine the severity of glaucomatous damage. GSS was determined for all glaucoma subjects by reviewing their most recent visual field (Swedish Interactive Thresholding algorithm standard automated perimetry, program 24-2 or 30-2) (Humphrey Field Analyzer II, Carl Zeiss Meditec Inc, Dublin CA). GSS ranges from 0 (“ocular hypertension/earliest glaucoma”) to 5 (“end-stage glaucoma / blind”) in increments of 1. All visual fields were performed within one year of their respective subject’s MRI scan. The stages for all of the subjects were determined by one of the investigators (SC).
Statistical Analyses
A t-test was used to test for any significant difference in age between the normal and glaucoma subjects. A Wilcoxon rank sum test also was used to test for difference in age since one subject’s age was an outlier. A Fischer’s exact test was used to test for any significant difference in distribution of sex or race between the normal and glaucoma subjects. All tests were considered significant if their two-sided p-value was less than 0.05. Linear mixed repeated measures models were used to model diffusion tensor imaging parameters and to estimate mean diffusion tensor imaging values with 95% confidence intervals. Linear contrasts were used to test for trend and for difference in diffusion tensor imaging parameters. Externally studentized residuals were used to examine global model fit, presence of outliers and any residual, unexplained patterning over time elapsed between the HRT and DTI scans.
Repeated measured models were used to analyze the data because there was more than one measurement per individual (right and left sides). These models make it possible to account for the correlation within individuals and to correctly estimate differences between individuals in the presence of that correlation. This approach is appropriate for this data and the questions being addressed, but do make some assumptions. One of these is that the outcome (dependent variable) is approximately Gaussian distributed. Axial and radial diffusivities had this property and can be fit on the original scale. Mean diffusivity and fractional anisotropy require a logarithmic transformation (reducing the effect of outliers) before the model can be fit. The transformation alters the intervals between values but not their order, so the results can be re-expressed on the original scale without distorting the associations that have been described by the model. A logarithmic transformation of the mean diffusivity and fractional anisotropy were performed to suit these two parameters for linear modeling when correlating to the HRT rim area values. The axial and radial diffusivities could be used without transformation in a linear model when correlating to the rim area. The estimates of adjusted mean and confidence intervals for mean diffusivity and fractional anisotropy were returned to the original scale in the table for ease of interpretation and the values in the original scale were plotted. A variety of diagnostics were examined for each model, and it was determined that there was little influence of outliers.
Measurements on the right and left eyes were clustered within each patient and a within-subject component of variance was estimated. Rather than lose information by dropping eyes from the analysis we used a clustered model that took into account the correlation between observations taken on the same individual. The effective sample size was the number of patients, not the number of eyes, but all eyes contributed information to the model. Our study had 80% power to detect an increase in values of 30% or more for mean, radial, and axial diffusivities and to detect a decrease in values of 30% or more for fractional anisotropy in the Glaucoma group compared to the Normal Control group.
Primary and secondary outcome measures
The primary outcome measures studied were fractional anisotropy, mean, axial, and radial diffusivities and HRT rim area in the Glaucoma and Normal Control subjects. The secondary outcome measures included correlation of DTI parameters with HRT rim area, and correlation of DTI parameters with GSS.
RESULTS
Patient & Ocular Characteristics
A total of 46 subjects enrolled in the study. Of these, 39 subjects successfully completed the study. The reasons for not successfully completing the study were: data lost after the scan was completed (2 subjects), poor quality of acquired data (2 subjects), scanner malfunction (1 subject), subject could not fit into scanner (1 subject), and difficulty breathing from anxiety during scan (1 subject). Baseline characteristics of the subjects in the Glaucoma and Normal Control groups are displayed in Table 1. There were no statistically significant differences between the two groups with regards to age (p=0.84, t-test; p=0.92, Wilcoxon rank sum test), sex (p=0.082; Fischer’s exact test), or race (p=0.30; Fischer’s exact test).
Table 1.
Baseline characteristics of the subjects in the adult control and glaucoma study groups.
| Parameters | No.(%)* or Mean ± SD** |
|
|---|---|---|
| Control (N=12) |
Glaucoma (N=27) |
|
| *Sex | ||
| Male | 3 (25) | 16 (59) |
| Female | 9 (75) | 11 (41) |
| **Age (years) | 59.3 ± 10.3 | 58.4 ± 12.5 |
| *Race | ||
| Caucasian | 9 (75) | 15 (56) |
| African-American | 3 (25) | 12 (44) |
| *Ocular diagnoses | ||
| Primary open angle glaucoma | -- | 18 (67) |
| Juvenile glaucoma | -- | 4 (15) |
| Normal tension glaucoma | -- | 2 (7) |
| Pigmentary glaucoma | -- | 2 (7) |
| Chronic angle closure glaucoma | -- | 1 (4) |
| **Average visual acuity of both eyes (1LogMAR) | 0.00 ± 0.11 | 0.23 ± 0.29 |
| 2GSS stage of eyes | ||
| Stage 0 | -- | 8 |
| Stage 1 | -- | 6 |
| Stage 2 | -- | 8 |
| Stage 3 | -- | 11 |
| Stage 4 | -- | 13 |
| Stage 5 | -- | 8 |
LogMAR=Logarithm of Minimum Angle of Resolution
GSS=Glaucoma Staging System
DTI parameters in the Glaucoma and Normal Control groups
All DTI parameters were significantly different between Glaucoma and Normal Control eyes (Table 2). Fractional anisotropy was significantly lower for the Glaucoma versus Normal Control eyes (0.21 vs. 0.44, p < 0.0001). Mean diffusivity for the Glaucoma eyes was significantly greater compared to the Normal Control eyes (1.33 vs. 0.91 µm2 / ms, p=0.0002). Both axial diffusivity (1.70 vs. 1.43 µm2 / ms, p=0.036) and radial diffusivity (1.24 vs. 0.71 µm2 / ms, p < 0.0001) were significantly greater in the Glaucoma versus Normal Control eyes.
Table 2.
| Adjusted Mean or adjusted log mean* [95% confidence limit] |
P value | ||
|---|---|---|---|
| Normal Control (N=24) |
Advanced Glaucoma (N=54) |
||
| Mean diffusivity** | 0.91 [0.78–1.05] | 1.33 [1.21–1.47] | 0.0002 |
| Fractional anisotropy | 0.44 [0.36–0.53] | 0.21 [0.18–0.24] | <0.0001 |
| Radial diffusivity | 0.71 [0.53–0.90] | 1.24 [1.11–1.36] | <0.0001 |
| Axial diffusivity | 1.42 [1.21–1.62] | 1.70 [1.56–1.84] | 0.031 |
Mean diffusivity and fractional anisotropy adjusted mean values were calculated on a logarithmic scale. Radial and axial diffusivity adjusted mean values were calculated on a linear scale.
Mean, radial, and axial diffusivities are expressed in units of µm2 / ms. Fractional anisotropy has no units.
Correlation of DTI parameters with HRT rim area
Of the 78 total possible eyes, HRT scans were completed for 62 (79.5%). HRT scans were completed for 40 (74.1%) of the 54 glaucoma eyes and 24 (100%) of the 24 normal eyes. The primary reasons for not obtaining HRT scans for the glaucoma eyes were inability to fixate properly and ocular media precluding adequate scan quality (i.e. HRT standard deviation >30 µm). The mean and median time elapsed between the HRT and diffusion tensor imaging scans were 70 and 84 days respectively for the glaucoma group and 3 and 0 days respectively for the normal group.
A repeated measures linear model found that mean diffusivity increased as rim area decreased (p<0.0001; Figure 1A) and fractional anisotropy decreased as rim area decreased for glaucoma subjects (p<0.0001; Figure 1B). A repeated measures linear model found that both radial diffusivity (p<0.0001; Figure 1C) and axial diffusivity (p=0.0091; Figure 1D) increased as rim area decreased for Glaucoma eyes. These relationships between the diffusivity parameters and rim area remained significant when the Normal Control eyes were included in the analysis (data not shown).
Figure 1.
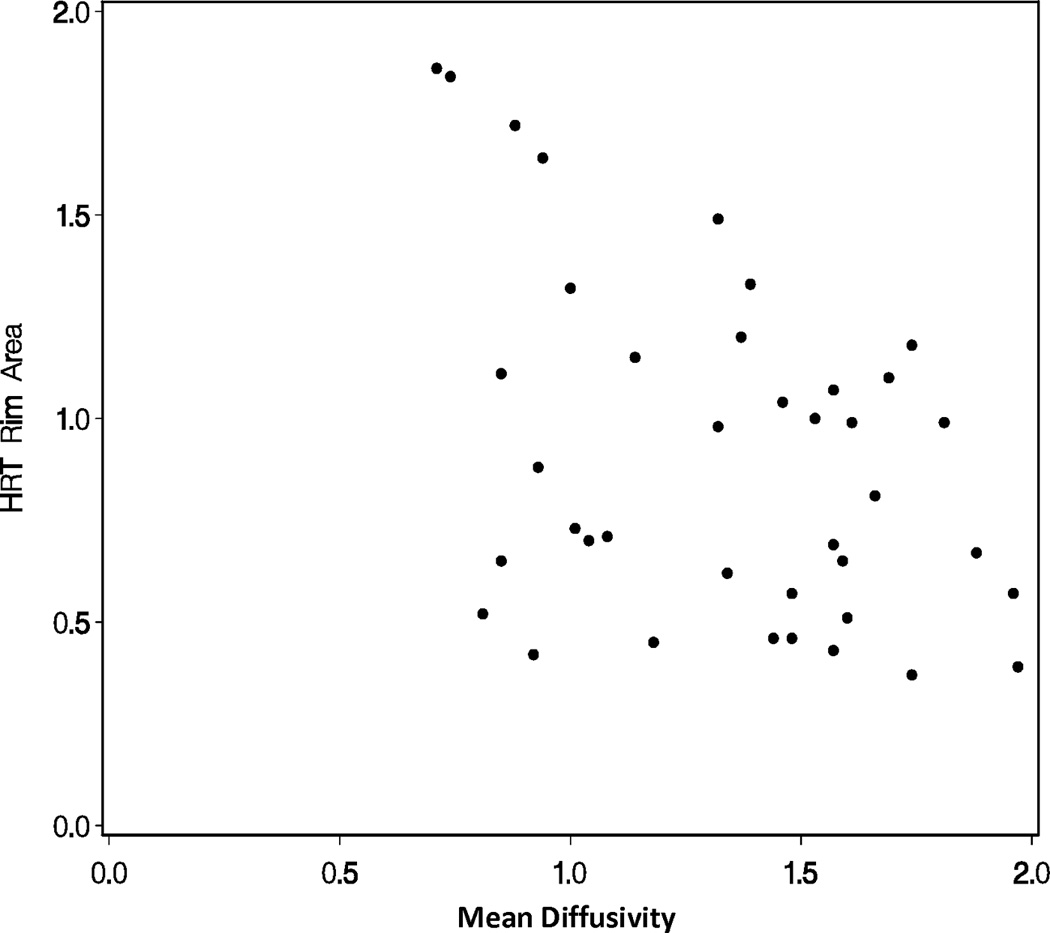
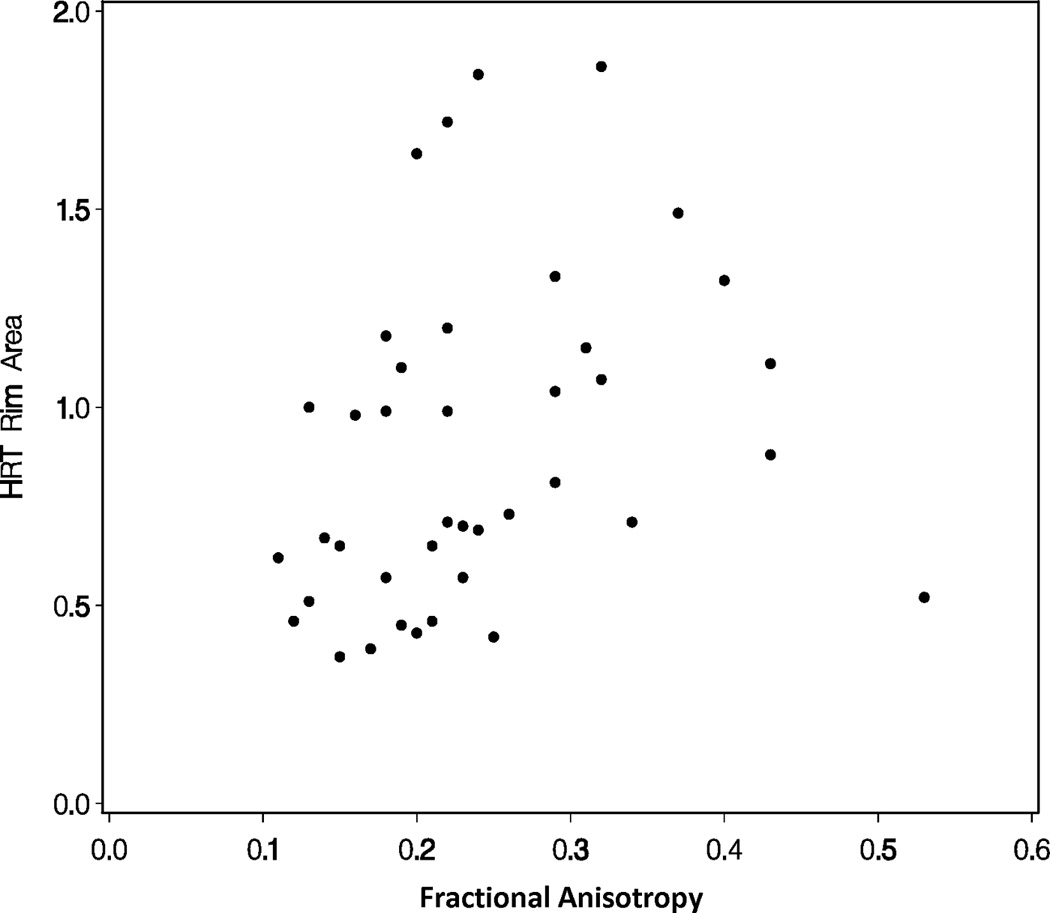
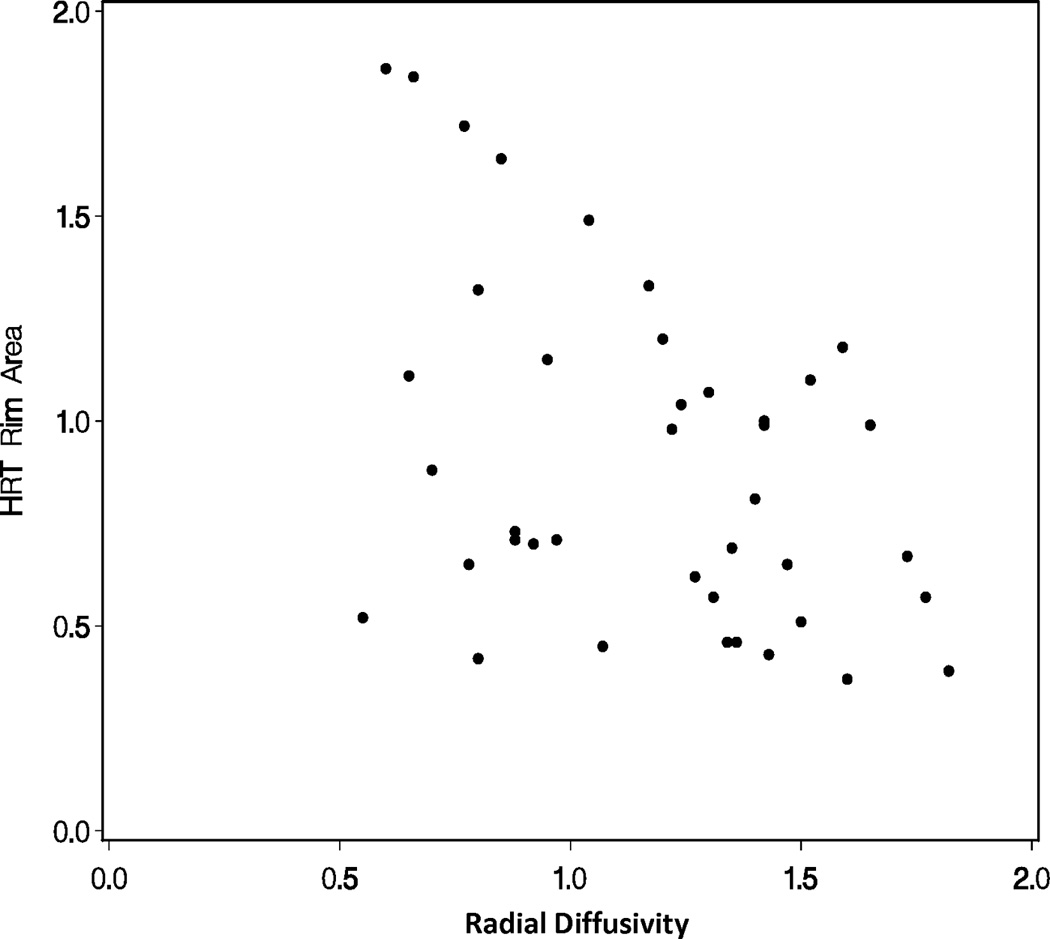
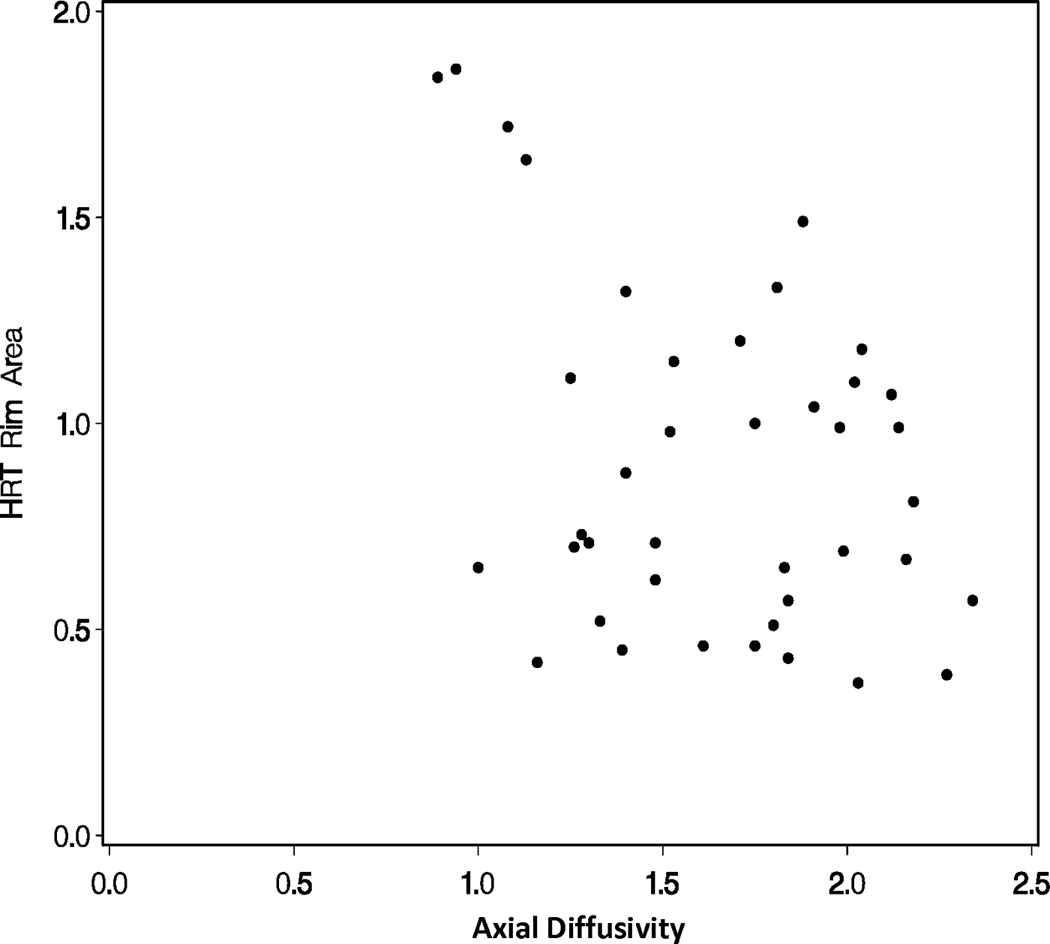
Correlations of diffusion tensor imaging parameters with the rim area obtained with Heidelberg Retinal Tomograph (HRT) II in the glaucoma study group: (A) mean diffusivity; (B) fractional anisotropy; (C) radial diffusivity; and (D) axial diffusivity to HRT rim area, respectively. The mean diffusivity and fractional anisotropy were modeled on a logarithmic scale, while the radial and axial diffusivities were modeled on a linear scale. All points are plotted on the original linear scale.
Correlation of DTI parameters with GSS
Across all eyes, there were significant overall trends for mean, radial, and axial diffusivities increasing as GSS stage increased from 0 to 5 (all p-values < 0.05). There was also a significant overall trend for fractional anisotropy decreasing as GSS stage increased from 0 to 5 (p-value < 0.05, Figures 2A–D). However, there were no statistically significant differences in the DTI parameters when adjacent pairs of stages were compared (e.g. stage 1 eyes compared to stage 0 eyes, all p-values > 0.05).
Figure 2.
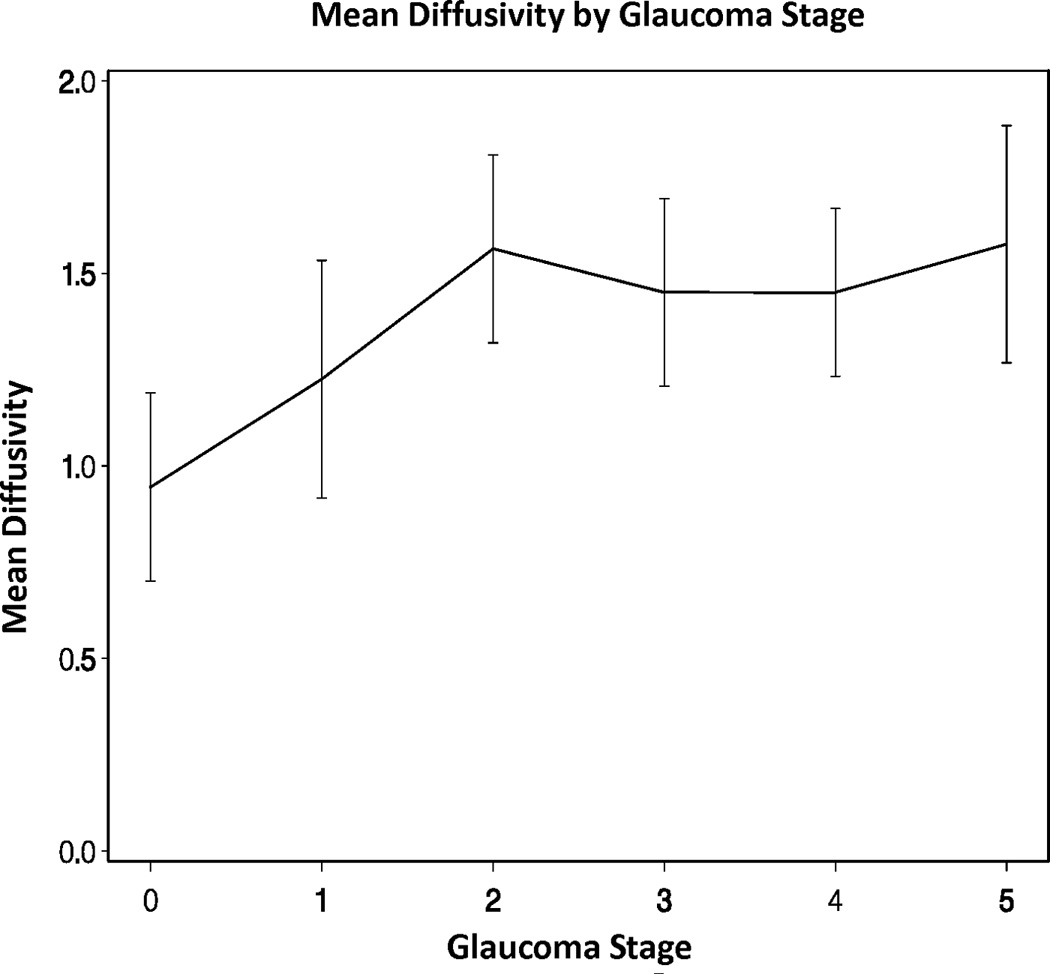
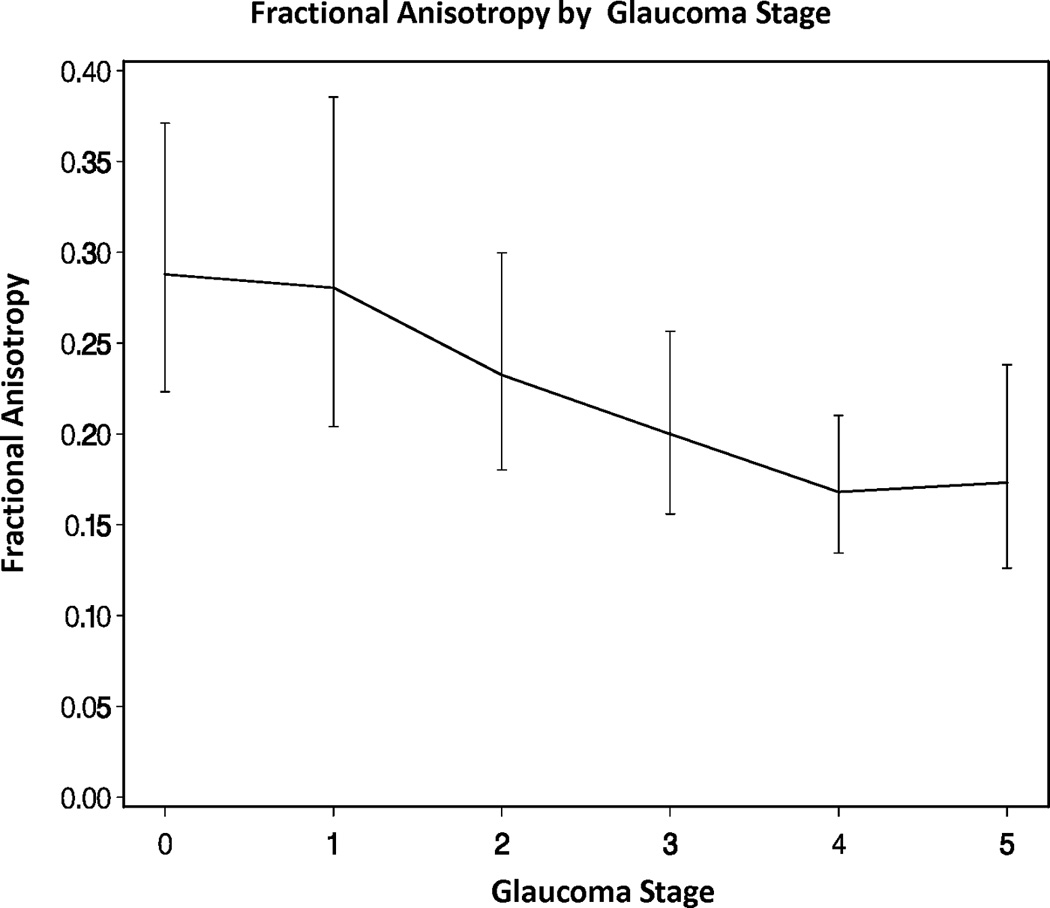
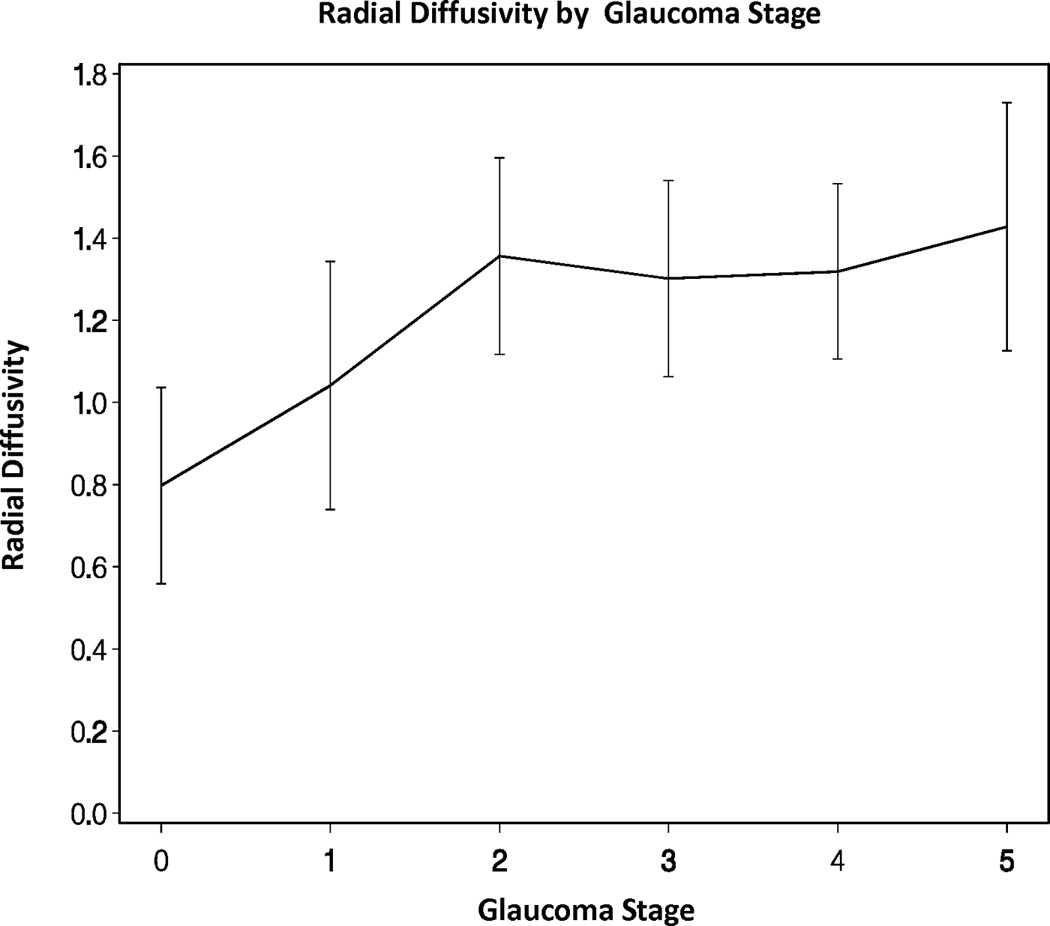
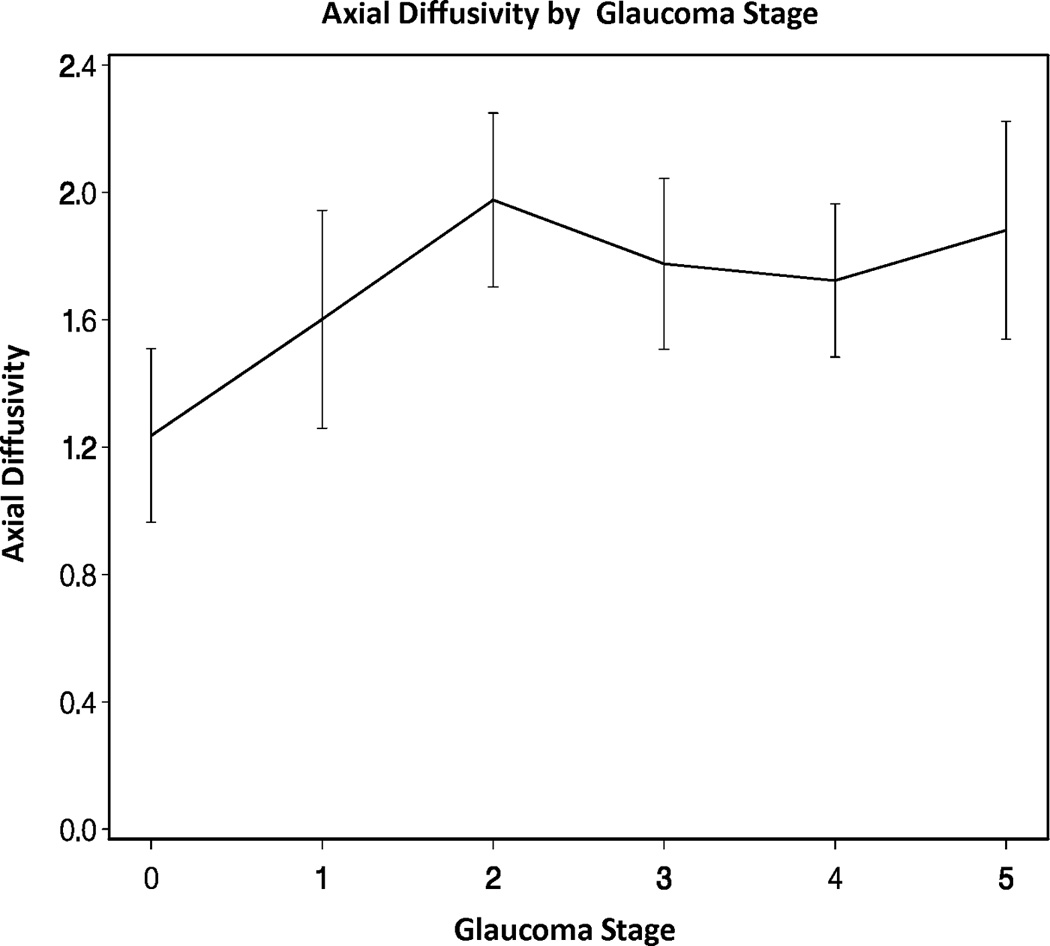
Diffusion tensor imaging parameters over different Glaucoma stages (0–5) in the glaucoma group: (A) mean diffusivity; (B) fractional anisotropy; (C) radial diffusivity; and (D) axial diffusivity across Glaucoma Staging System stages, respectively. Mean DTI values at each Glaucoma stage were connected by lines to show the overall trend as the Glaucoma stage advances. Error bars represent 95% confidence intervals around the means. Mean, radial, and axial diffusivities are expressed in units of µm2/ms. Fractional anisotropy is dimensionless.
DISCUSSION
Similar to Garaci et al27, we found that glaucomatous optic nerves had decreased fractional anisotropy and increased mean diffusivity values compared to unaffected optic nerves. In addition, our study demonstrated that the directional diffusivities (i.e., axial and radial diffusivities), underpinning the fractional anisotropy and mean diffusivity, were significantly increased in glaucomatous optic nerves, suggesting severe overall optic nerve tissue damage or loss. Our finding of significantly increased axial diffusivity in the glaucoma group may reflect the larger proportion of advanced or more chronic optic nerve damage in our glaucoma group in contrast to previous studies. This is supported by recent studies showing initial axial diffusivity decrease in acute optic neuritis, but later significant axial diffusivity increase during the remote stage for optic neuritis patients followed longitudinally.23,26 Perhaps a larger axial diffusivity value is a better biomarker for chronic (as opposed to early) optic nerve damage as found in our advanced glaucoma subjects.
This study is the first to show significant relationships between DTI parameters and HRT rim area. As HRT rim area decreased, mean diffusivity, radial diffusivity, and axial diffusivity increased while fractional anisotropy decreased amongst glaucomatous optic nerves. Rather than being inversely related to an increase in rim thinning, DTI parameters were inversely related to rim area itself. Axons are unmyelinated in the RNFL. Less retinal rim area implies increased axonal loss in the RNFL. Due to axonal degeneration, this also implies axonal damage/loss and consequently myelin disintegration in the connected downstream structure; i.e. the optic nerve. In chronic glaucoma patients, tissue damage and clearance leads to less microstructural restriction and hindrances to water diffusion. Thus, increased water diffusivities and decreased fiber coherence within the optic nerve were measured by DTI. Previous histopathological studies have shown that glaucoma is an optic neuropathy that results primarily in axonal loss.30,31 Also, a study by Hui et al. showed that changes of DTI parameters were associated with axonal loss as seen histologically in a rat glaucoma model.9 Therefore, it seems intuitive that changes in DTI parameters are reflecting increased axonal loss. Nevertheless, we cannot conclude that DTI is detecting axonal loss in our study since in chronic injury axial diffusivity losses its specificity to reflect axonal injury. Despite this difficulty in pathological interpretation of diffusion tensor imaging results, the correlation between HRT rim area and DTI parameters suggests that diffusion tensor imaging may be helpful in the diagnosis and monitoring of glaucomatous damage since HRT has been demonstrated to be useful for these purposes.2,3
We found a significant trend for each of the DTI parameters between stage 0 and 1 and stages 2–5. However, the difference among stages 2, 3, 4 and 5 was minimal. The plateau effect for the more advanced glaucoma stages may reflect a large variation of tissue microstructure at advanced stages and/or increased optic nerve atrophy; hence increased cerebrospinal fluid partial volume effects in our DTI measurements. Although high spatial resolution (1.3 mm isotropic) DTI data were acquired in this study, the cerebrospinal fluid contamination in the measured region of interest, which assumed to be entirely optic nerve tissues, could dilute the specificity of the DTI parameters. This indicates a limited role of the DTI protocol employed in this study in quantifying glaucoma progression. To definitively distinguish the biological cause from the technical cause of the plateau effect in advanced glaucoma stages, cerebrospinal fluid suppressed DTI acquisition32,33, multi-compartment diffusion tensor modeling, or very high resolution imaging at ultra high field (e.g., 7 Tesla) should be employed in future studies to mitigate the partial volume effect. Again, these results agree with the previous study by Garaci et al.27 These results are also consistent with a recent study of remote optic neuritis patients, where clinical stages of visual pathway were assessed with visual acuity, contrast sensitivity, visual evoked potential, and optical coherence tomography.24 This finding implies that DTI parameters may change significantly throughout the spectrum of glaucoma severity from mild to end-stage disease. Thus, DTI might find specific use for those patients with advanced glaucoma whose disease progression is difficult to monitor via conventional methods like stereo disc photographs or other imaging modalities such as HRT. Longitudinal studies, such as one conducted by Naismith et al26 are needed to confirm that these relationships exist in an individual patient. Unlike the study by Garaci et al27, we did not find significant differences in the diffusivity parameters between any adjacent pair of clinical stages. The lack of significant differences between adjacent pairs of clinical stages could be the result of insufficient sample size per stage. Alternatively, this lack of significant difference may reflect the fact that DTI parameters were measured on a continuous scale while clinical stage was a categorical variable. Since we did not observe a stronger or weaker relationship for any one of the DTI parameters with either clinical stage or HRT rim area, our findings argue against Garaci et al’s27 assumption that fractional anisotropy in particular might be a more sensitive indicator of optic nerve degeneration.
A dedicated optic nerve coil and reduced field of view diffusion sequence were used for optimal signal-to-noise ratio, isotropic image resolution, and reduced image distortion by shortening the echo planar imaging echo train length.10 Garaci et al27 employed a similar short echo train length (64 vs. 56 echoes in this study) by using parallel imaging and partial Fourier for phase encoding reduction. To ensure reasonable signal-to-noise ratio, the b values in this study were reduced from our previous studies23,26 due to reduced gradient performance in a whole body scanner (Trio, Siemens) for this study versus a head-only scanner (Allegra, Siemens) for previous studies. Despite a judicious placement of region of interest in the center of the nerve and away from the optic nerve head, as described earlier,21 partial volume effect from the surrounding cerebrospinal fluid may still be present and could bias the diffusion measurement, especially for severe tissue loss in advanced glaucoma stages and hence optic nerve atrophy. In future studies, a cerebrospinal fluid suppressed diffusion sequence may be desirable. 32,33 In addition, quantifying the cross-sectional area of the optic nerve by high-resolution coronal fluid attenuated structural images 34 could facilitate the interpretation of tissue damage versus tissue loss in diffusion tensor imaging parameters.
In our study, the total DTI acquisition time was approximately 30 minutes in duration. The total duration of the MRI study was about sixty minutes including customized coil positioning and scout image acquisition for optic nerve slice prescription in DTI. With ever increasing commercial availability of high-density array head coil (e.g. Siemens 32-channel), the optic nerve DTI acquisition can be shortened to within ten minutes using the anterior portion of the 32-channel head coil (unpublished results) without compromising signal-to-noise ratio. Hence, the entire MRI study can be achieved within half an hour as a clinical protocol without a customized coil.35 Even so, a MRI study is costly (approximately $4000.00 per study) compared to other optical imaging methods. It is not our vision for MRI to compete with other optical imaging methods. Rather, we expect DTI to complement cases where optical imaging is unreliable or unachievable due to reasons discussed below.
Although normative human brain DTI data has been widely available, normative human optic nerve DTI data are scarce due to technical difficulties in optic nerve diffusion imaging. In a recent review10, we have summarized normative optic nerve DTI values from four recent studies with sufficient statistical power. Minor discrepancies in the reported normative values exist between different groups using different imaging sequences and protocols.10 The observed discrepancies may arise from differences in signal-to-noise ratio, imaging orientations (transverse versus coronal), spatial resolution, and cerebrospinal fluid/fat suppression. A consensus regarding the optimal protocol for optic nerve diffusion imaging has yet to be reached. In addition, age-related effect has been widely recognized in human intracranial white matter tracts and may well be present in the optic nerve due to similar tissue biological change due to aging. To our best knowledge, nobody has studied age-related effects on optic nerve DTI parameters. Given that the glaucoma population is usually much older than those in the existing optic nerve DTI literature, we employed a case-controlled study design to match the ages of the glaucoma and control groups.
Our pilot study has limitations. Not all of our healthy controls were age-matched. Given the difficulty in recruiting normal subjects for imaging of this type (lengthy MRI at an off-site location), it was considered reasonable to obtain an adequate number of control subjects to enable a comparison of DTI parameters between the Normal and Glaucoma subjects as above. Under ideal conditions, an equal number of healthy age-matched controls would be recruited. Also, not all of the study participants completed HRT imaging because of poor data acquisition (e.g. poor fixation or media opacity). We excluded patients without valid HVF, HRT or MRI data from the analyses evaluating DTI parameters and HRT rim area. It is a limitation of current glaucoma imaging technology that clear media and the ability to fixate well are often necessary to obtain a valid study. Despite the fact that we had to exclude 26% of glaucoma patients from the relevant analysis, the general trend of our study was established based on the results from the remaining 74% of the patients. Patients excluded from DTI parameters and HRT rim area analyses were included in the overall comparison of the DTI parameters of control subjects versus glaucoma patients, and also for the GSS analysis. Given the expense of the MRI testing required and the challenges of recruiting subjects for such a study, it was decided to perform an analysis to see if additional study was warranted in a larger, prospective fashion which would require considerable greater funding. Also, we included a disproportionate number of eyes with extensive cupping in the glaucoma group. It will be important for future studies to include a wider range of glaucoma patients to determine the sensitivities of the DTI parameters in detecting and monitoring glaucomatous damage.
In our study, glaucoma patients had longer time elapsed between HRT scans and DTI scans than controls (70–84 days vs. 0–3 days). However, the time frame would not be expected to significantly affect the HRT results. Since the vast majority of subjects in the control group had not had a prior HRT, the testing was done in closer proximity to DTI evaluation. Of those subjects with glaucoma, many had undergone HRT testing as part of their normal care at times not coordinated in any way with DTI testing. Of course, since HRT testing is predominantly performed on patients who are glaucoma suspects or who have early disease, and is not typically obtained in patients with advanced disease (as it provides no useful information in that context and is therefore not covered by insurance), study patients with more advanced disease probably had DTI testing in closer proximity to HRT testing (when obtainable). As such, there was a broader range of time elapsed between HRT scans and DTI testing within the glaucoma group. For cost and convenience, we decided not to retest patients with the HRT who had already had studies obtained as part of their routine clinical care. However, most of the HRT and DTI scans were obtained on the same day resulting in the DTI parameters accurately representing their respective HRT scan. The strength of our study included prospective collection of DTI parameters and HRT rim area measurements, which minimized selection bias. Standardized glaucoma severity classification further strengthened our study.
Given our results, it is possible that DTI analysis of the optic nerve might prove useful in the evaluation of patients in whom standard glaucoma imaging techniques (i.e. OCT or HRT) or formal perimetry is not possible. This would include patients with media opacities (dense cataract, corneal scarring or edema) for whom adequate optical imaging studies cannot be obtained, as well as those subjects who cannot reliably perform standard perimetric testing due to such media opacities or other physical/mental limitations. These are often patients for whom direct clinical evaluation of the optic disc is not possible and in whom standard techniques of intraocular pressure measurement might be inaccurate. It would be clinically useful to assess both the presence and extent of glaucomatous damage in such patients, not only to guide medical management, but also to assist in decisions regarding initial or repeat surgical intervention (e.g. corneal transplantation). Furthermore, DTI analysis would be useful in patients with anomalous optic discs, such as myopic discs, tilted discs, hypoplastic discs, or discs with optic nerve drusen. In these patients, the results of clinical, imaging and functional evaluations cannot provide definitive differentiation between baseline and early progressive changes in a given optic disc. Ideally, these patients could be followed by the DTI technique prior to the onset of glaucoma. And last but not least with the advancements in glaucoma neuroprotective treatment research, there is a need for neuro-imaging techniques that can be used for the evaluation of the visual pathway response to these potential treatments.
In summary, our study was a pilot designed to explore differences between glaucoma patients and control subjects for all DTI parameters studied in the optic nerve. We found that increases in mean, radial, and axial diffusivities and decreases in fractional anisotropy in the optic nerve correlate with decreases in HRT rim area and increases in clinical stages of glaucoma. Many of the limitations of our study could be remedied in a considerably more costly, large prospective study, which is warranted based on the results of our study. By answering an important question of how DTI parameters change short-term and longitudinally with glaucomatous damage of the optic nerve and whole visual pathway, we may be able to use DTI as an objective modality for detection and monitoring of glaucomatous visual pathway damage in appropriate patients with glaucoma and clinical trials.
Acknowledgments
Source of Funding: This work is supported, in part, by unrestricted grant from Research to prevent blindness, Inc., New York, NY. NIH R01-NS054194 (S-KS), and an Allergan Horizon Grant, 2008 (EMB/STC).
Footnotes
Publisher's Disclaimer: This is a PDF file of an unedited manuscript that has been accepted for publication. As a service to our customers we are providing this early version of the manuscript. The manuscript will undergo copyediting, typesetting, and review of the resulting proof before it is published in its final citable form. Please note that during the production process errors may be discovered which could affect the content, and all legal disclaimers that apply to the journal pertain.
Conflicts of Interest: Sidney T. Chang: none; Junqian Xu: none; Kim Trinkaus: none; Melike Pekmezci: none; Sheng-Kwei Song: none; Stella N. Arthur: none; Edward M. Barnett: Merck, speaker, Alcon, speaker.
REFERENCES
- 1.Weinreb RN, Khaw PT. Primary open-angle glaucoma. Lancet. 2004;22:1711–1720. doi: 10.1016/S0140-6736(04)16257-0. [DOI] [PubMed] [Google Scholar]
- 2.Hewitt AW, Chappell AJ, Straga T, Landers J, Mills RA, Craig JE. Sensitivity of confocal laser tomography versus optical coherence tomography in detecting advanced glaucoma. Clin Experiment Ophthalmol. 2009;37:836–841. doi: 10.1111/j.1442-9071.2009.02181.x. [DOI] [PubMed] [Google Scholar]
- 3.Deleón-Ortega JE, Arthur SN, McGwin G, Jr, Xie A, Monheit BE, Girkin CA. Discrimination between glaucomatous and nonglaucomatous eyes using quantitative imaging devices and subjective optic nerve head assessment. Invest Ophthalmol Vis Sci. 2006;47:3374–3380. doi: 10.1167/iovs.05-1239. [DOI] [PMC free article] [PubMed] [Google Scholar]
- 4.Gupta N, Yu¨cel YH. Glaucoma as a neurodegenerative disease. Curr Opin Ophthalmol. 2007;18:110–114. doi: 10.1097/ICU.0b013e3280895aea. [DOI] [PubMed] [Google Scholar]
- 5.Gupta N, Yu¨cel YH. What changes can we expect in the brain of glaucoma patients? Surv Ophthalmol. 2007;52(6 suppl 1):S122–S126. doi: 10.1016/j.survophthal.2007.08.006. [DOI] [PubMed] [Google Scholar]
- 6.Yu¨cel YH, Zhang Q, Gupta N, Kaufman PL, Weinreb RN. Loss of neurons in magnocellular and parvocellular layers of the LGN in glaucoma. Arch Ophthalmol. 2000;118:378–384. doi: 10.1001/archopht.118.3.378. [DOI] [PubMed] [Google Scholar]
- 7.Gupta N, Ang LC, Noel de Tilly L, Bidaisee L, Yu¨cel YH. Human glaucoma and neural degeneration in intracranial optic nerve, lateral geniculate nucleus, and visual cortex. Br J Ophthalmol. 2006;90:674–678. doi: 10.1136/bjo.2005.086769. [DOI] [PMC free article] [PubMed] [Google Scholar]
- 8.Sundgren PC, Dong Q, Gómez-Hassan D, Mukherji SK, Maly P, Welsh R. Diffusion tensor imaging of the brain: review of clinical applications. Neuroradiology. 2004;46:339–350. doi: 10.1007/s00234-003-1114-x. [DOI] [PubMed] [Google Scholar]
- 9.Hui ES, Fu QL, So KF, Wu EX. Diffusion tensor MR study of optic nerve degeneration in glaucoma. Conf Proc IEEE Eng Med Biol Soc. 2007;2007:4312–4315. doi: 10.1109/IEMBS.2007.4353290. [DOI] [PubMed] [Google Scholar]
- 10.Xu J, Sun SW, Naismith RT, Snyder AZ, Cross AH, Song SK. Assessing optic nerve pathology with diffusion MRI: from mouse to human. NMR Biomed. 2008;21:928–940. doi: 10.1002/nbm.1307. [DOI] [PMC free article] [PubMed] [Google Scholar]
- 11.Le Bihan D. Molecular diffusion nuclear magnetic resonance imaging. Magn Reson Q. 1991;7:1–30. [PubMed] [Google Scholar]
- 12.Basser PJ, Pierpaoli C. Microstructural and Physiological Features of Tissues Elucidated by Quantitative-Diffusion-Tensor MRI. J Magn Reson. 1996;111:209–219. doi: 10.1006/jmrb.1996.0086. Series B. [DOI] [PubMed] [Google Scholar]
- 13.Beaulieu C. The basis of anisotropic water diffusion in the nervous system – a technical review. NMR in Biomedicine. 2002;15:435–455. doi: 10.1002/nbm.782. [DOI] [PubMed] [Google Scholar]
- 14.Song SK, Sun SW, Ramsbottom MJ, Chang C, Russell J, Cross AH. Dysmyelination revealed through MRI as increased radial (but unchanged axial) diffusion of water. Neuroimage. 2002;17:1429–1436. doi: 10.1006/nimg.2002.1267. [DOI] [PubMed] [Google Scholar]
- 15.Song SK, Sun SW, Ju WK, Lin SJ, Cross AH, Neufeld AH. Diffusion tensor imaging detects and differentiates axon and myelin degeneration in mouse optic nerve after retinal ischemia. Neuroimage. 2003;20:1714–1722. doi: 10.1016/j.neuroimage.2003.07.005. [DOI] [PubMed] [Google Scholar]
- 16.Song SK, Yoshino J, Le TQ, Lin SJ, Sun SW, Cross AH, Armstrong RC. Demyelination increases radial diffusivity in corpus callosum of mouse brain. Neuroimage. 2005;26:132–140. doi: 10.1016/j.neuroimage.2005.01.028. [DOI] [PubMed] [Google Scholar]
- 17.Sun SW, Liang HF, Le TQ, Armstrong RC, Cross AH, Song SK. Differential sensitivity of in vivo and ex vivo diffusion tensor imaging to evolving optic nerve injury in mice with retinal ischemia. Neuroimage. 2006;32:1195–1204. doi: 10.1016/j.neuroimage.2006.04.212. [DOI] [PubMed] [Google Scholar]
- 18.Budde MD, Kim JH, Liang HF, Russell JH, Cross AH, Song SK. Axonal injury detected by in vivo diffusion tensor imaging correlates with neurological disability in a mouse model of multiple sclerosis. NMR Biomed. 2008;21:589–597. doi: 10.1002/nbm.1229. [DOI] [PMC free article] [PubMed] [Google Scholar]
- 19.Sun SW, Liang HF, Cross AH, Song SK. Evolving Wallerian degeneration after transient retinal ischemia in mice characterized by diffusion tensor imaging. Neuroimage. 2008;40:1–10. doi: 10.1016/j.neuroimage.2007.11.049. [DOI] [PMC free article] [PubMed] [Google Scholar]
- 20.Wu Q, Butzkueven H, Gresle M, et al. MR diffusion changes correlate with ultra-structurally defined axonal degeneration in murine optic nerve. Neuroimage. 2007;37:1138–1147. doi: 10.1016/j.neuroimage.2007.06.029. [DOI] [PubMed] [Google Scholar]
- 21.Trip SA, Wheeler-Kingshott C, Jones SJ, et al. Optic nerve diffusion tensor imaging in optic neuritis. Neuroimage. 2006;30:498–505. doi: 10.1016/j.neuroimage.2005.09.024. [DOI] [PubMed] [Google Scholar]
- 22.Hickman SJ, Wheeler-Kingshott CA, Jones SJ, et al. Optic nerve diffusion measurement from diffusion-weighted imaging in optic neuritis. AJNR Am J Neuroradiol. 2005;26:951–956. [PMC free article] [PubMed] [Google Scholar]
- 23.Naismith RT, Xu J, Tutlam NT, et al. Disability in optic neuritis correlates with diffusion tensor-derived directional diffusivities. Neurology. 2009;72:589–594. doi: 10.1212/01.wnl.0000335766.22758.cd. [DOI] [PMC free article] [PubMed] [Google Scholar]
- 24.Naismith RT, Xu J, Tutlam NT, Trinkaus K, Cross AH, Song SK. Radial diffusivity in remote optic neuritis discriminates visual outcomes. Neurology. 2010;74:1702–1710. doi: 10.1212/WNL.0b013e3181e0434d. [DOI] [PMC free article] [PubMed] [Google Scholar]
- 25.Kolbe S, Chapman C, Nguyen T, et al. Optic nerve diffusion changes and atrophy jointly predict visual dysfunction after optic neuritis. Neuroimage. 2009;45:679–686. doi: 10.1016/j.neuroimage.2008.12.047. [DOI] [PubMed] [Google Scholar]
- 26.Naismith RT, Xu J, Tutlam NT, Lancia S, Trinkaus K, Song SK, Cross AH. Diffusion Tensor Imaging in Acute Optic Neuropathies: Predictor of Clinical Outcomes. Arch Neurol. 2012;69:65–71. doi: 10.1001/archneurol.2011.243. [DOI] [PMC free article] [PubMed] [Google Scholar]
- 27.Garaci FG, Bolacchi F, Cerulli A, et al. Optic nerve and optic radiation neurodegeneration in patients with glaucoma: in vivo analysis with 3-T diffusion-tensor MR imaging. Radiology. 2009;252:496–501. doi: 10.1148/radiol.2522081240. [DOI] [PubMed] [Google Scholar]
- 28.Zikou AK, Kitsos G, Tzarouchi LC, Astrakas L, Alexiou GA, Argyropoulou MI. Voxel-Based Morphometry and Diffusion Tensor Imaging of the Optic Pathway in Primary Open-Angle Glaucoma: A Preliminary Study. Am J Neuroradiol. 2012;33:128–134. doi: 10.3174/ajnr.A2714. [DOI] [PMC free article] [PubMed] [Google Scholar]
- 29.Mills RP, Budenz DL, Lee PP, et al. Categorizing the stage of glaucoma from pre-diagnosis to end-stage disease. Am J Ophthalmol. 2006;141:24–30. doi: 10.1016/j.ajo.2005.07.044. [DOI] [PubMed] [Google Scholar]
- 30.Quigley HA, Green WR. The histology of human glaucoma cupping and optic nerve damage: clinicopathologic correlation in 21 eyes. Ophthalmology. 1979;86:1803–1030. doi: 10.1016/s0161-6420(79)35338-6. [DOI] [PubMed] [Google Scholar]
- 31.Quigley HA, Addicks EM, Green WR, Maumenee AE. Optic nerve damage in human glaucoma. II. The site of injury and susceptibility to damage. Arch Ophthalmol. 1981;99:635–649. doi: 10.1001/archopht.1981.03930010635009. [DOI] [PubMed] [Google Scholar]
- 32.Wheeler-Kingshott CA, Parker GJ, Symms MR, Hickman SJ, Tofts PS, Miller DH, Barker GJ. ADC mapping of the human optic nerve: increased resolution, coverage, and reliability with CSF-suppressed ZOOM-EPI. Magn Reson Med. 2002;47:24–31. doi: 10.1002/mrm.10016. [DOI] [PubMed] [Google Scholar]
- 33.Dowell NG, Jenkins TM, Ciccarelli O, Miller DH, Wheeler-Kingshott CA. Contiguous-slice zonally oblique multislice (CO-ZOOM) diffusion tensor imaging: examples of in vivo spinal cord and optic nerve applications. J Magn Reson Imaging. 2009;29(2):454–460. doi: 10.1002/jmri.21656. [DOI] [PubMed] [Google Scholar]
- 34.Hickman SJ, Toosy AT, Jones SJ, Altmann DR, Miszkiel KA, MacManus DG, Barker GJ, Plant GT, Thompson AJ, Miller DH. A serial MRI study following optic nerve mean area in acute optic neuritis. Brain. 2004;127(Pt 11):2498–2505. doi: 10.1093/brain/awh284. [DOI] [PubMed] [Google Scholar]
- 35.Smith SA, Williams ZR, Ratchford JN, Newsome SD, Farrell SK, Farrell JA, Gifford A, Miller NR, van Zijl PC, Calabresi PA, Reich DS. Diffusion tensor imaging of the optic nerve in multiple sclerosis: association with retinal damage and visual disability. AJNR Am J Neuroradiol. 2011;32:1662–1668. doi: 10.3174/ajnr.A2574. [DOI] [PMC free article] [PubMed] [Google Scholar]