

Abstract
Objectives
The aim was to examine the relationship between baseline and on-study apolipoproteins (apo) A-1 and B and lipoprotein(a) [Lp(a)] levels and the development of subsequent cardiovascular (CV) events in the AIM-HIGH Trial.
Background
Niacin has been reported to lower apoB and Lp(a) and to raise apoA-1.
Method
Individuals with CV disease and low baseline levels of HDL-C were randomized to simvastatin plus placebo or simvastatin plus extended-release niacin (ERN, 1500–2000 mg/day), with ezetimibe added, as needed, in both groups to maintain an on-treatment LDL-C in the range of 40–80 mg/dL. Hazard ratios (HR) were used to evaluate the relationship between levels of apo A-1, apoB and Lp(a) and CV events in each treatment group.
Results
Baseline apoB and the apoB/apoA-I ratio were significantly predictive of CV events only for the placebo group (HR=1.17, p=0.018 and HR=1.19, p=0.016). Baseline and on-study Lp(a) were predictive of CV events in both simvastatin+placebo (baseline HR= 1.24, p=0.002 and on-study HR=1.21, p=0.017) and the simvastatin+ERN group (baseline HR=1.25, p=0.001 and on-study HR=1.18 p=0.028). ERN modestly increased 1-year apoA-1 (7%), decreased apoB (13%), decreased the ApoB/ApoA-1 ratio (19%), and decreased Lp(a) 21%, but did not reduce CV events.
Conclusions
Lp(a) was associated with increased CV risk in both treatment groups indicating that it contributes to residual CV risk. However, there was no evidence that ERN reduced CV risk despite favorable lipoprotein changes.
Keywords: LIPOPROTEIN(A), APOLIPOPROTEINS, CARDIOVASCULAR RISK, NIACIN, SIMVASTATIN
Introduction
The Atherothrombosis Intervention in Metabolic Syndrome with Low HDL/High Triglycerides: Impact on Global Health Outcomes (AIM-HIGH) Trial was a prospective, randomized, double-blind clinical trial of participants with established atherothrombotic cardiovascular (CV) disease, low levels of high density lipoprotein-cholesterol (HDL-C) and elevated triglycerides at baseline (1). The AIM-HIGH Trial investigators previously reported that among patients with CV disease treated with LDL-lowering therapy (mean LDL-C at baseline 71 mg/dL/1.81 mmol/L), addition of ERN to simvastatin therapy during a three-year mean follow-up period was associated with a 25% increase in HDL-C, a further 12% reduction in LDL-C, and a 30% additional reduction in triglyceride levels (1). However, the trial was stopped 18 months earlier than planned because a pre-defined lack of efficacy boundary had been crossed, so the addition of ERN failed to further reduce the incidence of CV events. This report focuses on the effect of LDL-lowering therapy (simvastatin with or without ezetimibe) plus ERN versus LDL-lowering therapy alone on Lp(a), apoA-1 and apoB, and the relationships of their levels, at baseline and on-treatment, to CV outcomes.
Our aims were first, to evaluate the impact of intensive LDL-lowering therapy alone or in combination with ERN on apoA-1, apoB and Lp(a); second, to assess whether apoA-1, apoB or Lp(a) levels are predictive of CV events in either group at baseline or in-trial, and third, to assess whether a subgroup of participants, defined by baseline apolipoprotein values, who demonstrated clinical benefits from niacin therapy could be identified.
Methods
Study Population
The AIM-HIGH study population and baseline characteristics were previously described (1). The primary composite outcome was death from coronary disease, nonfatal myocardial infarction, ischemic stroke, hospitalization for acute coronary syndrome, or symptom-driven coronary or cerebrovascular revascularization. In this paper, we evaluated only participants prescribed statin therapy prior to the trial (n=3,196, 94% of randomized subjects). Per protocol, samples for apolipoprotein analyses were collected at baseline and one year post-baseline.
Analytical Measurements
Analyses of apoA-1 and apoB were performed using Siemens reagent on a BNII nephelometer. Analysis of Lp(a) was performed by a monoclonal antibody-based ELISA method developed in the laboratory as previously reported (2) and considered “the gold standard” method for measuring Lp(a).
Statistical Analyses
Baseline Lp(a) values were compared to the Framingham study using the Wilcoxon Rank-Sum test. Treatment differences for change from baseline are presented as least-square means, from generalized linear models including treatment, gender, diabetes, baseline imbalances and baseline apolipoprotein as covariates. Percent change is calculated from these results. Relationships between apolipoproteins and cardiovascular events were examined using the primary study endpoint.
Hazard ratios examining the relationship between baseline values and events were calculated from Cox Proportional Hazards models, adjusted for gender, diabetes, and baseline ApoA-1. Heterogeneity of the relationship between baseline values and events across randomization assignment was assessed by adding value-by-treatment interaction terms. Subgroups were examined using quartiles for Lp(a) and tertiles otherwise. Differences in the effect of treatment across baseline levels of Lp(a) and apoB/apoA-1 were tested by adding a level-by-treatment interaction term to the models.
The relationship between on-study standardized apolipoprotein levels and events were evaluated using Cox Proportional Hazards Models with time-dependent covariates, adjusted for gender, diabetes, baseline ApoA-1 and HDL-2C. Subjects who reached the primary endpoint prior to 1 year (scheduled collection) were excluded from this analysis.
Two-sided P-values < 0.05 were considered significant. No adjustments were made for multiple testing. SAS Version 9.2 was used for all statistical analyses.
Results
Participants and Baseline Characteristics
The mean age of study participants was 63.7 years, 85.2% were men and 92.2% were Caucasian. Baseline demographic and clinical characteristics were similar in the two groups randomized to either control LDL-lowering therapy or LDL-lowering therapy + ERN, except mean body mass index (BMI), which was slightly lower in the control group (30.9 vs. 31.5, p= 0.003).
Baseline Apolipoprotein and Lp(a) Levels
Consistent with participant selection criteria, mean apoB and apoA-1 levels were low. However, the median level of Lp(a) (33.8 nmol/L) was elevated as compared to the median Lp(a) level (20 nmol/L) of healthy, predominantly Caucasian adults from Framingham (3). Comparison of the Lp(a) distribution of AIM-HIGH with the Framingham cohort, determined by the same ELISA method, indicates that the Lp(a) distribution at baseline of the AIM-HIGH participants was shifted to higher levels (Figure 1). Nearly 30% of the AIM-HIGH cohort at baseline had Lp(a) levels >100 nmol/L compared to 20% of Framingham.
Figure 1. Comparison of AIM-HIGH and Framingham baseline Lp(a) distribution.
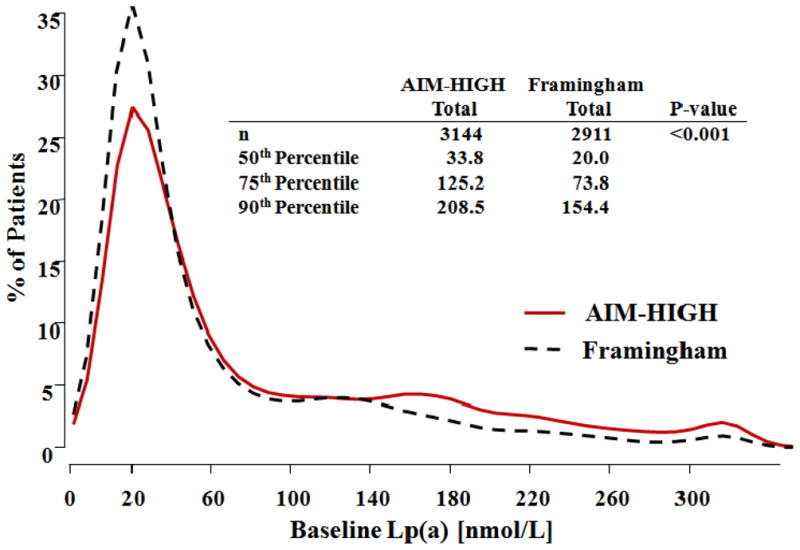
Histogram of baseline Lp(a) [nmol/L] for each study. Lp(a) distributions are compared using the Wilcoxon test.
Apolipoprotein and Lp(a) Levels After One Year of Treatment
In the ERN group and the placebo group, apoB decreased by 13% and 3%, apoA-1 increased by 7% and 2% and the apoB/apoA-1 ratio decreased by 19% and 7%, respectively (Table 1). For the ERN group, Lp(a) decreased by 21% overall with 20%, 39%, and 64% decreases in the 50th, 75th and 90th Lp(a) percentiles, respectively. An overall decrease of 6% for Lp(a) was also observed in the placebo group; thus the overall least-square mean decrease in Lp(a) due to ERN was 19%.
Table 1.
Least-square mean values at baseline, year 1, and percent change in apolipoproteins and Lp(a)*
| Test | Statin + Placebo | Statin + ERN | Diff. in % Chg‡ vs. placebo | ||||||
|---|---|---|---|---|---|---|---|---|---|
|
| |||||||||
| N | Base | Year 1 | % Chg† | N | Base | Year 1 | % Chg† | ||
| ApoB (mg/dl) | 1443 | 82.0 | 79.6 | −2.9 | 1424 | 81.8 | 71.3 | −12.8 | −10.7§ |
| ApoA-1 (mg/dl) | 1443 | 126.2 | 128.6 | 1.9 | 1424 | 125.6 | 134.5 | 7.1 | 4.7§ |
| ApoB/ApoA-1 Ratio | 1459 | 0.7 | 0.6 | −6.6 | 1440 | 0.7 | 0.5 | −19.4 | −13.6 |
| Lp(a) (nmol/L) | 1440 | 78.3 | 73.7 | −5.9 | 1427 | 80.2 | 63.4 | −21.0 | −19.4¶ |
| Log Lp(a) (nmol/L) | 1440 | 3.5 | 3.4 | −3.4 | 1427 | 3.5 | 3.2 | −9.9 | −9.7¶ |
Participants with measurements at baseline and 1 year post-baseline are included. Baseline ANCOVA models adjusted for gender and diabetes; Year 1 ANCOVA models adjusted for gender, diabetes, ApoA-I and HDL-2C (imbalanced at baseline).
Percent change from baseline to year 1 post-baseline.
Based on ANCOVA.
indicates p<0.001,
indicates p<0.05 for comparison of percent change by treatment.
ERN = Extended-release niacin; N = number of patients with data; Base = baseline value; Chg = change from baseline to year 1; Diff = difference
Baseline Apolipoprotein and Lp(a) Levels and Subsequent CV Events
Baseline levels of apoB and apoB/apoA-1 were associated with CV events only in the placebo and not in the ERN group, but the treatment interactions were not significant. Lp(a) was significantly associated with CV events and exhibited the highest hazard ratios in both treatment groups (Table 2). As shown in Figures 2 and 3, similar hazard ratios for the 2nd, 3rd and 4th Lp(a) quartiles were observed in the placebo and ERN groups (1.19, 1.37 and 1.87, vs. 1.19, 1.37 and 1.90, respectively). Kaplan-Meier estimates of the percentages of participants free from a primary event by baseline Lp(a) quartile for both treatment groups are shown in Figures 2 and 3.
Table 2.
Association between a one standard deviation increase in baseline* apolipoproteins and Lp(a) and cardiovascular events
| Test | SD | Statin + Placebo | Statin + ERN | Int. P-value‡ | ||||||
|---|---|---|---|---|---|---|---|---|---|---|
|
| ||||||||||
| Hazard Ratio† | 95% CI | P-value | Hazard Ratio† | 95% CI | P-value | |||||
| ApoB (mg/dl) | 18.3 | 1.17 | 1.03 | 1.33 | 0.018 | 1.11 | 0.97 | 1.27 | 0.124 | 0.905 |
| ApoA-1 (mg/dl) | 16.2 | 0.94 | 0.83 | 1.07 | 0.373 | 0.93 | 0.81 | 1.07 | 0.337 | 0.82 |
| ApoB/apoA-1 Ratio | 0.16 | 1.19 | 1.03 | 1.36 | 0.016 | 1.13 | 0.99 | 1.30 | 0.078 | 0.87 |
| Lp(a) (nmol/L) | 88.7 | 1.22 | 1.10 | 1.35 | <0.001 | 1.16 | 1.04 | 1.28 | 0.006 | 0.646 |
| Log Lp(a) (nmol/L) | 1.55 | 1.24 | 1.08 | 1.43 | 0.002 | 1.25 | 1.10 | 1.42 | 0.001 | 0.987 |
Proportional hazards models adjusted for stratification factors and ApoA-1.
Hazard ratio is the increase in risk of an increase of one standard deviation.
Test for heterogeneity of treatment effect across values.
ERN = Extended-release niacin; CI = confidence interval; Int. = Interaction between randomization assignment and value
Figure 2. Time to first cardiovascular event for statin + placebo arm by baseline Lp(a) quartile.
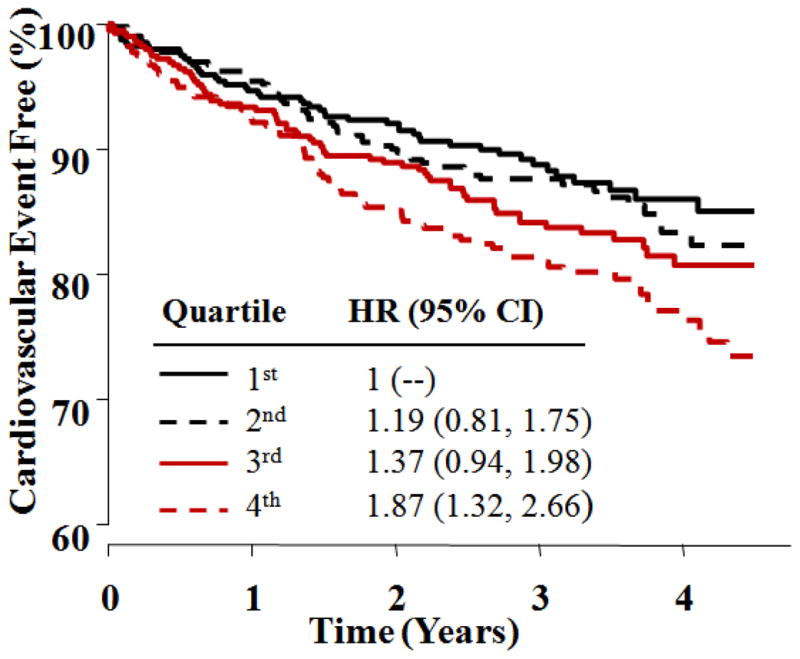
Kaplan-Meier curves show time to first CV event for quartiles of baseline Lp(a) [nmol/L] in patients randomized to LDL-lowering therapy + placebo. HR and 95% CI are based on Cox Proportional Hazards regression, including terms for gender and diabetes. HR = Hazard Ratio; CI = Confidence Interval
Figure 3. Time to first cardiovascular event for statin + niacin arm by baseline Lp(a) quartiles.
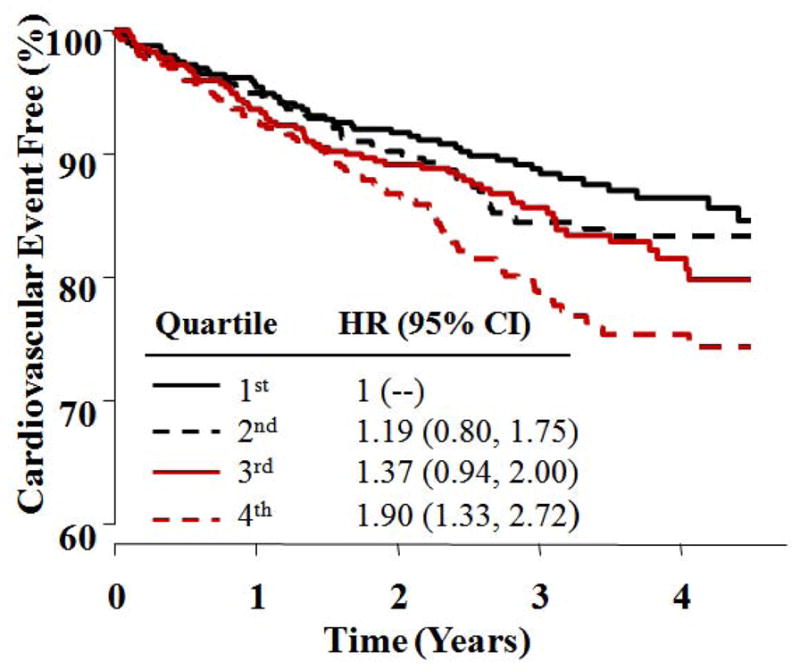
Kaplan-Meier curves show time to first CV event for quartiles of baseline Lp(a) [nmol/L] in patients randomized to LDL-lowering therapy + niacin. HR and 95% CI are based on Cox Proportional Hazards regression, including terms for gender and diabetes. HR = Hazard Ratio; CI = Confidence Interval
1-Year Apolipoprotein and Lp(a) Levels and CV Events Within Treatment Groups
A one standard deviation (0.16) higher apoB/apoA-1 ratio in the placebo group was associated with a 21% higher risk of a primary event (p=0.031), and a one standard deviation (1.55) higher log Lp(a) was associated with a 21% increase in CV event risk (HR: 1.21, p=0.017). For the ERN group, apoB/apoA-1 at 1 year was not associated with CV event risk (HR 1.06, p=0.50), while the log Lp(a) level did remain related to CV event risk (HR=1.18, p=0.028)(Table 3).
Table 3.
Association between a one standard deviation increase in apolipoproteins and Lp(a) levels after one year of treatment* and cardiovascular events
| Test | SD | Statin + Placebo | Statin + ERN | Int. P-value‡ | ||||||
|---|---|---|---|---|---|---|---|---|---|---|
|
| ||||||||||
| Hazard Ratio† | 95% CI | P-value | Hazard Ratio† | 95% CI | P-value | |||||
| ApoB (mg/dl) | 18.3 | 1.15 | 0.98 | 1.35 | 0.092 | 1.04 | 0.88 | 1.23 | 0.648 | 0.457 |
| ApoA-1 (mg/dl) | 16.2 | 0.89 | 0.75 | 1.06 | 0.185 | 1.03 | 0.86 | 1.23 | 0.734 | 0.717 |
| ApoB/apoA-1 Ratio | 0.16 | 1.21 | 1.02 | 1.43 | 0.031 | 1.06 | 0.90 | 1.25 | 0.499 | 0.452 |
| Lp(a) (nmol/L) | 88.7 | 1.23 | 1.07 | 1.42 | 0.004 | 1.18 | 1.00 | 1.39 | 0.048 | 0.624 |
| Log Lp(a) (nmol/L) | 1.55 | 1.21 | 1.03 | 1.42 | 0.017 | 1.18 | 1.02 | 1.36 | 0.028 | 0.647 |
Proportional hazards models adjusted for stratification factors, ApoA-1 and HDL-2C.
Hazard ratio is the increase in risk of an increase of one standard deviation.
Test for heterogeneity of treatment effect across values.
ERN = Extended-release niacin; CI = confidence interval; Int. = Interaction between randomization assignment and value
Comparison of On-Treatment Apolipoprotein and Lp(a) Levels and CV Events Between Treatment Groups
Overall, and within each quartile of baseline Lp(a), similar numbers of events occurred in the placebo and ERN groups (for the highest Lp(a) quartile, 78 events in the placebo group vs. 83 in the ERN group). There was no significant difference in primary event rate between the placebo and ERN group for any quartile of baseline Lp(a) [p=0.994 for heterogeneity of treatment effect by Lp(a) quartile], despite greater decreases in Lp(a) for those taking ERN as compared to placebo. Comparing baseline quartiles of Lp(a) between treatment groups, the hazard ratio for the highest quartile was 0.98 (95% CI 0.73–1.32); similarly, there was no effect of ERN treatment in any of the lower quartiles. From this analysis it is clear that even the on-study ERN group in the highest Lp(a) quartile (Lp(a) > 125 nmol/L) did not benefit from the addition of niacin to the statin-based therapy.
Because niacin increases apoA-1, lowers apoB and, consequently, lowers the apoB/apoA-1, we also evaluated the hazard ratio for apoB/apoA-1 tertiles at baseline. Within the highest tertile of apoB/apoA-1, there was no detectable reduction in CV event risk with ERN.
Discussion
The principal findings of our study were: at one year, compared to the placebo group, those randomized to ERN had significantly higher apoA-I levels, a lower apoB/apoA-I ratio and lower levels of Lp(a); despite these favorable changes with ERN, apoA-1, apoB and Lp(a) variables did not identify any subgroup of participants who benefited from ERN therapy. Baseline and on-study Lp(a) predicted CV events in both treatment groups.
Lp(a) Levels and the Prediction of CV Events
A particularly interesting result of the AIM-HIGH trial is that baseline and on-study Lp(a) predicted CV events in both the control LDL-lowering therapy + placebo and LDL-lowering therapy + ERN arms, suggesting that Lp(a) still contributes to residual CV risk in patients achieving target LDL-C levels with statin therapy. These results contradict our earlier post-hoc analysis of the Familial Atheroslerosis Treatment Study, where, in men with CAD and elevated LDL-C, Lp(a) correlated strongly with both baseline CV disease severity and progression in the placebo group (4). However, in those receiving statin, in whom LDL-C was reduced substantially but Lp(a) levels were unaffected, Lp(a) levels were no longer associated with risk of CV events or progression. Meta-analysis has demonstrated a consistent, continuous and independent association between Lp(a) level and CV risk without indicating a specific threshold (5). Despite desire for a specific clinical risk threshold (6), based on meta-analyses and consistent with our analysis of Lp(a) quartiles in the AIM-HIGH trial, CV disease risk continues to increase at high levels of Lp(a). Our study also indicates that ERN is not associated with clinical benefit, even for those with the highest baseline Lp(a) levels.
Causality of Lp(a) for CV Disease
Several studies have provided strong support for causality of elevated Lp(a) for premature coronary artery disease (7,8). Further support for this causality depends on demonstrating that reduction of elevated Lp(a) reduces CV events. Jaeger et al. (9) treated patients with CV disease and elevated Lp(a) >95th percentile with lipid lowering drugs to lower LDL-C. Subsequently, these patients underwent LDL apheresis which dramatically lowered Lp(a) by 73%. The rate of major adverse CV events was reduced in patients with either further substantial or minimal LDL reduction, suggesting that lowering Lp(a) was beneficial. Participants in the AIM-HIGH study treated with ERN had only a modest lowering of Lp(a) of 19% compared to placebo and no reduction in CV events. While it is possible that the between-group difference in Lp(a) levels was too small to detect a benefit, a therapeutic intervention that lowers Lp(a) more effectively and selectively would be a stronger test of the hypothesis that Lp(a) reduction decreases CV events.
Conclusions
The AIM-HIGH trial demonstrated that Lp(a) contributes to residual CV risk in patients who achieved target LDL-C levels with statin therapy. We have further observed that favorable changes in apoliproteins and Lp(a) from ERN did not result in CV event reduction. It is possible that the relatively modest differences between the treatment groups may have been insufficient to cause a reduction in CV risk over the study three-year treatment. The much larger HPS-2-THRIVE clinical trial, performed in over 25,000 subjects, appears to confirm the lack of clinical benefit of niacin added to LDL-lowering therapy on CV outcomes observed in the AIM-HIGH study (11).
Acknowledgments
Support: Supported by the National Heart, Lung, and Blood Institute (U01-HL-081616 and U01-HL-081649) and by an unrestricted grant from Abbott Laboratories (now AbbVie), Chicago, IL. Abbott Laboratories donated the extended-release niacin, the matching placebo, and the ezetimibe; Merck donated the simvastatin. Neither of these companies had any role in the oversight or design of the study, or in the analysis or interpretation of the data.
Abbreviations
- AIM-HIGH
Atherothrombosis Intervention in Metabolic Syndrome with Low HDL/High Triglyceride and Impact on Global Health Outcomes
- Apo
apolipoprotein
- ERN
extended-release niacin
- CV
cardiovascular
- HDL-C
high density lipoproteins
- HR
hazard ratio
- LDL-C
low density lipoprotein
- Lp(a)
lipoprotein(a)
Footnotes
Publisher's Disclaimer: This is a PDF file of an unedited manuscript that has been accepted for publication. As a service to our customers we are providing this early version of the manuscript. The manuscript will undergo copyediting, typesetting, and review of the resulting proof before it is published in its final citable form. Please note that during the production process errors may be discovered which could affect the content, and all legal disclaimers that apply to the journal pertain.
References
- 1.Boden WE, Probstfield JL, Anderson T, et al. The AIM-HIGH Investigators. Niacin in patients with Low HDL Cholesterol levels receiving intensive Statin therapy. N Engl J Med. 2011;365:2255–67. doi: 10.1056/NEJMoa1107579. [DOI] [PubMed] [Google Scholar]
- 2.Marcovina SM, Albers JJ, Gabel B, Koschinsky ML, Gaur VP. Effects of the number of apolipoprotein(a) kringle 4 domains on immunochemical measurement of lipoprotein(a) Clin Chem. 1995;41:246–55. [PubMed] [Google Scholar]
- 3.Lamon-Fava S, Marconvina SM, Albers JJ, et al. Lp(a) levels, apo(a) isoform size, and coronary heart disease risk in the Framingham Offspring Study. J Lipid Res. 2011;52:1181–7. doi: 10.1194/jlr.M012526. [DOI] [PMC free article] [PubMed] [Google Scholar]
- 4.Maher VMG, Brown BG, Marcovina SM, et al. Effects of lowering elevated LDL cholesterol on the cardiovascular risk of lipoprotein(a) JAMA. 1995;274:1771–74. [PubMed] [Google Scholar]
- 5.Erquo S, Kaptoge S, Perry PL, et al. Lipoprotein(a) concentration and the risk of coronary heart disease, stroke, and nonvascular mortality. JAMA. 2009;302:412–23. doi: 10.1001/jama.2009.1063. [DOI] [PMC free article] [PubMed] [Google Scholar]
- 6.Nordesgaard BG, Chapman MJ, Ray K, Boren J, Andreitti F, Watts GF, et al. Lipoprotein(a) as a cardiovascular risk factor: current status. Eur Heart J. 2010;31:2844–53. doi: 10.1093/eurheartj/ehq386. [DOI] [PMC free article] [PubMed] [Google Scholar]
- 7.Kamstrup PR, Tybjaerg-Hansen A, Strffensen R, Nordestgaard BG. Gentically elevated lipoprotein(a) and increased risk of myocardial infarction. JAMA. 2009;301:2331–39. doi: 10.1001/jama.2009.801. [DOI] [PubMed] [Google Scholar]
- 8.Tregouët DA, Konig IR, Erdmann J, et al. Genome-wide haplotype association study identifies the SLC22A3-LPAL2-LPA gene cluster as a risk locus for coronary artery disease. Nat Genet. 2009;41:283–5. doi: 10.1038/ng.314. [DOI] [PubMed] [Google Scholar]
- 9.Jaeger BR, Richter Y, Nagel D, et al. Longitudinal cohort study on the effectiveness of lipid apheresis treatment to reduce high lipoprotein(a) levels and prevent major adverse coronary events. Nat Clin Prac Cardiovasc Med. 2009;6:229–39. doi: 10.1038/ncpcardio1456. [DOI] [PubMed] [Google Scholar]
- 10.HPS2-THRIVE Collaborative Group. HPS2-THRIVE randomized placebo- controlled trial in 25,673 high-risk participants of ER niacin/laropiprant: trial design, prespecified muscle and liver outcomes, and reasons for stopping study treatment. Eur Heart J. doi: 10.1093/eurheartj/eht055. [DOI] [PMC free article] [PubMed] [Google Scholar]