

Abstract
Background
Right ventricular (RV) systolic function is an important prognostic determinant of cardiopulmonary pathologies in premature infants. Measurements of dominant RV longitudinal deformation are likely to provide a sensitive measure of RV function. An approach for image acquisition and post-acquisition processing is needed for reliable and reproducible measurements of myocardial deformation by two-dimensional speckle-tracking echocardiographic (2DSTE). The aim of this study was to determine the feasibility and reproducibility of 2DSTE measurement of RV peak global longitudinal strain (pGLS) and systolic strain rate (pGLSr) in premature infants, and establish methods for acquiring and analyzing strain
Methods
We designed the study in two phases: (i) a Training Phase to develop methods of image acquisition and post-processing in a cohort of 30 premature infants (born at 28 ± 1 weeks), and (ii) a Study Phase to prospectively test in a separate cohort of 50 premature infants (born at 27 ± 1 weeks) if the methods improved the feasibility and reproducibility of RV pGLS and pGLSr measurements to a clinically significant level assessed by Bland Altman analysis (bias, limits of agreement (LOA), coefficient of variation (CV), and intra-class correlation (ICC).
Results
Strain imaging was feasible from 84% of the acquisitions using the methods developed for optimal speckle brightness and frame rate for RV-focused image acquisition. There was high intra-observer (bias 3%, 95% LOA −1.6 to +1.6; CV 2.7%; ICC 0.97, p=0.02) and inter-observer (bias 7%, 95% LOA −4.8 to +4.73; CV 3.9%; ICC 0.93; p<0.05) reproducibility, with excellent linear correlation between the two pGLS measurements (r=0.97, p<0.01 and r=0.93, p<0.05, respectively).
Conclusion
This study demonstrates high clinical feasibility and reproducibility of RV pGLS and RV pGLSr measurements by 2DSTE in premature infants and offers methods for image acquisition and data analysis for systolic strain imaging that can provide a reliable assessment of global RV function.
Keywords: Right Ventricle, Systolic function, Global Longitudinal Strain, Speckle Tracking Echocardiography, Premature Infants
Introduction
Right ventricular (RV) systolic function is an important prognostic determinant of cardiopulmonary pathologies in premature infants (1–3). The recommended methods to quantitatively assess RV systolic function in neonates include tricuspid annular plane systolic excursion (TAPSE) and fractional area change (FAC%) in apical 4-chamber views, but they require further validation in the neonatal population.” (1,4,5). RV myocardial performance index (RV MPI) has also been used to assess systolic RV function in neonates, but this measure also requires validation as its impact on management and outcome remains uncertain (3,4). Therefore, qualitative assessment of RV function is still used in clinical practice (4,5). However, unlike the left ventricle (LV), the tripartite morphology and different myofiber architecture of the RV do not always lend itself for clinically applicable qualitative assessment.
The RV myofiber architecture is composed of superficial circumferential and dominant deep longitudinal layers aligned base to apex that allow for greater longitudinal than radial shortening and minimum twisting and rotational movements (6–9). The longitudinal shortening is the dominant deformation of the RV that provides the major contribution to stroke volume during systole (9). Myocardial strain that describes this longitudinal deformation under an applied force is likely to provide a new sensitive measure of the RV function in neonates (3,10). Two-dimensional speckle tracking echocardiography (2DSTE) is a relatively new angle-independent method for myocardial strain measurement that does not require geometric assumptions for its estimations (11–14). Myocardial strain measurements have been used to characterize the RV function in adults, but have not yet been applied to newborn and premature infants (5,15,16). The quantification of the uncertainties associated with speckle-tracking based estimates of myocardial deformation, as well as the lack of “standardization” in acquisition and post-acquisition processing of 2DSTE have introduced the elements of variation and imprecision in STE-measured strain and precluded its clinical application in premature infants (16,17). Therefore, the objective of this study was to determine the clinical feasibility and reproducibility of 2DSTE-measured global longitudinal strain imaging of the RV in premature infants and establish methods for image acquisition and data analyses of strain measurements. This study focuses on developing a methodology that is likely to enhance the feasibility and reproducibility of RV peak global longitudinal strain and systolic strain rate in premature infants. We did not evaluate the precision and accuracy of these measurements with respect to normal and pathologic mechanisms of physiologic adaptation in the newborn infant.
Methods
Study Population
The factors that modulate variability in strain measurement by 2DSTE are (i) variability in image acquisition, (ii) intra-observer and inter-observer variability in post-acquisition processing, and (iii) differences between echocardiographic equipment and proprietary software for image analysis (16–19). In this study we only addressed the first two of theses factors. The image acquisition and data processing methods were developed with the use of one commercially available ultrasound scanner (Vivid 9, General Electric Medical Systems, Milwaukee, WI) and one vendor-customized software workstation package (EchoPAC™, version 110.0.x; General Electric Medical Systems, Horten, Norway).
To addressed the first two factors: (i) variability in image acquisition, and (ii) intra-observer and inter-observer variability in post-acquisition processing, we developed a cardiac strain imaging and post-processing analysis protocol (appendix) from a (1) Training Phase cohort of 30 echocardiographic images in 30 premature infants (born at 28 ± 1 weeks) between August 2010 and August 2011. We then tested this protocol for variability in a separate (2) Study Phase cohort with 100 images from 50 premature infants (born at 27 ± 1 weeks), obtained at two time points four weeks apart, between August 2011 and August 2012. To measure the reproducibility of myocardial strain indices, we selected a random sampling of 60% of the feasible images from the Study Phase cohort. We obtained informed consent from the parents and the institutional review board of Washington University approved the study.
Training Phase
Cardiac imaging acquisition “uncertainties” were identified in the Training Phase cohort to help develop a protocol (17,24). The standard apical 4-chamber view used to acquire strain measurements for the left ventricle does not always include the entire RV free wall in its imaging plane and leads to poor speckle tracking capabilities (Movie 1). This uncertainty was addressed by acquiring RV-focused images (25). In this view, the RV is centered in the imaging plane sector to define the full extent of RV free wall with no visible gaps. This RV focused view avoids plane shifts that lead to the loss of optimum number of RV segments throughout diastole and systole for tracking, particularly at the basal region (2). The uncertainty regarding optimal myocardial speckle brightness (defined by clear demarcation of the endocardial border and brightness of the myocardium in B-mode two dimensional optimum gray scales) was addressed by multiple adjustments in imaging parameters (Appendix). This view also minimized near field artifacts and echo reverberations.
Semi-automated post-processing strain data analysis uncertainties were identified and quantified in the protocol. Poor manual placement of the tracing of the endocardial border by an observer often resulted in inaccurate software-generated regions of interest (ROI) and unreliable strain data. To ensure the efficiency of the software-generated ROI and strain curves, we identified three specific apical and basal landmarks for the RV to aid the observer in the manual placement of the endocardial tracing. A ‘sail sign’ was manually traced from the (i) septal side of the tricuspid annular plan (septal-tricuspid annular hinge point) to (ii) apical-septal point and then to the (iii) RV free wall side (RVFW) of the tricuspid annular plane (lateral-tricuspid annular hinge point) (50,51). These three landmarks enhanced the software tracking of the RV myocardial tissue (Figure 1). The ROI covered the endocardium and entire width of myocardium, excluding pericardium. The RV was then divided into six standard segments (at the basal, middle, and apical levels on the septal and RVFW side), and the software generated six corresponding time-strain curves. The peak of the average curve of all the segments was considered as peak global longitudinal strain (pGLS), (Figure 2).
Figure 1.
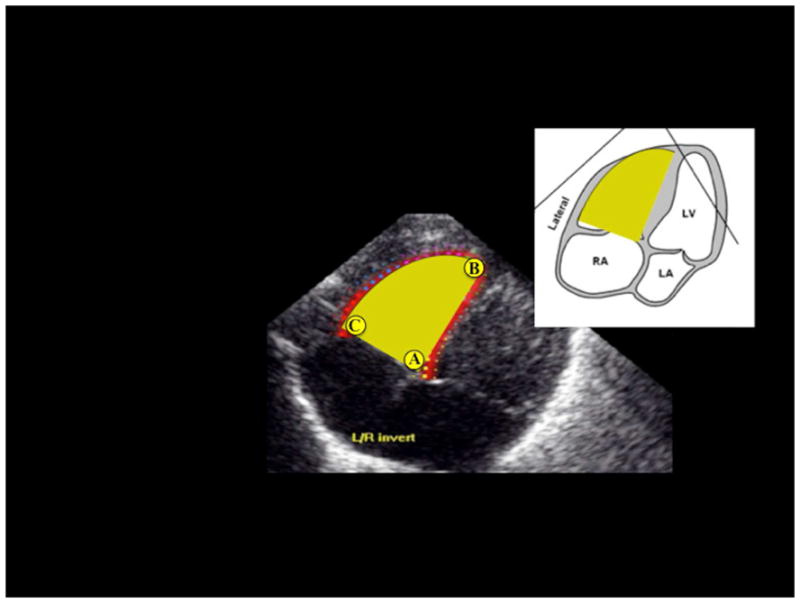
Three specific landmarks, one apical and two basal, are identified in the right ventricle (RV) focused image to delineate a “sail sign” around the inside of the endocardial boarder. These three landmarks are: A) the trigonal crux at the basal septal side of the trianular plane. B) the apical point at the apical junction of the septum and RV free wall (RVFW), and C) the lateral hinge point of the tricuspid valve at the basal RVFW side of the trianual plane and the RVFW.
Figure 2.

Strain imaging of the right ventricle in a premature infant using speckle-tracking echocardiography. The segmental strain is graphically presented by six different color-code curves and the global longitudinal strain by the white dotted curve. The peak of the average curve of all the segments (the dotted curve) was considered as peak global longitudinal strain (pGLS).
Frame rate has been considered an important aspect of image acquisition (24, 26). We have demonstrated previously that the reproducibility in children was the most robust for images obtained with frame rates between 60 and 90 frame/sec (24). Because resting heart rates in premature infants are relatively high, we balanced between a relative low frame rate that affects the precise measurements of magnitude of strain and strain rate and a high frame rate that potentially would compromise spatial resolution due to sacrifices in line density (21,27). Thus, we kept the frame rate of image acquisition between 90 and 120 frame/sec in this cohort of premature infants (Appendix).
Study Phase
The 50 premature infants (born at 27 ± 1 weeks) in the Study Phase were prospectively enrolled from among infants participating in the Prematurity and Respiratory Outcomes Program (PROP), a 7-center initiative sponsored by the National Heart, Lung and Blood Institute to identify physiological and biochemical markers of adverse pulmonary outcome at one year of age (Clinical Trials number: NCT01435187). All infants in the Study Phase were enrolled at Washington University/St. Louis Children’s Hospital (SLCH) NICU between September 2011 and August 2012 (Table 1). Inclusion criteria included premature infants born between 23 0/7 weeks and 28 6/7 weeks gestational age. Infants with congenital heart disease (except PDA and hemodynamically insignificant VSD or ASD) or other congenital anomalies were excluded. Each premature infant received an echocardiographic evaluation at two times points four weeks apart (n=100 total imaging studies). The timing of the first echocardiogram was carefully selected to occur at 32 weeks postmenstrual age (PMA) to avoid the early postnatal period of clinical and cardiopulmonary instability, frequent occurrence of patent ductus arteriosus and early mortality associated with extreme preterm birth. Choosing to study all infants at a common PMA, rather than chronological age, optimized the determination of the impact of gestational and chronological age on cardiac structure and function at specific developmental stage. The second echocardiogram was acquired four weeks later at 36 weeks PMA.
Table 1.
Demographic and clinical characteristics for the Training phase and Study phase
| Demographics | Training Phase | Study Phase | P value |
|---|---|---|---|
| Number of infants enrolled | 30 | 50 | |
| Numbers of images acquired | 30* | 100** | |
| Gestational Age at birth | 27 ± 1 | 27 ± 1 | 0.34 |
| Weight (kg) at birth | 1.0 ± 0.2 | 0.96 ± 0.2 | 0.28 |
| Weight (kg) at 1st Echocardiogram | 1.7 ± 0.4 | 1.42 ± 0.3 | 0.13 |
| Weight (kg) at 2nd Echocardiogram | NA | 2.21 ± 0.3 | |
| Male/female | 15/15 | 16/34 | 0.15 |
| Cardiovascular | |||
| PDA | 4/30 | 10/48*** | 0.18 |
| HR (beats/min) | 153 ± 18 | 164 ± 16 | 0.4 |
| SBP (mm Hg) | 75 ± 11 | 76 ± 9 | 0.2 |
| DBP (mm Hg) | 44 ± 10 | 45 ± 8 | 0.14 |
| MAP (mm Hg) | 54 ± 10 | 54 ± 7 | 0.19 |
| Respiratory | |||
| RR (breaths/min) | 58 ± 12 | 49 ± 8 | 0.37 |
| Pulse Oximetry (%) | 96 ± 3 | 97 ± 2 | 0.29 |
| Respiratory Support | 18/30 | 32/48**** | 0.18 |
Data are presented as mean ± SD.
SBP, Systolic Blood Pressure, MAP, Mean Arterial Blood Pressure
PDA, Patent ductus arteriosus. HR, Heart Rate, RR, Respiratory rate
In the Training phase echocardiograms were acquired from each enrolled premature infant at one time point.
In the Study phase echocardiograms were acquired from each enrolled premature infant at 2 time points 4 weeks apart.
48 images were randomly chosen for reproducibility analysis and a PDA was present in 10/48.
48 images were randomly chosen for reproducibility analysis and the infants required respiratory support (mechanical ventilation, continuous positive airway pressure, and/or oxygen) in 32/48.
Echocardiographic Evaluation of Myocardial Strain
Echocardiographic image acquisition
Echocardiographic evaluation was acquired in the resting state without sedation by one designated experienced pediatric cardiac sonographer (T.S.). Two-dimensional, real-time, gray scale images were obtained at two time points on all 50 patients by a commercially available ultrasound scanner (Vivid 9, GE Medical Systems, Milwaukee, WI). The images were obtained using a transducer (ranging between 7.5 MHz and 12 MHz) centered frequency phased-array probe and optimized to visualize the myocardial walls. The images were acquired in a right ventricle–focused image view (figure 3) (25). All the images included in this study were acquired with frame rates between 90–120 frames/sec. The cine loops were reviewed and only those with at least 3 consecutive measurable cardiac cycles were considered valid for the study. The image data were digitally stored in cine loop format for offline analysis by vendor-customized software (EchoPAC™, version 110.0.x; General Electric Medical Systems, Horten, Norway).
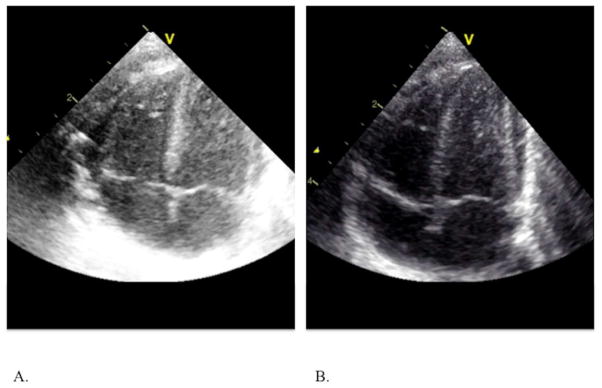
Figure 3.
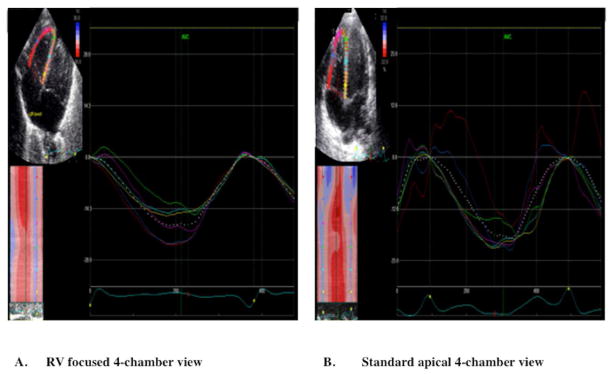
Cine-loop images of (A) RV focused 4 chamber echocardiographic view and (B) Standard apical four chamber view showing the six segmental strain curves graphically and the dotted line representing global longitudinal strain. (A) Longitudinal systolic strain curves obtained from the RV focused apical four-chamber view. The segmental strain curves are and synchronized. The RV focused view allows for proper tracking of the RVFW basal segment (red strain curve) by the software program and generates the highest longitudinal strain value. (B) Longitudinal systolic strain curves obtained from standard apical four-chamber view. In this view, the segmental strains are not synchronous at the basal region (red strain curve) of the RVFW because of an over excursion and inability of the software algorithm to properly track this segment.
Image Quality Assessment
We classified the images according to an image grading system defined by Colan et al 2012. (18) The system has five graded-levels: (1) Excellent; (2) Good; (3) Fair; (4) Poor; and (5) Unusable. We only included images rated to be “excellent” or “good” (images with the full extent of the RV myocardium clearly defined and contained within the image sector) by these criteria in the analysis (18).
Echocardiographic off-line analyses
All the images were transferred to a GE workstation (EchoPAC™, version 110.0.x; General Electric Medical Systems, Horten, Norway) for subsequent analyses. Offline 2D-strain analysis of the images was performed for the entire cardiac cycle following the measurement protocol described in Appendix. The peak of the average curve of all the segments was considered as peak global longitudinal strain (pGLS). (Figures 2 and 3) Two independent investigators measured the pGLS, global strain rate (pGLSr) in the RV endocardial and myocardial tissue using dedicated EchoPac 2DSTE analysis software.
Statistical Methods
All data are expressed as mean +/− SD or as percentages. Continuous variables were tested for normality using the Kolmogorov-Smirnov test and a histogram illustration of the data. Reproducibility of the strain measurements was assessed using inter- and intra- observer reliability measures on 60 percent of the feasible imaging studies from the Study Phase cohort (figure 4b). Each observer performed off-line analysis utilizing the same measurement protocol (Appendix). The intraobserver variability was assessed by one investigator (P.L.), who repeated the analysis (blinded to the initial results) on the same cardiac cycles 3 months apart to reduce recall bias. Interobserver variability was tested for all analyses by a second observer (G.S.) blinded to the results of the first observer. Observers were also blinded to the clinical status of the infants.
Figure 4.


Feasibility flow chart for (a) Training phase and (b) Study phase.
The reproducibility analysis for the peak global longitudinal strain measurements was based on a combination of a) Bland Altman plot analysis (28) (percentage bias, 95% limits of agreements), b) Coefficient of Variation (CV) (29), and c) intraclass correlation coefficient (ICC) (30). A bias < 10%, narrow 95% limit of agreement, a coefficient of variation < 15%, and an ICC > 0.85 have been recognized as measures of minimal variability and positive reproducibility in adults and children (24,31–33) for these measurements. The strength of agreement between the intra- and inter-observations was evaluated by simple linear regression analysis (Pearson’s correlation). A probability value of p< 0.05 was considered significant. The statistical analysis was performed using statistical software (SPSS version 14.0; SPSS, Inc., Chicago, IL).
Results
Patients’ Characteristics
Clinical (hemodynamic, respiratory) and demographic characteristics for both the training phase and study phase are summarized in Table 1. There were no significant clinical differences amongst the infants in each phase or between the training and study phase cohorts. For the reproducibility analysis (n=48 images, 60% of the feasible images from the study phase), 32 images were acquired in patients who required respiratory support, and two of these images were acquired from patients who were mechanically ventilated.
Feasibility Measurements
In the Training Phase, echocardiographic images of the RV were acquired either in the standard apical 4-chamber view or an RV focused apical 4-chamber view (Figure 4a). (25) Overall feasibility was demonstrated in 66% of the images acquired in the training phase. Only 40% of the images acquired in the standard apical 4-chamber view were feasible. The remaining 60% of the images obtained in standard apical 4-chamber view were graded as unusable for analysis because the RV was not imaged in entirety, primarily at the RV base, or graded as either fair or poor due to lack of adequate speckle brightness and near field artifacts (figure 4b). In contrast, 96% of the images acquired in the RV-focused view were feasible (p<0.01) for post-processing. These RV focused views permitted enhanced visualization of the RV, specifically at the base.
In the Study Phase, all 100 images were therefore acquired in the RV-focused view (Figure 4b). Only 5% of the images were graded as unusable because there were plane shifts that led to the loss of optimum number of RV segments for complete tracking, and were excluded from analysis. Strain measurements were generated on the remaining 95 images. Fifteen of these images (16%) were graded as either fair or poor because of acoustic shadowing and reverberations overlying the image at the right ventricle free wall or apex resulting in poor tracking, and were also excluded from reproducibility analysis.
Overall feasibility was demonstrated in 84% of the images obtained in the Study Phase: 80 out of 95 images were graded as excellent or good with the full right ventricle myocardium clearly defined, fully contained with the image sector, and with adequate speckle brightness and tracking.
Of these 80 feasible images, 40 were acquired at the first time point (32 weeks PMA) and 40 were acquired at the second time point (36 weeks PMA). To assess the reproducibility, 60% of the feasible images (n=48) were then randomly selected analysis (Figure 4a). Twenty-four of the 48 images were acquired at the first time point, and remaining 24 images were obtained from the second time point four weeks later. In addition, there were no significant clinical differences between the non-feasible and feasible groups in both the training and study phase cohorts (Table 2).
Table 2.
Demographic and clinical characteristics, by feasibility, for the Training phase and Study phase
| Demographics | Training Phase | Study Phase | P value | ||
|---|---|---|---|---|---|
| Number of infants enrolled | 30 | 50 | |||
| Numbers of images acquired | 30* | 100** | |||
| Feasible | Non-Feasible | Feasible | Non-Feasible | ||
| Numbers of images | 20 | 10 | 80 | 20 | |
| Gestational Age at birth | 27 ± 2 | 27 ± 2 | 27 ± 1 | 27 ± 1 | 0.38 |
| Weight (kg) at birth | 0.98 ± 0.3 | 1.01 ± 0.2 | 0.97 ± 0.2 | 0.96 ± 0.2 | 0.54 |
| Number of images at 1st Echocardiogram* | 20 | 10 | 40 | 10 | |
| Number of images at 2nd Echocardiogram** | NA | NA | 40 | 10 | |
| Weight (kg) at 1st Echocardiogram | 0.93 ± 0.3 | 0.99 ± 0.1 | 1.42 ± 0.3 | 1.41 ± 0.3 | 0.13 |
| Weight (kg) at 2nd Echocardiogram | NA | NA | 2.22 ± 0.3 | 2.13 ± 0.2 | 0.97 |
| Male/female (images) | 11/9 | 5/5 | 26/54 | 10/10 | 0.25 |
| Cardiovascular | |||||
| Patent ductus arteriousus (PDA) | 4/20 | 0/10 | 18/80 | 1/20 | 0.17 |
| Heart Rate (HR beats/min) | 151 ± 21 | 158 ± 9 | 163 ± 16 | 163 ± 17 | 0.08 |
| Systolic Blood Pressure (SBP mm Hg) | 75 ± 12 | 76 ± 9 | 76 ± 10 | 78 ± 9 | 0.85 |
| Diastolic Blood Pressure (DBP mm Hg) | 44 ± 11 | 43 ± 5 | 44 ± 9 | 47 ± 9 | 0.76 |
| Mean Arterial Pressure (Map mm Hg) | 54 ±11 | 54 ± 6 | 55 ±8 | 57 ± 8 | 0.77 |
| Respiratory | |||||
| Respiratory Rate (RR breaths/min) | 60 ± 12 | 54 ± 10 | 49 ± 8 | 50 ± 10 | 0.12 |
| Pulse Oximetry (%) | 96 ± 3 | 97 ± 1 | 97 ± 2 | 97 ± 3 | 0.21 |
| Respiratory Support*** | 16/20 | 8/10 | 52/80 | 12/20 | 0.56 |
Data are presented as mean ± SD.
NA, Not applicable. Images in the Training Phase were only acquired at one time point
In the Training Phase echocardiograms were acquired from each enrolled premature infant at one time point.
In the Study phase echocardiograms were acquired from each enrolled premature infant at one time point.
Respiratory support (mechanical ventilation, continuous positive airway pressure, and/or oxygen)
Reproducibility measurements
The reliability analysis is summarized in Table 2. Figures 5 and 6 presents the Bland-Altman plots for the intra- and inter- observer variability of the global longitudinal strain measurements (strain and strain rate), respectively. Figure 7 presents the correlation plots for the intra- and inter- observer relationship of the global longitudinal strain and strain rate.
Figure 5.
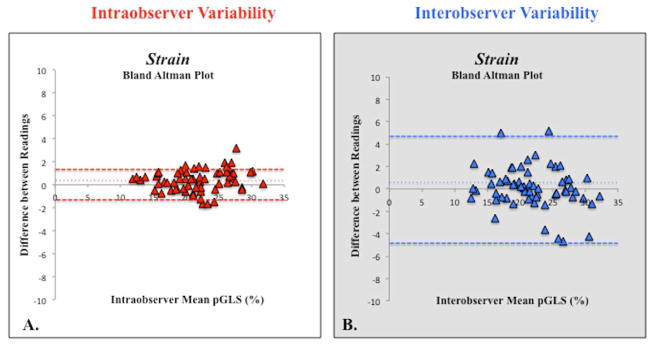
Bland-Altman plot of (A) intraobserver and (B) interobserver peak global longitudinal strain (pGLS) variability showing mean percentage bias (fine dotted line) and 95% limits of agreements (thick dotted lines).
Figure 6.
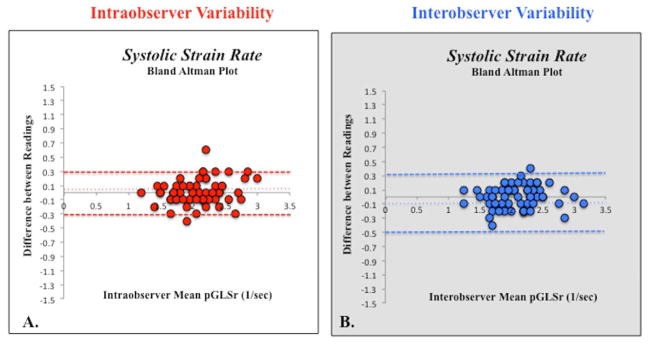
Bland-Altman plot of (A) intraobserver and (B) interobserver peak global longitudinal strain rate (pGLSr) variability showing mean percentage bias (fine dotted line) and 95% limits of agreements (thick dotted lines).
Figure 7.

Relationship between intra- and interobserver pGLS and pGLSr. (A) Correlation between the strain values measured by the same observer (intraoberver strain correlation). (B) Correlation between the strain values measured by two different observers (interobserver strain correlation). (C) Correlation between the strain rate values measured by the same observer. (Intraobserver strain rate correlation). (D) Correlation between the strain rate values measured by the same observer (interobserver strain rate correlation).
Strain Measurements and Intraobserver Reproducibility
Measurements of 2DSTE derived global longitudinal strain and strain rate by the same observer (P.L.) three months apart showed no significant bias with relatively narrow 95% limits of agreement (bias 3%, 95% LOA −1.6 to +1.6, and bias 5%, 95% LOA −0.32 to +0.32, respectively). The coefficient of variation (CV) for strain and strain rate were 2.7% and 4.4% respectively. The intraclass correlation coefficient (ICC) for strain and strain rate were 0.97 (0.93–0.98, p=0.01) and 0.90 (0.84–0.94, p=0.04), respectively. There was excellent linear agreement between the two measurements (r=0.97, p<0.001 and r=0.92, p=0.04, respectively) (Figure 7).
Strain Measurements and Interobserver Reproducibility
Measurements of 2DSTE-derived peak global longitudinal strain and strain rate by the two observers (P.L. and G.K.) also showed no significant bias with slightly wider 95% limits of agreement (bias 7%, 95% LOA −4.8 to +4.7, and bias 7%, 95% LOA −0.3 to +0.5, respectively). The CV for strain and strain rate were 3.9% and 4.5% respectively The ICC for strain and strain rate were 0.93 (0.89–0.96, p=0.03) and 0.90 (0.85–0.94, p=0.04), respectively. There was excellent linear agreement between the two measurements (r=0.93, p=0.03 and r=0.90, p=0.04, respectively) (Figure 7).
Strain Measurements and Respiratory Support
There was no difference between the intra- and inter-observer reproducibility strain imaging analysis (bias 4–5%, CV 3–5%, narrow LOA, and ICC 0.90–0.94 p<0.05) between the images acquired from patients who required respiratory support at the time of image acquisition (n=32) and those that did not (n=16).
Strain Measurements and Weight
There was no difference between the intra- and inter-observer reproducibility strain analysis (bias 4–6%, CV 2–5%, narrow LOA, and ICC 0.91–0.93 p<0.05) between the images acquired at the first time points (n=24, weight (kg) = 1.42 ± 0.3) and the images acquired four weeks later at the second time points (n=24, weight (kg) = 2.21 ± 0.3).
Frame Rate
All the images the Study Phase were acquired with frame rates between 90–120. The excluded images (16%) of the Study were also acquired with frame rates between 90–120 frame/s.
Discussion
Echocardiographic measures that are correlated with clinical events can be valuable predictors of outcomes. 2DSTE-measured RV strain measurements have been demonstrated to independently predict future clinical deterioration, right-sided heart failure, and mortality in adult patients with pulmonary hypertension (34). The RV is affected by a wide spectrum of conditions such as bronchopulmonary dysplasia, pulmonary hypertension, asphyxia, patent ductus arteriosous, and many congenital heart diseases including those with single ventricle physiology in premature infants (35–37). The RV function may be an important determinant of outcomes for these cardiopulmonary pathologies and the lack of quantitative measures that define normal variance in indices of RV strain in premature infants is a major impediment to early identification of the development of RV dysfunction and its use as a surrogate for these outcomes. Thus, defining the variance and maximizing the reproducibility of RV strain measurements are important steps in using them as echocardiographic end points. To that end, this study fulfills this aim. The main findings of this study are (1) that two-dimensional speckle tracking echocardiography-derived strain imaging of the RV is highly feasible and reproducible in premature infants and (2) the cardiac image acquisition and post-processing data analysis protocol specifically developed for the RV has improved image acquisition reproducibility and reduced variance to make strain parameters reliable measures of RV function in premature infants. To our knowledge, this is the first study to demonstrate that RV strain by 2DSTE offers a reliable tool for the assessment of global RV function in premature infants.
Feasibility Measurements
We developed and followed a protocol to optimize cardiac strain image acquisition that includes specific adjustments to the imaging mode, the acquisition views (RV focused views), the frame rate (90–120 frames/second), and the configuration of the image system, archiving, and storage (appendix). We demonstrated high feasibility (84%) with 2DSTE derived global longitudinal strain measurements (Figure 4b). Sixteen percent of the images were excluded because significant portions of the basal RV free wall either required interpolation from visible but indistinct segments, or the base fell outside the imaging plane. The RV differs significantly from the left ventricle and is difficult to image because of its complex geometry, thin wall with coarse trabeculations, and its anterior position within the chest (6–8). All these factors affected the assessment of RV function in premature infants. In premature hearts as opposed to the adult hearts, there is an enhanced excursion along the base of the RV free wall that prevented optimal tracking by the software analysis. The observation of enhanced excursion along the base of the RV free wall is consistent with RV myoarchitecture that has dominant longitudinal myofibers, and with persistence of the myocardial motion of a RV that is dominant in utero, but which pumps to a postnatal pulmonary circulation with decreasing vascular resistance (37). We corrected for this by modifying from the standard apical 4-chamber view to a “RV–focused view” (24). (Movie 2). These views permitted enhanced visualization of the RV characterized by identifying the septum and RV free wall side of the tricuspid annular plane and the apical point to delineate a “sail sign” that prevented foreshortening of the RV myocardial structure (avoiding the apical 5-chamber view and outflow tracts) (17,37).
Frame rate has traditionally been considered to be the most important aspect of image acquisition (26) and since the resting heart rate in premature infants is high and normally ranges from 120 beats/min to 180 beats/min, it is important to keep the frame rate of acquisition high. Speckle tracking echocardiography is based on the recognition of speckles between frames. The frame rate has to be high enough so that speckles are recognizable between frames (38). Underestimation of strain can result from low–frame rate image acquisition that can also affect high-frequency events such as maximum strain rate and the details of the strain waveform. If the frame rate is too low the speckles might change too much between frames and not be recognized due to movement out of the plane (38). Although the study reported by Risum et al. 2012 suggested that the measurement of peak systolic strain was not compromised by under-sampling of measurements from images acquired at 30 frames/sec, this study was performed in adults who normally have resting heart rates ranging between 60 beats/min and 90 beats/min and may not be applicable in premature infants with heart rates twice that of the normal adult (23). We have demonstrated previously that the reproducibility in children, who normally have resting heart rates ranging between 70 beats/min and 120 beats/min, was the most robust for images obtained with frame rates between 60 and 90 frame/sec (24). Based on our experience, we kept the frame rate of image acquisition between 90 frame/sec and 120 frame/sec to enhance feasibility and reproducibility (24). Considering that premature infants usually have heart rates necessitating the use of higher ranges of frame rates, it is pertinent to appreciate that speckle distribution might be misleading when the frame rates are too high. Specifically, high frame rates can result in smoothing that may register the strain values where no deformation exits. All of these factors may reduce measurement reproducibility.
Reproducibility Measurements
We demonstrated excellent reproducibility (low bias <10%, narrow 95% limits of agreement, CV<10%, and high interclass coefficient >0.90) for both inter- and intra-observer strain measurements with 2DSTE-derived global longitudinal strain measurements (Table 2). We considered high reproducibility to be clinically relevant if CV in strain measurement was <10%. (24). In preliminary unpublished data from the ongoing PROP study, we have demonstrated that cardiac maturational changes induce a change of 10% or more in strain values every month of aging from 28 weeks of gestation onwards to 36 weeks post menstrual age. This was achieved by reducing interobserver, intraobserver, and interacquisition variability bias <10%, and by developing and testing the protocol for image acquisition and postprocessing (Appendix). For 2DSTE measurement of myocardial strain, the acoustic markers (speckles) to be optimum for tracking should have about 50 points distributed at 3-mm intervals within the ROI in myocardium (27) and the full shape of the ventricle is important to realize because data fitting is weighted according to correlations between the original markers and the tracked markers (GE Medical Systems). We attempted to achieve these prerequisites for reproducibility by ensuring visualization of at least two parts of tripartite RV, optimizing speckle brightness, and including endocardium and full width of myocardium (41).
The majority of the studies that use deformation imaging to assess right ventricular function in children and neonates used a GE ultrasound scanner to acquire the images and a version of the GE EchoPAC™ (49–61) software to generate strain values. The protocol in this study was also developed with the use of one commercially available ultrasound scanner (Vivid 9, General Electric Medical Systems, Milwaukee, WI) and one vendor-customized software workstation package (EchoPAC™, version 110.0.x; General Electric Medical Systems, Horten, Norway). We did not assess the consistency of myocardial deformation imaging between vendors or ventricular function by different vendor-customized speckle-tracking software. Recent studies have demonstrated no significant variation between global longitudinal strain measures when different cardiac ultrasound systems were used for image acquisition and analysis (19–23). All of the “comparison” studies assessed the reproducibility of strain imaging between a General Electric (GE) ultrasound scanner and analysis software and one other commercially available ultrasound scanner and software system (20–23). Negishi et al. 2012 also demonstrated that the use of the same vendor customized software to measure strain in images acquired from different vendor ultrasound machines provided minimal bias for global longitudinal strain (20). However, the variability between echocardiographic equipment and proprietary software for image acquisition and analysis needs to be firmly established before routine clinical adoption of 2DSTE myocardial strain measurements can be implemented (16).
Longitudinal Strain Imaging in Neonates
Few deformation studies in term and premature infants report global strain measurements on the right ventricle, and none utilized 2DSTE for the RV. The majority of the previous studies for noninvasive assessment of RV myocardial strain and strain rate in premature infants have utilized tissue Doppler imaging (TDI), and only recently has 2DSTE-derived strain been recognized as an important modality to assess the myocardial function in premature infants (31,43–48). Pena et al. demonstrated that TDI-derived regional strain imaging is a practical and reproducible clinical technique in neonates for end-systolic regional longitudinal strain in RV, but reproducibility was lower for end-diastolic measurements (44,45). Nestas and Stoylen et al. 2009 investigated myocardial deformation in healthy term neonates by measuring global and regional longitudinal systolic strain and strain rate with TDI daily for the first 3 days of life (35,36). The strain variation was high within segments, between segments, and between individuals. Joshi et al. investigated the reproducibility of regional deformation indices in term and premature neonates using TDI and demonstrated adequate intra-observer reproducibility (coefficient of variation 10–20%), but reported poor interobserver reproducibility (coefficient of variation > 30%) (43,46). Furthermore, angle dependency in combination with the relatively low signal-to-noise ratio has limited the feasibility and reproducibility of TDI-derived strain measurements. In contrast to TDI, 2DSTE is a high spatial resolution ultrasound imaging modality that is relatively angle independent and allows accurate quantification of global longitudinal cardiac deformation (15).
Clinical Implications
Two-dimensional speckle tracking echocardiography has been applied to assess systolic RV function in children with pulmonary hypertension, complex congenital heart defects, sickle cell anemia, and cystic fibrosis (49–54). 2DSTE derived RV strain can be obtained noninvasively at the bedside in the intensive care environment enhancing its real time diagnostic capabilities (38). Peak systolic strain has been shown to correlate with changes in hemodynamics in normal neonatal myocardium (62), which may prove clinically applicable across a broad range of neonatal physiologic and pathologic conditions, such as patent ductus arteriosous, single ventricle physiology, bronchopulmonary dysplaisa, pulmonary hypertension, and asphyxiated term and preterm infants (31,35,36,38,62,63). In our own prospective study in extremely low gestational age neonates, we have demonstrated that the RV global longitudinal strain may serve as a marker that can identify and track clinical cardiopulmonary alterations in the setting of bronchopulmonary dysplasia (63). Khuffash et al. utilized 2DSTE derived global strain to demonstrate a significant change in myocardial function in premature infants with a hemodynamically significant PDA requiring ligation, highlighting its value as a method to monitor these types of changes and assess functional cardiac development in premature infants (31).
Limitations
RV global strain values are derived only from a single view, making it not a truly global assessment of RV function. This study assessed global RV strain in the longitudinal (myocardial deformation directed from the base to the apex) direction. However, few strain studies have yet to show significant feasibility or reproducibility with the radial or circumferential strain measurements, and the peak global longitudinal strain remains the most reliable quantitative tool of the three to assess right ventricular function in adults and children in practice (15,24,35,36).
We did not compare the effect of varying frame rates on reproducibility in this study. Further studies are needed to analyze the effect of even higher frame rates and the reliability of the strain rate measurements.
Speckle tracking echocardiography is a semi-automated software analysis program that is computer based, but not user independent: the observer must initially place and then modify tracking region of interests (64). There is a learning curve that is essential before introducing the technique into clinical or research studies.
Conclusion
This study demonstrates high feasibility and reproducibility of RV strain measurements by 2DSTE in premature infants and offers a methodology for image acquisition and data analysis that reduces measurement variability to a clinically insignificant level in neonates. Peak global longitudinal strain measurements by 2DSTE offer a reliable tool for the assessment of global RV function in premature infants and neonates. The future of 2DSTE derived RV strain measurements in premature infants will require further validation and demonstration of clinical utility.
Supplementary Material
The standard apical 4-chamber view used to acquire strain measurements for the left ventricle does not always include the entire RV free wall in its imaging plane and leads to poor speckle tracking capabilities, particularly at the RV free wall basal region.
In RV-focused view, the RV is centered in the imaging plane sector to define the full extent of RV free wall with no visible gaps. This view permits enhanced visualization of the RV free wall, especially at the RV free wall basal region
Table 3.
Reproducibility Analysis for the Study Phase
| Bland Altman | Intraclass Correlation | Coefficient of Variation | Agreement | ||||
|---|---|---|---|---|---|---|---|
| Bias (%) | LOA | Coefficient (95% CI) | P value | (%) | R coefficient | P value | |
| Intra- observer reproduciblity | |||||||
| RV pGLS | 3% | −3.2 | 0.97 (0.935–0.98) | 0.01 | 2.70% | 0.97 | 0.001 |
| RV pGLSr | 5% | −0.6 | 0.90 (0.84–0.94) | 0.04 | 4.40% | 0.92 | 0.04 |
| Inter- observer reproducbility | |||||||
| RV pGLS | 7% | −9.5 | 0.93 (0.89–0.96) | 0.03 | 3.90% | 0.93 | 0.03 |
| RV pGLSr | 7% | −0.8 | 0.90 (0.85–0.94) | 0.04 | 4.50% | 0.9 | 0.04 |
To measure the reproducibility of myocardial strain indices, we selected a random sampling of 60% of the feasible images from the Study Phase cohort (N=48 images).
LOA, limits of agreement; Agreement, Pearson’s correlation
RV pGLS, Right ventricle peak global longitudinal strain (%), RV pGLSr, Right ventricle peak global longitudinal strain rate (1/sec)
Acknowledgments
This study was supported by grants from Premature and Respiratory Outcomes Program (NIH 1U01 HL1014650), NIH R21 HL106417, Pediatric Physician Scientist Training Grant (NIH 5 T32 HD043010-09), and Postdoctoral Mentored Training Program in Clinical Investigation (NIH 1U01 HL1014650).
Abbreviations
- RV
right ventricle
- RVFW
right ventricle free wall
- 2DSTE
two-dimensional speckle tracking echocardiography
- pGLS
peak global longitudinal strain
- pGLSr
peak global longitudinal strain rate
- PMA
postmenstrual age
- ROI
regions of interest
- CV
coefficient of variation
- ICC
Intraclass correlation coefficient
- TDI
tissue Doppler imaging
Appendix: Protocol for Cardiac Strain Imaging and Postprocessing data analysis
Equipment: GE Vivid 7/Vivid 9 with EchoPAC™, software
Probe: GE 12S phased-array probe
Measurements: Two-dimensional speckle tracking echocardiography (2DSTE) derived strain and strain rate of right ventricle
A) Optimize image acquisition
Mode: Fundamental imaging mode. Center frequency of 12 MHz. Two-dimensional greyscale images acquired.
Views: RV-focused images: To optimize imaging of the RV lateral wall in entirety and to avoid underestimating the minor-axis distance and foreshortening of RV length, the apical 4-chamber view is adjusted to place the RV in the center of the scanning sector and the transducer is rotated until the maximal plane is obtained, and the septum and RV free wall side of the tricuspid annular plane and the apical point portrayed a “sail sign” and that the LV outflow tract is not opened up (figure 1).
Frame rate 90–120/sec: Frame rates of 90–120 are adjusted for image acquisition to obtain optimal strain and strain rate measurements.
Configure GE Vivid imaging system: Compression = 24; Reject = 0; Dynamic Range = 2; Data Dependent Processing (DPP) = 0.0. (I.e., readout: <gain setting>/24/0/2/0.0); set the Mechanical Index (MI) = 1.0, and overall gain setting and TGCs to produce images in which the brightness of the mid-myocardial regions of the septum and RVFW represent mid-level gray values to make it appear brighter than that typically used in conventional echocardiography (Figure 8) to have clear endocardial and epicardial borders.
ECG tracing on screen – minimize artifacts.
Store/Record: 3 consecutive cardiac cycles
Image archiving and storage: Store the two-dimensional cineloop images as GE enhanced DICOM digital loops and send the study to EchoPac (EchoPac PC–2D strain, GE Healthcare, Milwaukee, Wis.) to be stored for off-line analysis.
Figure 8.
Configuration of Imaging system: (A) overall gain settings and TGC are set to produce images in which the brightness of the mid-myocardial regions of the septum and RVFW represent mid-level gray values to make it appear brighter than that typically used in (B) conventional echocardiography to have clear endocardial and epicardial borders.
B) RV myocardial strain and strain rate data analysis
Estimates of peak global and segmental myocardial RV longitudinal strains and strain rates are performed using the analysis tools available on the GE EchoPac image analysis.
The most suitable cardiac cycle within the RV focused image is chosen for analysis.
A reference time point is placed at the beginning of the QRS complex and time to pulmonary valve closure was measured by pulsed-wave Doppler in the RV outflow tract.
The speckle tracking technique is semi-automated with the user manually drawing a tracking line with a point and click approach that defines the endocardial surface border of the ventricle (30). The manual tracing of the endocardial border follows a specific pattern: The RV-focused apical four chamber cine-loop is manually adjusted to the end-diastolic or end-systolic frame prior to the complete closure of the tricuspid valve to clearly identify three landmarks in the image: (a) the trigonal crux and (b) lateral hinge points of the tricuspid valve at the base, and (c) the apical point. All together these three points delineate a “sail sign” around the inside of the endocardial boarder (figure 1).
The Echo Pac software program software automatically identifies and tracks the border between the cavity and the endocardium in subsequent frames that helps delineate the region of interest (ROI) around this ‘sail sign’.
The speckle-tracking algorithm divides the RV myocardium into 6 segments (base-septum, mid-septum, apical-septum, base-lateral, mid-lateral, and apical lateral).
The ROI is optimized to cover the endocardium, full width of myocardium up to epicardium and to avoid pericardium. Once accepted by the user, the EchoPac algorithm generates seven curves based on the timing of the opening and closure of the pulmonary valve closure, that represent the measured myocardial deformation (strain) in the longitudinal direction (along the heart wall) for the six specific myocardial segments and one global value representing the combined strain from all segments within the right ventricle echocardiographic view (Figure 2).
The integrity of myocardial speckle tracking is visually confirmed, ascertained from the credibility of the algorithm-generated strain curve, and from the tracking quality score generated by the automated tracking detection algorithm in the vendor customized analysis software.
To enhance the speckle tracking capabilities, the ROI is readjusted repeatedly to avoid free wall base over excursion and tracking of the trabeculations. Cine-loop images with persistently inadequate tracking are excluded from analysis
Once the ROI is accepted, peak global longitudinal strain and systolic strain rate values are automatically calculated from the combined deformation of the myocardial segments in each imaging plane and used as a measure of RV function.
Footnotes
Disclosures: None
Publisher's Disclaimer: This is a PDF file of an unedited manuscript that has been accepted for publication. As a service to our customers we are providing this early version of the manuscript. The manuscript will undergo copyediting, typesetting, and review of the resulting proof before it is published in its final citable form. Please note that during the production process errors may be discovered which could affect the content, and all legal disclaimers that apply to the journal pertain.
References
- 1.Koestenberger M, Nagel B, Ravekes W, Urlesberger B, Raith W, Avian A, et al. Systolic Right Ventricular Function in Preterm and Term Neonates: Reference Values of the Tricuspid Annular Plane Systolic Excursion (TAPSE) in 258 Patients and Calculation of Z-Score Values. Neonatology. 2011;100:85–92. doi: 10.1159/000322006. [DOI] [PubMed] [Google Scholar]
- 2.Clark SJ, Yoxall CW, Subhedar NV. Measurement of right ventricular volume in healthy term and preterm neonates. Archives of disease in childhood. Fetal and neonatal edition. 2002;87:F89–93. doi: 10.1136/fn.87.2.F89. [DOI] [PMC free article] [PubMed] [Google Scholar]
- 3.Czernik C, Rhode S, Metze B, Schmalisch G, Bührer C. Persistently Elevated Right Ventricular Index of Myocardial Performance in Preterm Infants with Incipient Bronchopulmonary Dysplasia. PLoS ONE. 2012;7:e38352. doi: 10.1371/journal.pone.0038352. [DOI] [PMC free article] [PubMed] [Google Scholar]
- 4.Mertens L, Seri I, Marek J, Arlettaz R, Barker P, McNamara P, et al. Targeted Neonatal Echocardiography in the Neonatal Intensive Care Unit: practice guidelines and recommendations for training. Writing Group of the American Society of Echocardiography (ASE) in collaboration with the European Association of Echocardiography (EAE) and the Association for European Pediatric Cardiologists (AEPC) J Am Soc Echocardiogr. 2011;24:1057–1078. doi: 10.1016/j.echo.2011.07.014. [DOI] [PubMed] [Google Scholar]
- 5.Lopez L, Colan SD, Frommelt PC, Ensing GJ, Kendall K, Younoszai AK, et al. Recommendations for quantification methods during the performance of a pediatric echocardiogram: a report from the Pediatric Measurements Writing Group of the American Society of Echocardiography Pediatric and Congenital Heart Disease Council. J Am Soc Echocardiogr. 2010;23:465–95. doi: 10.1016/j.echo.2010.03.019. [DOI] [PubMed] [Google Scholar]
- 6.Ho SY, Nihoyannopoulos P. Anatomy, echocardiography, and normal right ventricular dimensions. Heart. 2006;92:i2–i13. doi: 10.1136/hrt.2005.077875. [DOI] [PMC free article] [PubMed] [Google Scholar]
- 7.Dell’Italia LJ. The right ventricle: anatomy, physiology, and clinical importance. Curr Probl Cardiol. 1991;16:653–720. doi: 10.1016/0146-2806(91)90009-y. [DOI] [PubMed] [Google Scholar]
- 8.Jiang L. Principle and Practice of Echocardiography: Right ventricle. Baltimore: Lippincott Williams & Wilkins; 1994. pp. 901–21. [Google Scholar]
- 9.Petitjean C, Rougon N, Cluzel P. Assessment of myocardial function: a review of quantification methods and results using tagged MRI. J Cardiovasc Magn Reson. 2005;7:501–516. doi: 10.1081/jcmr-200053610. [DOI] [PubMed] [Google Scholar]
- 10.Mirsky I, Parmley WW. Assessment of passive elastic stiffness for isolated heart muscle and the intact heart. Circ Res. 1973;33:233–43. doi: 10.1161/01.res.33.2.233. [DOI] [PubMed] [Google Scholar]
- 11.Jamal F, Bergerot C, Argaud L, Loufouat J, Ovize M. Longitudinal strain quantitates regional right ventricular contractile function. Am J Physiol Heart Circ Physiol. 2003;285:H2842–7. doi: 10.1152/ajpheart.00218.2003. [DOI] [PubMed] [Google Scholar]
- 12.Amundsen BH, Helle-Valle T, Edvardsen T, Torp H, Crosby J, Lyseggen E, et al. Noninvasive myocardial strain measurement by speckle tracking echocardiography: Validation against sonomicrometry and tagged magnetic resonance imaging. J Am Coll Cardiol. 2006;47:789–93. doi: 10.1016/j.jacc.2005.10.040. [DOI] [PubMed] [Google Scholar]
- 13.Korinek J, Wang J, Sengupta PP, Miyazaki C, Kjaergaard J, McMahon E, et al. Two-dimensional strain--a Doppler-independent ultrasound method for quantitation of regional deformation: validation in vitro and in vivo. J Am Soc Echocardiogr. 2005;18:1247–53. doi: 10.1016/j.echo.2005.03.024. [DOI] [PubMed] [Google Scholar]
- 14.Leitman M, Lysyansky P, Sidenko S, Shir V, Peleg E, Binenbaum M, et al. Two-dimensional strain-a novel software for real-time quantitative echocardiographic assessment of myocardial function. J Am Soc Echocardiogr. 2004;17:1021–9. doi: 10.1016/j.echo.2004.06.019. [DOI] [PubMed] [Google Scholar]
- 15.Koopman LP, Slorach C, Hui W, Manlhiot C, McCrindle BW, Friedberg MK, et al. Comparison between different speckle tracking and color tissue Doppler techniques to measure global and regional myocardial deformation in children. J Am Soc Echocardiogr. 2010;23:919–28. doi: 10.1016/j.echo.2010.06.014. [DOI] [PubMed] [Google Scholar]
- 16.Kaul S, Miller JG, Grayburn PA, Hashimoto S, Hibberd M, Holland MR, et al. A suggested roadmap for cardiovascular ultrasound research for the future. J Am Soc Echocardiogr. 2011;24:455–464. doi: 10.1016/j.echo.2011.02.017. [DOI] [PubMed] [Google Scholar]
- 17.Marwick TH. Will Standardization Make Strain a Standard Measurement? J Am Soc Echocardiogr. 2012;25:1204–06. doi: 10.1016/j.echo.2012.09.017. [DOI] [PubMed] [Google Scholar]
- 18.Colan SD, Shirali G, Margossian R, Gallagher D, Altmann, Canter C, et al. The Ventricular Volume Variability Study of the Pediatric Heart Network: Study Design and Impact of Beat Averaging and Variable Type on the Reproducibility of Echocardiographic Measurements in Children with Chronic Dilated Cardiomyopathy. J Am Soc Echocardiogr. 2012;25:842–54. doi: 10.1016/j.echo.2012.05.004. [DOI] [PMC free article] [PubMed] [Google Scholar]
- 19.Koopman LP, Slorach C, Manlhiot C, McCrindle BW, Jaeggi ET, Mertens L, et al. Assessment of Myocardial Deformation in Children Using Digital Imaging and Communications in Medicine (DICOM) Data and Vendor Independent Speckle Tracking Software. J Am Soc Echocardiogr. 2011;24:37–44. doi: 10.1016/j.echo.2010.09.018. [DOI] [PubMed] [Google Scholar]
- 20.Negishi K, Lucas S, Negishi T, Hamilton J, Marwick TH. What is the Primary Source of Discordance in Strain Measurement Between Vendors: Imaging or Analysis? Ultrasound in Medicine & Biology. 2013;39:714–720. doi: 10.1016/j.ultrasmedbio.2012.11.021. [DOI] [PubMed] [Google Scholar]
- 21.Marwick TH. Consistency of myocardial deformation imaging between vendors. European journal of echocardiography: the journal of the Working Group on Echocardiography of the European Society of Cardiology. 2010l;11:414–416. doi: 10.1093/ejechocard/jeq006. [DOI] [PubMed] [Google Scholar]
- 22.Manovel A, Dawson D, Smith B, Nihoyannopoulos P. Assessment of left ventricular function by different speckle-tracking software. European journal of echocardiography. 2010;11:417–421. doi: 10.1093/ejechocard/jep226. [DOI] [PubMed] [Google Scholar]
- 23.Risum N, Ali S, Olsen NT, Jons C, Khouri MG, Lauridsen TK, et al. Variability of Global Left Ventricular Deformation Analysis Using Vendor Dependent and Independent: Two-Dimensional Speckle-Tracking Software in Adults. J Am Soc Echocardiogr. 2012;25:1195–203. doi: 10.1016/j.echo.2012.08.007. [DOI] [PubMed] [Google Scholar]
- 24.Singh GK, Cupps B, Pasque M, Woodard PK, Holland MR, Ludomirsky A. Accuracy and reproducibility of strain by speckle tracking in pediatric subjects with normal heart and single ventricular physiology: a two-dimensional speckle-tracking echocardiography and magnetic resonance imaging correlative study. J Am Soc Echocardiogr. 2010;23:1143–52. doi: 10.1016/j.echo.2010.08.010. [DOI] [PMC free article] [PubMed] [Google Scholar]
- 25.Rudski LG, Lai WW, Afilalo J, Hua L, Handschumacher MD, Chandrasekaran K, et al. Guidelines for the Echocardiographic Assessment of the Right Heart in Adults: A Report from the American Society of Echocardiography Endorsed by the European Association of Echocardiography, a registered branch of the European Society of Cardiology, and the Canadian Society of Echocardiography. J Am Soc Echocardiogr. 2010;23:685–713. doi: 10.1016/j.echo.2010.05.010. [DOI] [PubMed] [Google Scholar]
- 26.Negishi K, Negishi T, Agler DA, Plana JC, Marwick TH. Role of temporal resolution in selection of the appropriate strain technique for evaluation of subclinical myocardial dysfunction. Echocardiography. 2012;29:334–9. doi: 10.1111/j.1540-8175.2011.01586.x. [DOI] [PubMed] [Google Scholar]
- 27.Bansal M, Cho GY, Chan J, Leano R, Haluska BA, Marwick TH. Feasibility and accuracy of different techniques of two-dimensional speckle based strain and validation with harmonic phase magnetic resonance imaging. J Am Soc Echocardiogr. 2008;21:1318–25. doi: 10.1016/j.echo.2008.09.021. [DOI] [PubMed] [Google Scholar]
- 28.Bland JM, Altman DG. Statistical methods for assessing agreement between two methods of clinical measurement. Lancet. 1986;1:307–10. [PubMed] [Google Scholar]
- 29.Koopmans LH, Owen DB, Rosenblatt JI. Confidence intervals for the coefficient of variation for the normal and log normal distributions. Biometrika. 1964;51:25–29. [Google Scholar]
- 30.Shrout PE, Fleiss JL. Intraclass Correlations: Uses in Assessing Rater Reliability. Psychological Bulletin. 1979;86:420–428. doi: 10.1037//0033-2909.86.2.420. [DOI] [PubMed] [Google Scholar]
- 31.El-Khuffash AF, Jain A, Dragulescu A, McNamara PJ, Mertens L. Acute changes in myocardial systolic function in preterm infants undergoing patent ductus arteriosus ligation: a tissue Doppler and myocardial deformation study. J Am Soc Echocardiogr. 2012;10:1058–67. doi: 10.1016/j.echo.2012.07.016. [DOI] [PubMed] [Google Scholar]
- 32.Crispi F, Sepulveda-Swatson E, Cruz-Lemini M, Rojas-Benavente J, Garcia-Posada R, Dominguez JM, et al. Feasibility and reproducibility of a standard protocol for 2D speckle tracking and tissue Doppler-based strain and strain rate analysis of the fetal heart. Fetal Diagn Ther. 2012;32:96–108. doi: 10.1159/000337329. [DOI] [PubMed] [Google Scholar]
- 33.Sjøli B, Grenne B, Smiseth OA, Edvardsen T, Brunvand H. The advantage of global strain compared to left ventricular ejection fraction to predict outcome after acute myocardial infarction. Echocardiography. 2011;5:556–63. doi: 10.1111/j.1540-8175.2011.01384.x. [DOI] [PubMed] [Google Scholar]
- 34.Sachdev A, Villarraga HR, Frantz RP, McGoon MD, Hsiao JF, Maalouf JF, et al. Right ventricular strain for prediction of survival in patients with pulmonary arterial hypertension. Chest. 2011;139:1299–309. doi: 10.1378/chest.10-2015. [DOI] [PubMed] [Google Scholar]
- 35.Nestaas E, Stoylen A, Brunvand L, Fugelseth D. Tissue Doppler derived longitudinal strain and strain rate during the first 3 days of life in healthy term neonates. Pediatr Res. 2009;65:357–60. doi: 10.1203/PDR.0b013e318193f149. [DOI] [PubMed] [Google Scholar]
- 36.Nestaas E, Stoylen A, Brunvand L, Fugelseth D. Longitudinal strain and strain rate by tissue Doppler are more sensitive indices than fractional shortening for assessing the reduced myocardial function in asphyxiated neonates. Cardiol Young. 2011;21:1–7. doi: 10.1017/S1047951109991314. [DOI] [PubMed] [Google Scholar]
- 37.Patel N, Mills JF, Cheung MM. Assessment of right ventricular function using tissue Doppler imaging in infants with pulmonary hypertension. Neonatology. 2009;96:193–9. doi: 10.1159/000215585. [DOI] [PubMed] [Google Scholar]
- 38.Koestenberger M. Transthoracic echocardiography in children and young adults with congenital heart disease. ISRN pediatrics. 2012:753481. doi: 10.5402/2012/753481. [DOI] [PMC free article] [PubMed] [Google Scholar]
- 39.Apostolakis S, Konstantinides S. Right Ventricle in Health and Disease: Insights into Physiology, Pathophysiology and Diagnostic Management. Cardiology. 2012;121:263–273. doi: 10.1159/000338705. [DOI] [PubMed] [Google Scholar]
- 40.Mondillo S, Galderisi M, Mele D, Cameli M, Lomoriello VS, Zacà V, et al. Speckle-tracking echocardiography: a new technique for assessing myocardial function. J Ultrasound Med. 2011;30:71–83. doi: 10.7863/jum.2011.30.1.71. [DOI] [PubMed] [Google Scholar]
- 41.Nelson MR, Hurst RT, Raslan SF, Cha S, Wilansky S, Lester SJ. Echocardiographic measures of myocardial deformation by speckle-tracking technologies: The need for standardization? J Am Soc Echocardiogr. 2012;25:1189–94. doi: 10.1016/j.echo.2012.08.006. [DOI] [PubMed] [Google Scholar]
- 42.Risum N, Ali S, Olsen NT, Jons C, Khouri MG, Lauridsen TK, et al. Variability of Global Left Ventricular Deformation Analysis Using Vendor Dependent and Independent: Two-Dimensional Speckle-Tracking Software in Adults. J Am Soc Echocardiogr. 2012;25:1195–203. doi: 10.1016/j.echo.2012.08.007. [DOI] [PubMed] [Google Scholar]
- 43.Joshi S, Edwards JM, Wilson DG, Wong JK, Kotecha S, Fraser AG. Reproducibility of myocardial velocity and deformation imaging in term and preterm infants. Eur J Echocardiogr. 2010;11:44–50. doi: 10.1093/ejechocard/jep161. [DOI] [PubMed] [Google Scholar]
- 44.Pena JL, da Silva MG, Faria SC, Salemi VM, Mady C, Baltabaeva A, et al. Quantification of regional left and right ventricular deformation indices in healthy neonates by using strain rate and strain imaging. J Am Soc Echocardiogr. 2009;22:369–75. doi: 10.1016/j.echo.2008.12.007. [DOI] [PubMed] [Google Scholar]
- 45.Pena JL, da Silva MG, Alves JM, Salemi VM, Mady C, Baltabaeva A, et al. Sequential changes of longitudinal and radial myocardial deformation indices in the healthy neonate heart. J Am Soc Echocardiogr. 2010;23:294–300. doi: 10.1016/j.echo.2009.12.026. [DOI] [PubMed] [Google Scholar]
- 46.Poon CY, Edwards JM, Joshi S, Kotecha S, Fraser AG. Optimization of myocardial deformation imaging in term and preterm infants. Eur J Echocardiogr. 2011;12:247–54. doi: 10.1093/ejechocard/jeq192. [DOI] [PubMed] [Google Scholar]
- 47.Mori K, Nakagawa R, Nii M, Edagawa T, Takehara Y, Inoue M, et al. Pulsed wave Doppler tissue echocardiography assessment of the long axis function of the right and left ventricles during the early neonatal period. Heart. 2004;90:175–80. doi: 10.1136/hrt.2002.008110. [DOI] [PMC free article] [PubMed] [Google Scholar]
- 48.Negrine RJ, Chikermane A, Wright JG, Ewer AK. Assessment of myocardial function in neonates using tissue Doppler imaging. Arch Dis Child Fetal Neonatal Ed. 2012;97:F304–F306. doi: 10.1136/adc.2009.175109. [DOI] [PubMed] [Google Scholar]
- 49.Pettersen E, Fredriksen PM, Urheim S, Thaulow E, Smith HJ, Smevik B, et al. Ventricular Function in Patients With Transposition of the Great Arteries Operated With Arterial Switch. American Journal of Cardiology. 2009;104:583–589. doi: 10.1016/j.amjcard.2009.04.029. [DOI] [PubMed] [Google Scholar]
- 50.Ozcelik N, Shell R, Holtzlander M, Cu C. Decreased right ventricular function in healthy pediatric cystic fibrosis patients versus non-cystic fibrosis patients. Pediatric Cardiology. 2013;34:159–164. doi: 10.1007/s00246-012-0407-4. [DOI] [PubMed] [Google Scholar]
- 51.Moiduddin N, Texter KM, Zaidi AN, Herskenson JA, Stefaniak CA, Hayes J, Cua CL. Two-dimensional speckle strain and dyssynchrony in single right ventricles versus normal right ventricles. Journal of the American Society of Echocardiography. 2010;23:673–679. doi: 10.1016/j.echo.2010.03.028. [DOI] [PubMed] [Google Scholar]
- 52.Friedberg MK, Fernandes FP, Roche SL, Slorach C, Grosse-Wortmann L, Manlhiot C, et al. Relation of right ventricular mechanics to exercise tolerance in children after tetralogy of Fallot repair. American Heart Journal. 2013;165:551–557. doi: 10.1016/j.ahj.2012.06.029. [DOI] [PubMed] [Google Scholar]
- 53.Dragulescu A, Grosse-Wortmann L, Redington A, Friedberg MK, Mertens L. Differential effect of right ventricular dilatation on myocardial deformation in patients with atrial septal defects and patients after tetralogy of Fallot repair. International Journal of Cardiology. 2012;12:1383–1386. doi: 10.1016/j.ijcard.2012.10.009. [DOI] [PubMed] [Google Scholar]
- 54.Blanc J, Stos B, De Montalembert M, Bonnet D, Boudjemline Y. Right ventricular systolic strain is altered in children with sickle cell disease. Journal of the American Society of Echocardiography. 2012;25:511–517. doi: 10.1016/j.echo.2012.01.011. [DOI] [PubMed] [Google Scholar]
- 55.Friedberg MK, Fernandes FP, Roche SL, Grosse-Wortmann L, Manlhiot C, Fackoury C, et al. Impaired right and left ventricular diastolic myocardial mechanics and filling in asymptomatic children and adolescents after repair of tetralogy of Fallot. European heart journal cardiovascular Imaging. 2012;13:905–913. doi: 10.1093/ehjci/jes067. [DOI] [PubMed] [Google Scholar]
- 56.Hauser M, Kuehn A, Petzuch C, Schoen P, Elmenhorst J, Schoenfelder M, et al. The munich triathlon heart study: Ventricular function, myocardial velocities and 2-d strain in healthy children before and after endurance stress. Pediatr Cardiol. 2013;34:576–582. doi: 10.1007/s00246-012-0500-8. [DOI] [PubMed] [Google Scholar]
- 57.Koh C, Hong WJ, Wong SJ, Cheung YF. Systolic-diastolic coupling of myocardial deformation of the left ventricle in children with left ventricular noncompaction. Heart Vessels. 2010;25:493–499. doi: 10.1007/s00380-010-0001-8. [DOI] [PubMed] [Google Scholar]
- 58.Li Y, Xie M, Wang X, Lv Q, Lu X, Yang Y, et al. Evaluation of right ventricular global longitudinal function in patients with tetralogy of fallot by two-dimensional ultrasound speckle tracking imaging. J Huazhong Univ Sci Technolog Med Sci. 2010;30:126–131. doi: 10.1007/s11596-010-0123-3. [DOI] [PubMed] [Google Scholar]
- 59.Sileikiene R, Vaskelyte J, Baksiene D, Mizariene V, Ziuteliene A, Jurkevicius R. Quantification of Regional Left and Right Ventricular Longitudinal Function by 2D Speckle Tracking Imaging in Children After Atrioventricular Node Slow Pathway Ablation. Cardiology in the Young. 201(3):57–62. [Google Scholar]
- 60.Van der Hulst AE, Delgado V, Holman ER, Kroft LJM, Roos A, de Hazekamp MG, et al. Relation of Left Ventricular Twist and Global Strain with Right Ventricular Dysfunction in Patients After Operative ‘Correction’ of Tetralogy of Fallot. Am J Cardiol. 2010;106:723–729. doi: 10.1016/j.amjcard.2010.04.032. [DOI] [PubMed] [Google Scholar]
- 61.Van der Hulst AE, Roest AAW, Delgado V, Holman ER, Roos A, de Blom NA, et al. Relationship Between Temporal Sequence of Right Ventricular Deformation and Right Ventricular Performance in Patients with Corrected Tetralogy of Fallot Heart. 2011;97:231–236. doi: 10.1136/hrt.2010.199919. [DOI] [PubMed] [Google Scholar]
- 62.Weidemann F, Eyskens B, Jamal F, Mertens L, Kowalski M, D’hooge J, et al. Quantification of regional left and right ventricular radial and longitudinal function in healthy children using ultrasound-based strain rate and strain imaging. J Am Soc Echocardiogr. 2002;15:20–28. doi: 10.1067/mje.2002.116532. [DOI] [PubMed] [Google Scholar]
- 63.Singh GK, Levy PT, Holland MR, Hamvas A. Novel methods for assessment of right heart structure and function in pulmonary hypertension. Clinics in Perinatology. 2012;39:685–701. doi: 10.1016/j.clp.2012.06.002. [DOI] [PubMed] [Google Scholar]
- 64.Di Salvo G, Russo MG, Paladini D, Pacileo G, Felicetti M, Ricci C, et al. Quantification of regional left and right ventricular longitudinal function in 75 normal fetuses using ultrasound-based strain rate and strain imaging. Ultrasound Med Biol. 2005;31:1159–62. doi: 10.1016/j.ultrasmedbio.2005.05.011. [DOI] [PubMed] [Google Scholar]
Associated Data
This section collects any data citations, data availability statements, or supplementary materials included in this article.
Supplementary Materials
The standard apical 4-chamber view used to acquire strain measurements for the left ventricle does not always include the entire RV free wall in its imaging plane and leads to poor speckle tracking capabilities, particularly at the RV free wall basal region.
In RV-focused view, the RV is centered in the imaging plane sector to define the full extent of RV free wall with no visible gaps. This view permits enhanced visualization of the RV free wall, especially at the RV free wall basal region