

Abstract
The risk of obesity (OB) in adulthood is strongly influenced by maternal body composition. Here we examined the hypothesis that maternal OB influences white adipose tissue (WAT) transcriptome and increases propensity for adipogenesis in the offspring, prior to the development of OB, using an established model of long-term metabolic programming. Employing an overfeeding-based rat model, in which exposure to OB is limited to preconception and gestation alone, we conducted global transcriptomic profiling in WAT, and gene/protein expression analysis of lipogenic and adipogenic pathways and examined adipogenic differentiation of WAT stromal-vascular cells ex vivo. Using reduced representation bisulfite sequencing we also evaluated genome-scale changes in DNA methylation in offspring WAT. Maternal OB led to extensive changes in expression of genes (±1.8-fold, P ≤ .05), revealing a distinct up-regulation of lipogenic pathways in WAT. mRNA expression of a battery of sterol regulatory element-binding protein-1-regulated genes was increased in OB-dam offspring, which were confirmed by immunoblotting. In conjunction with lipogenic gene expression, OB-dam offspring showed increased glucose transporter-4 mRNA/protein expression and greater AKT phosphorylation following acute insulin challenge, suggesting sensitization of insulin signaling in WAT. Offspring of OB dams also exhibited increased in vivo expression of adipogenic regulators (peroxisome proliferator-activated receptor-γ, CCAAT enhancer binding protein α [C/EBP-α] and C/EBP-β), associated with greater ex vivo differentiation of WAT stromal-vascular cells. These transcriptomic changes were associated with alterations in DNA methylation of CpG sites and CGI shores, proximal to developmentally important genes, including key pro-adipogenic factors (Zfp423 and C/EBP-β). Our findings strongly suggest that the maternal OB in utero alters adipocyte commitment and differentiation via epigenetic mechanisms.
At present, more than 60% of all pregnancies in the United States are in women who are either overweight or obese at conception (1). This is significant as gestational obesity (OB) has been hypothesized to augment the risk of OB and metabolic disease in offspring. Findings from animal models (2–7) and from clinical studies (8–10) support this hypothesis. Based on the multiplicity of tissues and organ systems shown to be affected by maternal OB, the underlying mechanisms of such programming are likely to be multifactorial. Furthermore, alterations in DNA methylation and histone modifications are suspected to play a role in fetal programming (11–15). However, the effects of maternal OB on white adipose tissue (WAT), a likely target of fetal programming, remain relatively understudied.
To address the in utero effects of maternal OB per se, we developed a model of prepregnancy OB in rats that allows overfeeding, while controlling both caloric intake and diet composition (3, 4, 16). OB dams develop hyperinsulinemia, hyperleptinemia, insulin resistance, and high circulating triglyceride and nonesterfied fatty acid levels (3, 16). Using this model, we demonstrated that gestational exposure to maternal OB is sufficient to program increased OB risk in the offspring (3). OB-dam offspring are “hyper-responsive” to high fat diets (HFDs), gaining greater body weight, fat mass, and additional metabolic impairments at postnatal day (PND)130 (3, 4, 16, 17). Offspring of OB dams at PND21 also develop hepatic steatosis, associated with an increased lipogenic transcriptome (4) and impaired fatty acid oxidation and metabolic flexibility (17). Recent studies have shown that maternal HF consumption alters mRNA expression of adipogenic genes in the WAT (7). Similar findings have also been reported in adipose tissues from offspring of overnourished sheep (18, 19). Nevertheless, whether adipogenic potential of stromal-vascular (SV) cells within WAT is affected by maternal OB remains unknown. Moreover the underlying mechanisms contributing to increased adipogenic gene expression also remain to be elucidated.
In the present study, we examined whether exposure to maternal OB altered global transcriptomic profiles in WAT of offspring at weaning, prior to development of OB. Specifically, we examined expression of genes regulating lipogenesis, insulin signaling, and glucose transport at both mRNA and protein levels. Second, we investigated whether regulation of adipogenesis is influenced by exposure to maternal OB. Using a combination of in vivo and ex vivo approaches; we studied adipogenic potential of WAT SV cells from offspring of lean and OB dams at PND21 and PND100. Last, using reduced representation bisulfite sequencing (RRBS), we assessed the effect of maternal OB on DNA methylation of WAT in the offspring at PND21. Our results demonstrate that maternal OB not only leads to increased expression of key adipogenic and lipogenic transcription factors (peroxisome proliferator-activated receptor-γ [PPAR-γ], and CCAAT enhancer binding proteins [C/EBPs]) but is also associated with specific alterations in DNA methylation of development-related genes.
Materials and Methods
Animals
All experimental protocols were approved by the Institutional Animal Care and Use Committee at the University of Arkansas for Medical Sciences. Virgin female Sprague Dawley rats (8 weeks of age) were intragastrically cannulated for total enteral nutrition (TEN) and allowed to recover for 10 days before starting diets as previously described in detail (3, 4, 16, 17). Briefly, rats (n = 18/group) were fed liquid diets at either 155 kcal/kg3/4·day (lean dams) or 220 kcal/kg3/4)B·d (40% excess calories, OB dams) via computer-controlled pumps for 3 weeks allowing for precise control of both diet composition and caloric intake in a low-stress manner. The diets met NRC recommendations for macro- and micronutrients and consisted of 20% protein (casein), 75% carbohydrate (dextrose and maltodextrin), and 5% fat (corn oil). This caloric intake in the lean group was designed to mimic growth and body composition gains akin to ad libitum fed rats. Body weights were monitored thrice/week, and body composition was assessed by quantitative nuclear magnet resonance (3). Following 3 weeks of diets, lean and OB rats were bred with lean control males. All pregnant rats were provided 220 kcal/kg3/4·d (NRC requirements during pregnancy), which produced the same gestational weight gains for both groups. On PND1, pups were cross-fostered to lean surrogate dams (8 pups per litter) that were not cannulated and had ad libitum access to AIN-93G pelleted diets throughout lactation. Using this paradigm, we ensured that offspring's exposure to maternal OB was limited only to intrauterine development (3). Only data from male offspring are reported here because female offspring from both groups were used for separate experiments. On PND21 male offspring (n = 8 pups per group, from 7 litters for lean and 5 litters for OB) and were euthanized with carbon dioxide followed by exsanguination in the nonfasted state. Distribution of pups per litter for respective analysis can be found in Supplemental Table 1 published on The Endocrine Society's Journals Online web site at http://endo.endojournals.org. Blood (for serum), liver, and WAT (retroperitoneal and gonadal fat pads) were collected and stored at −70°C. Retroperitoneal fat pads were used for SV cell isolations and were collected from a separate group of male offspring at PND21 (n = 15 pups per group; n = 8 litters for lean; n = 6 litters for OB). A separate set of offspring at PND21 (n = 4–10 pups per group from 4–9 litters (Supplemental Table 1) were utilized for acute insulin challenge studies. Briefly, following an overnight fast, animals were anesthetized using sodium pentobarbital, and insulin (10 U/kg) was administered into the hepatic portal vein, followed by collection of retroperitoneal fat pads within 5 minutes of insulin administration (20, 21). For studies at PND100, offspring from each maternal group (n = 7 pups per group from 6 litters for lean and 6 litters for OB) were weaned on to AIN-93G-based pelleted diets provided ad libitum (3). Retroperitoneal fat pads collected at PND21 were used for all subsequent analyses.
Adipose tissue gene expression analyses
Total RNA from WAT at PND21 was isolated using TRI Reagent and purified using RNeasy columns (Qiagen). Three microarrays (GeneChip Rat Genome 230 2.0; Affymetrix) were used for each group. Pools of equal amounts of RNA from 2–3 rats were used per microarray, representing 8 offspring per group (n = 7 litters for lean; n = 5 litters for OB). Briefly, 5 μg of purified RNA was used to synthesize first- and second-strand cDNA. Labeled amplified RNA was synthesized from double-stranded cDNA using the GeneChip IVT labeling kit (Affymetrix) according to the manufacturer's protocol. The probe array was scanned with GeneChip Scanner 3000 (Affymetrix), and CEL files were generated using GeneChip Command Console (Affymetrix). Data analysis was performed using GeneSpring v11 (Agilent) (4, 16). CEL files were processed using RMA algorithm for background adjustment, normalization, and log2 transformation of perfect-match values (4, 16). Genes were filtered based on ± 1.8-fold change and P value ≤ .05 (Student's t test) between OB and lean dam offspring. Enrichment of gene ontology (GO) terms for differentially regulated genes was performed using GeneSpring, GoRilla, and Conceptgen (MeSH terms). The list of affected genes was also analyzed using Ingenuity Pathway Analysis (IPA). Finally, Gene Set Enrichment Analysis (GSEA) was utilized to independently identify biological processes enriched by maternal OB. GSEA does not rely on an arbitrary cutoff (such as fold change between groups) and is a computational method that determines whether an a priori defined set of genes shows statistically significant, concordant differences between 2 biological states.
Isolation of SV cells and ex vivo differentiation
The SV fraction of adipose tissue is enriched with preadipocytes that morphologically are fibroblastic and are considered adipose progenitor cells (22). Following the methodology described by Wagoner et al. (24) and recently adapted by our group (23), SV cells were isolated from adipose tissues of offspring (n = 15/group) and pooled into 3 distinct biological pools at PND21 (n = 8 litters for lean; n = 6 litters for OB) and PND100 (n = 7/group; n = 6 litters per group) using collagenase digestion (24). SV cells were plated in 6-well plates (2 × 10⁵ cells/cm2) and cultured for 4 days. Adipogenic differentiation was induced in 2-day postconfluent cells by supplementation of MDI (0.5 mM methyl-isobutyl-xanthine, 0.5 μM dexamethasone, and 10 μg/mL insulin) in differentiation media (DM, DMEM + 10% fetal bovine serum). The MDI-supplemented DM was replaced with DM containing insulin (10 μg/mL) alone on day 2, followed by DM alone from day 4 to day 7. On day 7, cells were harvested for total RNA isolation and Oil Red O staining.
Real-time RT-PCR
Total RNA (1 μg) was reverse transcribed and real-time PCRs were performed using an ABI Prism 7500 Fast instrument (3, 4, 16, 17). Primers were designed using Primer Express (Supplemental Table 2). Relative amounts of mRNA were quantified using a standard curve and normalized to the expression of SRP14 or cyclophilin A (4, 17).
Immunoblotting
Total lysates from WAT of offspring were prepared in RIPA buffer containing protease and phosphatase inhibitors (n = 4 biologically distinct pools per group representing 8 pups per group from 7 litters for lean and 5 litters for OB). Quantification of proteins was performed using BCA assay (Pierce Chemical Co). Immunoblotting was performed for acetyl-CoA carboxylase, AKT, pAKTthr308, pAKTser473, AMP-activated protein kinase (AMPK), pAMPK, pAS160, C/EBP-α p30, C/EBP-α p42, C/EBP-β, ERK, pERK-42, pERK-44, EZH2, fatty acid synthase (FASN), glyceraldehyde 3-phosphate dehydrogenase, glucose transporter (GLUT)4, glycogen synthase kinase (GSK) α/β, insulin receptor-β, PPARγ, sterol regulatory element-binding protein (SREBP)-1c, and WNT1-inducible signaling protein 2 (WISP2) as previously described (antibody information in Supplemental Table 3) (3, 4, 16, 17). Immunoblots were quantified using Quantity-One (Bio-Rad Laboratories).
RRBS
RRBS involves sequencing of bisulfite-converted MspI fragment libraries, following digestion of genomic DNA, to digitally quantify methylation levels of CpGs on a genome-scale. RRBS libraries were prepared as described by Gu et al. (25) and described in detail in Supplemental Methods. Libraries were quantified using Qubit dsDNA HS Assay kit and sequenced using a GAIIX (36-bp, single end). Reads were trimmed for adapter sequences using Trim Galore. Alignment and methylation calling were performed using Bismark (26). Data analysis and summarization were done using SeqMonk and MethylKit (26, 27). For CpG level comparison, percent methylation of individual CpGs with minimum 10× coverage was calculated. Comparisons between lean and OB dam offspring were performed using Fisher Exact test, and P values were adjusted for multiple testing using the SLIM method (27). CpGs with P < .0005 (approximately corresponding to q value of 0.1) and a minimum difference in methylation (Δme) of 10% were retained. These differentially methylated CpG sites (DMS) were annotated with the closest/overlapping transcription start sites (TSSs) (±100 kb) using Seqmonk, and genomic location analysis was performed using CisGenome. Second, we examined whether maternal OB affected methylation of promoters (−4/+1 kb of TSS), CpG islands (CGI), and CGI shores (2-kb flanking regions of CGI). Promoters were subclassified into those overlapping or devoid of CGIs. The model-based CGI map described by Wu et al (28) was utilized and shores were identified as 2-kb flanking regions (27, 29). Frequency distribution of methylation status of features was computed. Statistical differences between groups were analyzed using χ2 test (26). Empirical distribution of Δme in CGI shores and promoter CGIs was computed using a complete combinatorial approach, and the probability to find a minimum difference of 15% between groups was calculated (using Mathematica v8.0). Finally, CGI shores with Δme of 15% between lean and OB dam offspring were utilized for GO enrichment (30).
Statistical analysis
Data are expressed as means ± SEM (using litter averages). Significance was set at P ≤ .05. Differences between offspring of lean and OB dams were determined using 2-tailed Student's t test. A 2-way ANOVA followed by all-pair-wise comparison by the Student-Neuman-Keuls method was used to compare the effects of maternal OB and hormonal differentiation in SV cells. Statistical analyses were performed using SigmaPlot 11.0 software (Systat Software, Inc).
Results
Overfeeding-induced maternal OB alters offspring metabolism
Body weights were measured in dams prior to the beginning of infusion of TEN diets (∼8 weeks of age), at conception (∼11 weeks of age), and when dams gave birth (∼14 weeks of age). OB female rats were approximately 120% heavier (with 150% greater total body fat, P < .001; Supplemental Table 4), relative to lean rats at the time of conception. Analyses of offspring metabolic and endocrine parameters at weaning were recently reported (4). Briefly, birth weights, number of pups, male-to-female ratio, and crown-to-rump distance did not differ significantly between offspring of lean and OB dams. At weaning (PND21), body weights or weights of visceral WAT did not differ between groups, nor did whole-body adiposity (quantitative nuclear magnetic resonance and x-ray computed tomography). However, percent liver weight (liver weight relative to body weight) in the offspring of OB dams was about 125% greater (P < .001). Nevertheless, serum insulin, leptin, and resistin concentrations were elevated (140%, 200%, and 180%, respectively, P < .05) in the offspring of OB dams at PND21 (4). Most importantly, on weaning to HFD, offspring of OB dams gained greater body weight and fat mass, which was accompanied by metabolic dysfunction at PND130 (3).
Increased expression of WAT lipogenic genes in offspring of OB dams
Unsupervised clustering revealed grouping of expression profiles based on maternal phenotype, suggesting a significant effect on global gene expression (Supplemental Figure 1). We identified 258 transcripts that were differentially expressed between OB dam offspring compared with lean counterparts (±1.8-fold; P ≤ .05) (Supplemental Table 5). Hierarchical clustering of the differentially expressed genes is shown in Figure 1A. Suites of genes with roles in lipid and carbohydrate metabolism, metabolic process, transport, and cytoskeleton were altered by maternal OB. Specifically, 18 genes associated with lipid biosynthesis increased due to maternal OB are shown in Figure 1B. These included key genes such as SREBP-1, FASN, SCD-2, and ELOVL-6. Enrichment of GO biological processes revealed lipid and fatty acid biosynthesis, metabolism, and response to hormone stimulus processes among genes up-regulated in OB-dam offspring (Figure 1D). In contrast, transcripts relating to mitochondria and muscle structure such as sarcoplasmic reticulum, mitochondrial membrane, and z-disc were decreased by maternal OB (Figure 1E). GSEA confirmed that lipid, phospholipid, and steroid biosynthetic processes were significantly affected (Figure 1C). Additionally, enrichment of MeSH terms also showed lipid metabolism and biosynthesis significantly were affected by maternal OB (Figure 1G). We further employed IPA software to identify common regulators of altered genes. Again, key transcription factors controlling lipid synthesis and degradation (SREBP-1, carbohydrate-responsive element binding protein (ChREBP), PPAR-α, and PPAR-γ coactivator-1β) were identified as critical nodes of regulation (Figure 1F). Overall, exposure to maternal OB clearly alters adipose tissue lipid metabolism favoring biosynthesis.
Figure 1.

A, Hierarchical clustering of 258 transcripts altered by maternal OB in offspring adipose tissue. Gene expression was assessed in WAT at PND21 using Rat Genome 230 2.0 microarrays (n = 3 microarrays per group). Genes were filtered based on a minimum ± 1.8-fold change (OB vs lean) and P ≤ .05 using Student's t test. B, Correlation-based clustering of genes with functions in lipogenesis derived from a list of genes altered by maternal OB. Heat maps were generated using GeneSpring. Orange, yellow, and blue represent up-regulation, no relative effect, and down-regulation of transcripts, respectively. C, GSEA analysis of transcripts related to lipid biosynthesis enriched in WAT of OB-dam offspring. Red, white, and blue represent up-regulation, no relative effect, and down-regulation of transcripts, respectively. Enrichment of GO biological process terms for up-regulated (panel D) and down-regulated (panel E) genes due to maternal OB using GoRilla. GO terms are plotted against negative log of corrected P values. F, IPA gene network of highest significance form the list of altered genes. Red and green represent genes that are up- and down-regulated by maternal OB, respectively. G, Conceptgen analysis of differentially regulated genes by maternal OB reveals enrichment of lipid metabolism-related MeSH terms. *, P < 0.05.
We independently confirmed mRNA expression of 9 genes using RT-PCR (Figure 2). Offspring of OB dams showed increased mRNA expression of key lipogenic genes: ATP-citrate lyase (Acly, 4.5-fold), adiponutrin (∼5-fold), ChREBP (2.5-fold), ELOVL-6 (3.7-fold), FASN (3-fold), and Insig-1 (2-fold). In addition, we identified increased mRNA expression of PPAR-γ2 (1.6-fold), GLUT-4 (2.8-fold), leptin (∼2-fold), and acetyl-CoA carboxylase approached significance (P = .068) in offspring of OB dams. Quantification of proteins via immunoblotting (Figure 3, A and B) also showed protein levels of SREBP-1c (P = .009), FASN (P = .003), GLUT-4 (P < .001), and glyceraldehyde 3-phosphate dehydrogenase (P < .05) were all markedly increased in OB dam offspring as compared with their lean counterparts.
Figure 2.

mRNA Expression Genes Associated with Lipogenesis and Adipogenesis in WAT of Offspring from Lean (n = 8 pups from 7 litters) and OB (n = 8 pups from 5 litters) Dams at PND21 Gene expression was assessed via real-time RT-PCR. Statistical differences between litter means were determined using Student's t test. *, Significance P < 0.05. ACC1, acetyl-CoA carboxylase.
Figure 3.

A, Immunoblots of lipogenesis-related and insulin signaling-related proteins (panel C) in total lysates from WAT of lean and OB dams at PND21 (n = 4 pools per group from 7 litters for lean and 5 litter for OB). B and D, Densitometric quantification of blots. E, Immunoblots of WAT lysates 5 minutes following acute insulin challenge administered through the hepatic portal vein (10 U/kg, n = 4–7; see Supplemental Table 1 for litters). Statistical differences were determined using Student's t test. *, Significance P < .05. ACC, acetyl-CoA carboxylase; ADU, arbitrary density units; GAPDH, glyceraldehyde 3-phosphate dehydrogenase.
Lipogenic gene expression in WAT is associated with increased insulin signaling
We examined the insulin signaling pathway in WAT of offspring because offspring of OB dams display modest hyperinsulinemia at weaning (4), and lipogenesis is exquisitely sensitive to insulin signaling. At the basal level, expression of pAKTthr308, pAKTser473, total AKT, pAS160, pERK42, or pERK44 (Figure 3, C and D) did not show differences between lean and OB offspring. However, total protein expression of insulin receptor-β and GSK3-α/β (P < .001) was significantly increased due to exposure to maternal OB (Figure 3, C and D). More importantly, following acute insulin stimulation, AKT phosphorylation (at ser473) in the OB offspring was approximately 1.9-fold greater than that in lean offspring (Figure 3E), suggesting an amplification of insulin signaling in WAT due to maternal OB. Overall, increased lipogenic gene expression and greater GLUT-4 mRNA/protein in offspring of OB dams appear to be associated with increased insulin signaling in WAT.
Exposure to maternal OB enhances adipogenic differentiation in offspring
Consistent with mRNA data, PPAR-γ protein expression was also increased 2.6-fold in WAT lysates from OB-dam offspring. Additionally, we found that protein levels of C/EBP-αp42 (P < .01), C/EBP-αp30 (P < .01), and C/EBP-β (P < .001) were increased approximately 2-fold in OB-dam offspring (Figure 4, A and B). Despite a small increase in total AMPK levels in offspring of OB dams, levels of pAMPK, a key regulator of both lipogenesis and adipogenesis, were significantly decreased (∼4-fold, P < .005) due to maternal OB (Figure 4, A and B).
Figure 4.
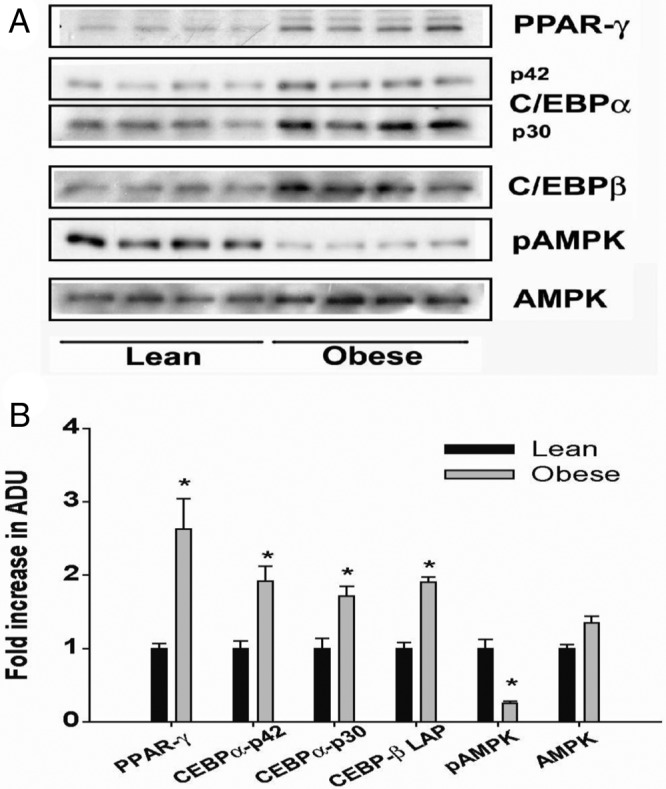
Immunoblot analysis (A) and densitometric quantification (B) of adipogenesis-related proteins in total lysates from WAT of lean and OB dams at PND21 (n = 4 pools per group; see Supplemental Table 1 for litters). Statistical differences were determined using Student's t test. *, Significance, P < .05. ADU, arbitrary density units.
Ex vivo differentiation of WAT SV cells was carried out at PND21 and PND100. At 7 days postinduction, OB dam offspring showed increased Oil-Red-O staining at both PND21 (Figure 5A) and PND100 (Figure 5C), indicating greater adipocyte differentiation. As anticipated, differentiation response was more robust at PND21 compared with that of older offspring. Gene expression of key adipocyte markers revealed robust induction of FABP4, leptin, and PPAR-γ mRNA following differentiation in both PND21 and PND100 (Figure 5, B and D). Consistent with increased differentiation, gene expression of FABP4 (1.2-fold), leptin (1.2-fold), and PPAR-γ (1.3-fold) were higher at day 7 in OB dam offspring, relative to lean-dam cohorts at PND21 (P < .05). Importantly, SV cells from OB offspring showed increased PPAR-γ and decreased Pref-1, even prior to adipogenic induction. Moreover, PPAR-γ mRNA was also constitutively higher in SV cells from offspring at PND100 (Figure 5, B and D).
Figure 5.

Representative Photomicrographs of Oil-Red-O-Stained SV Cells at Day 7 following Differentiation SV cells were isolated from offspring of lean and OB dams at PND21 (panel A) and PND100 (panel C). mRNA expression of genes associated with differentiation at PND21 (panel B) and PND100 (panel D) at day 0 and day 7. Gene expression is normalized to cyclophilin A mRNA and expressed as fold-change over levels in lean day 0. Statistical differences were determined using 2-way ANOVA followed by all pair-wise comparisons by Fisher least significant difference (LSD). Differing superscripts signify P < .05.
Maternal OB alters DNA methylation of development-related genes
RRBS covered an average of 2.4 million CpGs of which approximately 413,000 were assayed at 10× coverage. Bisulfite conversion efficiency in all samples was > 99.5%. Comparisons between lean and OB dam offspring at the individual CpG level revealed 356 CpG sites to be differentially methylated (DMS, P < .0005 and Δme ≥10%; Figure 6A). Annotation of these DMS showed approximately 48% overlapping a gene, whereas about 28% were in regions upstream of TSSs (Figure 6B). Intragenic DMSs were mainly localized in introns (68%), coding DNA sequence (28%), and untranslated regions (7.2%) (Figure 6C). Fifty percent of intergenic DMSs were located within 50 kb upstream of genes (Figure 6D). Enrichment analysis showed that development and morphogenesis-related processes including pattern specification, cell fate commitment, and mesenchymal cell development were enriched (P < .001; Figure 6E) due to maternal OB.
Figure 6.

A, Scatter plot of 356 CpG sites showing differential methylation (DMS, P < .0005; Δme ≥10% between OB and lean offspring). Percent methylation at each CpG site was assessed using RRBS. Genomic localization of intergenic DMS (panel B), intragenic DMS (panel C), and distance from closest transcription start sites (panel D). E, Enrichment of GO biological processes in differentially methylated sites using GoRilla. GO terms are plotted against negative log of corrected P values. UTR, untranslated region.
We computed methylation status of 10 506 promoters containing CGIs (73% of all CGI promoters) and 15 613 CGIs (based on minimum 5 CpGs per feature). Distribution of methylation levels clearly showed that most CGIs (>85%) and CGI promoters (>90%) show very little methylation (0%–20%) (Figure 7A). Most importantly, maternal OB did not alter the distribution of CGIs or CGI promoters with respect to methylation status. CGI shores, on the other hand, showed much greater methylation, with half of all shores showing more than 40% methylation. Despite lesser numbers of CGI shores being informatively assayed (4107), approximately 11% of CGI-shores showed Δme ≥ 15% due to maternal OB (Figure 7B). Empirical distribution of the difference in methylation for promoters-CGIs and CGI shores indicated that shores were about 3-fold more likely than promoters to show Δme ≥ 15% (OB vs lean) (probability of 0.18 vs 0.62 for CGI and CGI shores, respectively; Supplemental Figure 2).
Figure 7.

A, Percent frequency distribution of methylation status of informative promoters (TSS), promoters containing CGI (TSS_CGI), all CGIs, CGI shores, and CGI shores associated with TSS in lean and OB-dam offspring. Number of informative features used to calculate distribution is given in parentheses above. Methylation status of features is binned into 5 categories (0%–20%, 20%–40%, and so on). Promoters mostly hypomethylated, whereas CGI shores show variable methylation distribution. B and C, Scatter plot and enrichment of GO terms for CGI shores (with TSS) showing at least a 15% difference in methylation. Only CGI shores with minimum of 3 CpGs with 5× coverage were included. CGI shores near C/EBP-β (panel D) and Zfp423 (panel E), showing decreased methylation in offspring of OB dams. From top, tracks showing gene and coding DNA sequence are in red, whereas CGI and CGI shores are in gray. Methylated CpGs are shown in red, and unmethylated CpGs are shown in blue. Percent methylation of shore for each group is presented in the respective track. F, mRNA expression of Zfp423 in SV cell isolated from the retroperitoneal fat pad of offspring from lean and OB dams. G, Immunoblot and densitometric quantification of Zfp423 in WAT from lean and OB-dam offspring. EGF, epidermal growth factor.
Consistent with CpG level analysis, GO analysis of differentially methylated CGI shores revealed cellular development, pattern specification, and cell differentiation were highly enriched (Figure 7C). A closer analysis of the genes, revealed that OB-dam offspring showed decreased CGI-shore methylation of key adipogenic transcription factors, including C/EBP-β, Zfp423 (Figure 7, D and E) and PPARγ (Supplemental Table 6). Using real-time RT-PCR we confirmed that mRNA expression of Zfp423 was indeed increased in WAT SV cells prior to differentiation (Figure 7F). Further, OB-dam offspring also displayed reduced Zfp423 WAT protein expression as shown in Figure 7G. Methylation of the CGIs associated with these genes did not show any significant differences. Our findings suggest that increased differentiation of preadipocytes in OB-dam offspring is associated with DNA methylation changes in development-related genes.
Maternal OB modulates a novel adipogenic pathway
Due to the aforementioned promoter hypomethylation and concordant increased mRNA expression and protein expression of Zfp423 in SV cells from OB-dam offspring, we sought to further delineate the role of Zfp423 as a regulator of PPARγ and adipogenesis. A recently published paper by Hammarstedt et al. (31) found that a target of Wnt signaling, WNT1 inducible signaling protein 2 (WISP2), sequesters Zfp423 in the cytosol, preventing Zfp423 from entering the nucleus where it activates PPARγ (31). Examination of WISP2 mRNA expression (Figure 8C) revealed lower expression in WAT (retroperitoneal fat pad) in OB-dam offspring at PND21. In addition, a reduction in WISP2 protein expression was also evident (P = .071) (Figure 8D) in OB-dam offspring at PND21 consistent with greater PPARγ and Zfp423 expression. Upstream of WISP2, enhancer of zeste homolog 2 (EZH2) promotes adipogenesis via repression of Wnt signaling (32). Although not attaining statistical significance (P < .05), OB-dam offspring tended toward greater EZH2 protein expression (Figure 8A; P = .08) and lower Wnt10a mRNA expression (data not shown). Collectively, exposure to maternal OB led to increased EZH2, reduced WISP2 mRNA and protein expression, and increased Zfp423 and PPARγ expression. These results present a novel pathway by which maternal OB appears to regulate adipogenesis in the offspring.
Figure 8.
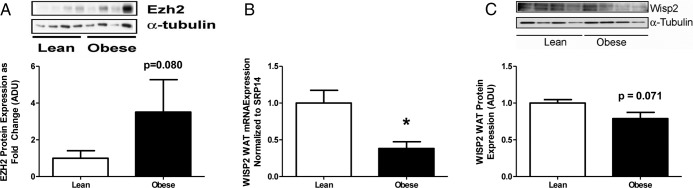
A, Immunoblot and densitometric quantification of Ezh2 in WAT from lean and OB-dam offspring. mRNA (B) and immunoblot and densitometric quantification (C) of WISP2 in WAT from lean and OB-dam offspring at PND21 (n = 4 pools per group; see Supplemental Table 1 for litters). Statistical differences were determined using Student's t test. *, Significance, P < .05.
Discussion
Maternal diet and body composition have a profound influence on the risk of OB and metabolic sequelae in the offspring. These include systemic insulin resistance (3), increased hepatic steatosis and lipid biosynthesis (4, 5, 17, 33, 34), reduction in skeletal muscle mass (35), and disruption of glucose homeostasis (6) among other effects. Here we show that offspring of OB dams at PND21 develop: 1) a distinct up-regulation of lipogenic pathways in WAT; 2) increased expression of adipogenic regulators in vivo, associated with greater ex vivo differentiation of WAT SV cells; and 3) alterations in DNA methylation of CpG sites and CGI shores, proximal to developmentally important genes. Overall, our findings suggest that the adipose tissue in rats is an important target of in utero programming.
Adipose tissue plays a central role in coordinating and regulating energy balance. In rodents and humans, expansion of WAT following chronic overnutrition is associated with both hypertrophy of existing adipocytes and increased fat cell numbers via differentiation (36). Indeed, we previously showed that offspring of OB dams consuming HFD (until PND130) show marked adipocyte hypertrophy and increased expression of adipogenic genes (3). To examine the underlying mechanisms, we sought to investigate early effects of programming that occur prior to adiposity and weight gain in the offspring. The present report demonstrates that both lipogenesis and adipogenesis in the WAT are increased, prior to challenge with HFD, and hence may be causative in adiposity accrual. Consistent with previous reports in offspring of HFD-fed rats and overfed sheep (7, 18, 19), offspring of OB dams in the present study showed a marked increase in the expression of adipogenic and lipogenic transcription factors. However, the present studies clearly demonstrate that increased protein expression of adipogenic factors (PPAR-γ, C/EBP-α, and C/EBP-β) in WAT translated into greater adipocyte differentiation ex vivo. Most importantly, our studies demonstrate that increased adipogenic differentiation in WAT is retained in OB-dam offspring at PND100, suggesting fundamental changes in these processes. Enhanced differentiation of SV cells could result from either greater preadipocyte commitment or a more permissive differentiation program in committed preadipocytes. Although the present study was unable to distinguish between these possibilities, we did identify greater expression of Zfp423, a newly identified zinc-finger protein controlling preadipocyte commitment. Ectopic expression of this transcriptional regulator in nonadipogenic fibroblasts up-regulates PPARγ and permits adipocytic differentiation (37). Further, we found that WISP2, which acts as a negative regulator of adipogenesis by sequestering Zfp423 in the cytosol and thus preventing PPARγ activation, was reduced in OB-dam offspring (31). In fact, key intermediates leading to increased PPARγ induction were altered by maternal OB. In an ongoing study, HFD-fed offspring of lean and OB dams at PND130 demonstrated decreased phosphorylated GSK3β and decreased nuclear protein expression of β-catenin in WAT. Because Wnt/β-catenin signaling antagonizes adipogenesis and directly controls WISP2 expression via the canonical pathway (31), these data suggest that maternal OB alters adipogenesis in the offspring downstream of developmentally regulated signaling. Moreover, offspring of OB dams showed greater C/EBP-β expression, which is recruited at quiescent adipogenic hotspots in preadipocytes and is required for binding of other transcription factors upon differentiation (36, 38). It is conceivable that greater Zfp423 and C/EBP-β in OB-dam offspring facilitate increased commitment and differentiation.
A salient finding from our work is that increased lipogenic gene expression in WAT was associated with greater GLUT-4 mRNA and protein and decreased phosphorylated AMPK, and with enhanced WAT insulin signaling. These findings are consistent with the previous observations, showing modestly elevated insulin signaling in the liver of OB-dam offspring (4). As in the liver, enhanced insulin signaling in WAT was associated with greater SREBP-1 and a battery of lipogenic genes. Moreover, GLUT-4, the major insulin-responsive glucose transporter in both skeletal muscle and WAT, is highly sensitive to nutritional changes and undergoes tissue-specific regulation in altered metabolic states. Transgenic mice overexpressing adipose-specific GLUT-4 show greater fat mass, glucose uptake, adipocyte numbers, and lipogenesis, under both basal and insulin-stimulated states (39, 40). These studies unequivocally showed that greater glucose flux into the adipocytes (following higher GLUT-4) drives lipogenesis and adiposity. Increased glucose uptake into the adipocytes is known to activate lipogenesis via the glucose-responsive transcription factor ChREBP (41). Indeed in our studies, both quantitative PCR and pathway analysis identified ChREBP as a critical regulator of genes altered by maternal OB. Thus, it is likely that increased GLUT-4 in WAT is causally related to the development of adiposity in the offspring. In fact, maternal overnutrition appears to up-regulate GLUT-4 levels in fetal perirenal adipose tissues of offspring as evident from recent findings from overnourished sheep (19). The mechanisms underlying increased GLUT-4 in WAT of OB-dam offspring remain unclear. However, GLUT-4 promoter CpG methylation (RRBS and bisulfite PCR sequencing) did not show differences between lean and OB dam offspring. Hence, it is likely that in addition to insulin signaling, other cis-acting mechanisms or histone modifications regulating GLUT-4 mRNA expression are involved.
A second important mechanism linking maternal OB to changes in WAT gene expression relates to AMPK. Previous studies, including ours, have shown AMPK to be a target of maternal OB in offspring liver and skeletal muscle (4, 35). The current findings extend AMPK dysregulation to WAT. AMPK is a pleiotrophic regulator of energy metabolism with significant influence on adipose tissue function (42). AMPK activation in WAT decreases insulin-stimulated glucose uptake and lipogenesis while increasing lipid and mitochondrial oxidation genes (42). Mice lacking AMPK-α2 subunit develop greater adiposity and adipocyte hypertrophy (43). Moreover, AMPK directly inhibits adipocyte differentiation in both primary and clonal (3T3-L1) preadipocytes (42). Hence, it is likely that AMPK dysregulation due to maternal OB contributes to both increased lipogenic and adipogenic gene expression in WAT at PND21.
An increasing body of evidence suggests that intrauterine and neonatal programming involve epigenetic changes (13, 14). Alterations in DNA methylation and histone modifications have been reported in a number of models (11, 12, 15, 44). In rat offspring, epigenetic alterations in key transcription factors, PPARα, glucocorticoid receptor, pancreatic duodenal homeobox-1, and hepatocyte nuclear factor-α, have been reported in diverse models of fetal growth restriction (12, 13, 15). In addition, maternal high-fat consumption has also been shown to influence DNA methylation and H3K14 acetylation of specific loci (11, 45). However, few studies have examined epigenetic changes in WAT of offspring. Most studies have utilized a targeted gene approach with the focus on methylation of CGIs. Overall, the magnitude of changes in DNA methylation due to maternal OB per se remains unclear. Using RRBS, we provide a genome-scale assessment of DNA methylation. Akin to traditional bisulfite-PCR sequencing, RRBS allows highly reproducible, digital assessment of DNA methylation (46, 47). Consequently, RRBS analysis is a valuable method to determine whether maternal OB leads to changes in methylation status and if so, which biological processes are broadly influenced. More specifically, RRBS was used to uncover whether any differences in methylation status of key targets involved in adipogenesis were evident. A potential limitation of the study was using whole WAT to perform methylation analysis rather than purifying specific cell populations. It is possible that the alterations in abundance of cell types within the adipose tissue may contribute to or mask DNA methylation differences. However, the relatively small amount of tissue (<0.5g) available from offspring at weaning and other methodological issues relating to isolation of specific cell populations from rat samples present a technical challenge in comprehensively assessing methylation status of specific cell populations.
Our analysis revealed that only a small proportion of all CpGs examined showed differential methylation. Not surprisingly, this difference was markedly smaller in comparison to intertissue methylation differences. This suggests that on a genome scale the overall effect of maternal OB on DNA methylation is small, but specific. Our findings are similar to a recent report by Li et al. (48), wherein the effect of maternal OB on hepatic DNA methylation was examined using an isogenic mouse model. Akin to our report, subtle changes in DNA methylation, mainly affecting developmental genes, were observed with little overlap with transcriptomic changes. Albeit in an entirely different model of maternal OB, our studies also revealed alterations in DNA methylation of developmental genes in a different tissue (WAT). Moreover, by evaluating broader genomic regions, we examined methylation status, not only of CpG-rich promoters, but also of CGI shores that have bone fide roles in gene regulation (29). Nonetheless, the direct influence of altered methylation on gene expression remains unclear. Although the general assumption that higher DNA methylation negatively influences gene expression has held up, the precise relationship between the two is ambiguous at present and likely context specific. Comparative transcriptome-methylome analyses show that 1) the negative global association between methylation and gene expression is present only in low-CpG dense promoters; and 2) promoters with high CpG density are mostly unmethylated and methylation does not correlate with constitutive gene expression (49). Moreover, these findings only partly explain the relationship between gene expression and promoter methylation, because methylation of CGI shores shows greater methylation variability and has been shown to correlate with gene expression of proximal genes (29). Furthermore, assessing correlations between methylation and constitutive gene expression does not speak to the inducibility of gene expression under specific physiological conditions. Because gene expression is acutely regulated via cis-acting transcription factors downstream of signaling pathways, it is quite conceivable that methylation of specific CpG sites might affect the inducibility/regulation of genes without changing constitutive expression. Hence, it is likely that the alteration in CpG methylation due to maternal OB only influences gene expression of a subset of genes in specific developmental contexts. Our results, showing changes in methylation and gene expression of developmental genes, are consistent with several lines of evidence that programming is initiated early during embryogenesis. Most importantly, CGI-shore methylation and mRNA expression of key adipogenic genes were reciprocally affected in OB-dam offspring, suggesting that increased adipogenesis is associated with epigenetic changes in WAT present at weaning.
In conclusion, we have demonstrated that exposure to maternal OB results in extensive changes in lipogenic and adipogenic genes in offspring WAT, preceding the development of OB. OB-dam offspring display increased ex vivo adipogenic differentiation of SV cells that is retained until later in life. These alterations are associated with increased insulin signaling, increased GLUT-4 expression, and lower AMPK signaling in WAT. Consistent with the premise that in utero programming leads to epigenetic changes, offspring of OB dams show alterations in DNA methylation of CGI shores located predominantly in development-related genes. More specifically, differential CGI-shore methylation of 2 key modulators of adipogenesis (C/EBP-β and Zfp423) was identified and a novel adipogenic pathway was found to be altered by maternal OB. These results suggest that gestational OB is likely to induce epigenetic alterations in WAT early during development.
Supplementary Material
Acknowledgments
We thank Michael L. Blackburn and Michèle Perry of the Arkansas Children's Nutrition Center for their technical assistance. We also thank Matt Ferguson and the members of the ACNC-Animal Research Core Facility for their assistance with TEN and animal studies.
These studies were supported, in part, by grants from the National Institutes of Health (R01-DK084225; to K.S.) and US Department of Agriculture Research Service (CRIS 6251–51000-007–04S).
Disclosure Summary: The authors have nothing to disclose.
Footnotes
- AMPK
- AMP-activated protein kinase
- C/EBP
- CCAAT enhancer binding protein
- CGI
- CpG island
- ChREBP
- carbohydrate-responsive element binding protein
- DM
- differentiation media
- DMS
- differentially methylated site
- EZH2
- enhancer of zeste homolog 2
- FASN
- fatty acid synthase
- GLUT
- glucose transporter
- GO
- gene ontology
- GSEA
- Gene Set Enrichment Analysis
- GSK
- glycogen synthase kinase
- HFD
- high-fat diet
- IPA
- Ingenuity Pathway Analysis
- OB
- obesity/obese
- PND
- postnatal day
- PPAR-γ
- peroxisome proliferator-activated receptor-γ
- RRBS
- reduced representation bisulfite sequencing
- SREBP
- sterol regulatory element-binding protein
- SV
- stromal vascular
- TEN
- total enteral nutrition
- TSS
- transcription start site
- WAT
- white adipose tissue
- WISP2
- WNT1-inducible signaling protein 2.
References
- 1. Flegal KM, Carroll MD, Kit BK, Ogden CL. Prevalence of obesity and trends in the distribution of body mass index among US adults, 1999–2010. JAMA. 2012;307:491–497 [DOI] [PubMed] [Google Scholar]
- 2. Nathanielsz PW, Poston L, Taylor PD. In utero exposure to maternal obesity and diabetes: animal models that identify and characterize implications for future health. Clin Perinatol. 2007;34:515–526, v [DOI] [PubMed] [Google Scholar]
- 3. Shankar K, Harrell A, Liu X, Gilchrist JM, Ronis MJ, Badger TM. Maternal obesity at conception programs obesity in the offspring. Am J Physiol Regul Integr Comp Physiol. 2008;294:R528–R538 [DOI] [PubMed] [Google Scholar]
- 4. Shankar K, Kang P, Harrell A, et al. Maternal overweight programs insulin and adiponectin signaling in the offspring. Endocrinology. 2010;151:2577–2589 [DOI] [PMC free article] [PubMed] [Google Scholar]
- 5. McCurdy CE, Bishop JM, Williams SM, et al. Maternal high-fat diet triggers lipotoxicity in the fetal livers of nonhuman primates. J Clin Invest. 2009;119:323–335 [DOI] [PMC free article] [PubMed] [Google Scholar]
- 6. Ainge H, Thompson C, Ozanne SE, Rooney KB. A systematic review on animal models of maternal high fat feeding and offspring glycaemic control. Int J Obes (Lond). 2011;35:325–335 [DOI] [PubMed] [Google Scholar]
- 7. Sen S, Simmons RA. Maternal antioxidant supplementation prevents adiposity in the offspring of Western diet-fed rats. Diabetes. 2010;59:3058–3065 [DOI] [PMC free article] [PubMed] [Google Scholar]
- 8. Catalano PM. Obesity and pregnancy–the propagation of a viscous cycle? J Clin Endocrinol Metab. 2003;88:3505–3506 [DOI] [PubMed] [Google Scholar]
- 9. Catalano PM, Presley L, Minium J, Hauguel-de Mouzon S. Fetuses of obese mothers develop insulin resistance in utero. Diabetes Care. 2009;32:1076–1080 [DOI] [PMC free article] [PubMed] [Google Scholar]
- 10. Smith J, Cianflone K, Biron S, et al. Effects of maternal surgical weight loss in mothers on intergenerational transmission of obesity. J Clin Endocrinol Metab. 2009;94:4275–4283 [DOI] [PubMed] [Google Scholar]
- 11. Aagaard-Tillery KM, Grove K, Bishop J, et al. Developmental origins of disease and determinants of chromatin structure: maternal diet modifies the primate fetal epigenome. J Mol Endocrinol. 2008;41:91–102 [DOI] [PMC free article] [PubMed] [Google Scholar]
- 12. Sandovici I, Smith NH, Nitert MD, et al. Maternal diet and aging alter the epigenetic control of a promoter-enhancer interaction at the Hnf4a gene in rat pancreatic islets. Proc Natl Acad Sci USA. 2011;108:5449–5454 [DOI] [PMC free article] [PubMed] [Google Scholar]
- 13. Lillycrop KA, Burdge GC. Epigenetic changes in early life and future risk of obesity. Int J Obes (Lond). 2011;35:72–83 [DOI] [PubMed] [Google Scholar]
- 14. Heerwagen MJ, Miller MR, Barbour LA, Friedman JE. Maternal obesity and fetal metabolic programming: a fertile epigenetic soil. Am J Physiol Regul Integr Comp Physiol. 2010;299:R711–R722 [DOI] [PMC free article] [PubMed] [Google Scholar]
- 15. Park JH, Stoffers DA, Nicholls RD, Simmons RA. Development of type 2 diabetes following intrauterine growth retardation in rats is associated with progressive epigenetic silencing of Pdx1. J Clin Invest. 2008;118:2316–2324 [DOI] [PMC free article] [PubMed] [Google Scholar]
- 16. Shankar K, Zhong Y, Kang P, et al. Maternal obesity promotes a proinflammatory signature in rat uterus and blastocyst. Endocrinology. 2011;152:4158–4170 [DOI] [PMC free article] [PubMed] [Google Scholar]
- 17. Borengasser SJ, Lau F, Kang P, et al. Maternal obesity during gestation impairs fatty acid oxidation and mitochondrial SIRT3 expression in rat offspring at weaning. PLoS One. 2011;6:e24068. [DOI] [PMC free article] [PubMed] [Google Scholar]
- 18. Muhlhausler BS, Duffield JA, McMillen IC. Increased maternal nutrition stimulates peroxisome proliferator activated receptor-γ, adiponectin, and leptin messenger ribonucleic acid expression in adipose tissue before birth. Endocrinology. 2007;148:878–885 [DOI] [PubMed] [Google Scholar]
- 19. Long NM, Rule DC, Zhu MJ, Nathanielsz PW, Ford SP. Maternal obesity upregulates fatty acid and glucose transporters and increases expression of enzymes mediating fatty acid biosynthesis in fetal adipose tissue depots. J Anim Sci. 2012;90:2201–2210 [DOI] [PubMed] [Google Scholar]
- 20. Saad MJ, Araki E, Miralpeix M, Rothenberg PL, White MF, Kahn CR. Regulation of insulin receptor substrate-1 in liver and muscle of animal models of insulin resistance. J Clin Invest. 1992;90:1839–1849 [DOI] [PMC free article] [PubMed] [Google Scholar]
- 21. Friedman JE, Ishizuka T, Liu S, et al. Reduced insulin receptor signaling in the obese spontaneously hypertensive Koletsky rat. Am J Physiol. 1997;273:E1014–E1023 [DOI] [PubMed] [Google Scholar]
- 22. Gupta RK, Mepani RJ, Kleiner S, et al. Zfp423 expression identifies committed preadipocytes and localizes to adipose endothelial and perivascular cells. Cell Metab. 2012;15:230–239 [DOI] [PMC free article] [PubMed] [Google Scholar]
- 23. Ronis MJ, Sharma N, Vantrease J, et al. Female mice lacking p47phox have altered adipose tissue gene expression and are protected against high fat-induced obesity. Physiol Genomics. 2013;45:351–366 [DOI] [PubMed] [Google Scholar]
- 24. Wagoner B, Hausman DB, Harris RB. Direct and indirect effects of leptin on preadipocyte proliferation and differentiation. Am J Physiol Regul Integr Comp Physiol. 2006;290:R1557–R1564 [DOI] [PubMed] [Google Scholar]
- 25. Gu H, Smith ZD, Bock C, Boyle P, Gnirke A, Meissner A. Preparation of reduced representation bisulfite sequencing libraries for genome-scale DNA methylation profiling. Nat Protoc. 2011;6:468–481 [DOI] [PubMed] [Google Scholar]
- 26. Smallwood SA, Tomizawa S, Krueger F, et al. Dynamic CpG island methylation landscape in oocytes and preimplantation embryos. Nat Genet. 2011;43:811–814 [DOI] [PMC free article] [PubMed] [Google Scholar]
- 27. Akalin A, Garrett-Bakelman FE, Kormaksson M, et al. Base-pair resolution DNA methylation sequencing reveals profoundly divergent epigenetic landscapes in acute myeloid leukemia. PLoS Genet. 2012;8:e1002781. [DOI] [PMC free article] [PubMed] [Google Scholar]
- 28. Wu H, Caffo B, Jaffee HA, Irizarry RA, Feinberg AP. Redefining CpG islands using hidden Markov models. Biostatistics. 2010;11:499–514 [DOI] [PMC free article] [PubMed] [Google Scholar]
- 29. Irizarry RA, Ladd-Acosta C, Wen B, et al. The human colon cancer methylome shows similar hypo- and hypermethylation at conserved tissue-specific CpG island shores. Nat Genet. 2009;41:178–186 [DOI] [PMC free article] [PubMed] [Google Scholar]
- 30. Eden E, Navon R, Steinfeld I, Lipson D, Yakhini Z. GOrilla: a tool for discovery and visualization of enriched GO terms in ranked gene lists. BMC Bioinformatics. 2009;10:48. [DOI] [PMC free article] [PubMed] [Google Scholar]
- 31. Hammarstedt A, Hedjazifar S, Jenndahl L, et al. WISP2 regulates preadipocyte commitment and PPARγ activation by BMP4. Proc Natl Acad Sci USA. 2013;110:2563–2568 [DOI] [PMC free article] [PubMed] [Google Scholar]
- 32. Wang L, Jin Q, Lee JE, Su IH, Ge K. Histone H3K27 methyltransferase Ezh2 represses Wnt genes to facilitate adipogenesis. Proc Natl Acad Sci USA. 2010;107:7317–7322 [DOI] [PMC free article] [PubMed] [Google Scholar]
- 33. Bruce KD, Cagampang FR, Argenton M, et al. Maternal high-fat feeding primes steatohepatitis in adult mice offspring, involving mitochondrial dysfunction and altered lipogenesis gene expression. Hepatology. 2009;50:1796–1808 [DOI] [PubMed] [Google Scholar]
- 34. Oben JA, Mouralidarane A, Samuelsson AM, et al. Maternal obesity during pregnancy and lactation programs the development of offspring non-alcoholic fatty liver disease in mice. J Hepatol. 2010;52:913–920 [DOI] [PubMed] [Google Scholar]
- 35. Zhu MJ, Han B, Tong J, et al. AMP-activated protein kinase signalling pathways are down regulated and skeletal muscle development impaired in fetuses of obese, over-nourished sheep. J Physiol. 2008;586:2651–2664 [DOI] [PMC free article] [PubMed] [Google Scholar]
- 36. Cristancho AG, Lazar MA. Forming functional fat: a growing understanding of adipocyte differentiation. Nat Rev Mol Cell Biol. 2011;12:722–734 [DOI] [PMC free article] [PubMed] [Google Scholar]
- 37. Gupta RK, Arany Z, Seale P, et al. Transcriptional control of preadipocyte determination by Zfp423. Nature. 2010;464:619–623 [DOI] [PMC free article] [PubMed] [Google Scholar]
- 38. Siersbaek R, Nielsen R, John S, et al. Extensive chromatin remodelling and establishment of transcription factor 'hotspots' during early adipogenesis. EMBO J. 2011;30:1459–1472 [DOI] [PMC free article] [PubMed] [Google Scholar]
- 39. Shepherd PR, Gnudi L, Tozzo E, Yang H, Leach F, Kahn BB. Adipose cell hyperplasia and enhanced glucose disposal in transgenic mice overexpressing GLUT4 selectively in adipose tissue. J Biol Chem. 1993;268:22243–22246 [PubMed] [Google Scholar]
- 40. Tozzo E, Shepherd PR, Gnudi L, Kahn BB. Transgenic GLUT-4 overexpression in fat enhances glucose metabolism: preferential effect on fatty acid synthesis. Am J Physiol. 1995;268:E956–E964 [DOI] [PubMed] [Google Scholar]
- 41. Ishii S, Iizuka K, Miller BC, Uyeda K. Carbohydrate response element binding protein directly promotes lipogenic enzyme gene transcription. Proc Natl Acad Sci USA. 2004;101:15597–15602 [DOI] [PMC free article] [PubMed] [Google Scholar]
- 42. Ceddia RB. The role of AMP-activated protein kinase in regulating white adipose tissue metabolism. Mol Cell Endocrinol. 2012;366:194–203 [DOI] [PubMed] [Google Scholar]
- 43. Villena JA, Viollet B, Andreelli F, Kahn A, Vaulont S, Sul HS. Induced adiposity and adipocyte hypertrophy in mice lacking the AMP-activated protein kinase-α2 subunit. Diabetes. 2004;53:2242–2249 [DOI] [PubMed] [Google Scholar]
- 44. Suter M, Bocock P, Showalter L, et al. Epigenomics: maternal high-fat diet exposure in utero disrupts peripheral circadian gene expression in nonhuman primates. FASEB J. 2011;25:714–726 [DOI] [PMC free article] [PubMed] [Google Scholar]
- 45. Dudley KJ, Sloboda DM, Connor KL, Beltrand J, Vickers MH. Offspring of mothers fed a high fat diet display hepatic cell cycle inhibition and associated changes in gene expression and DNA methylation. PLoS One. 2011;6:e21662. [DOI] [PMC free article] [PubMed] [Google Scholar]
- 46. Harris RA, Wang T, Coarfa C, et al. Comparison of sequencing-based methods to profile DNA methylation and identification of monoallelic epigenetic modifications. Nat Biotechnol. 2010;28:1097–1105 [DOI] [PMC free article] [PubMed] [Google Scholar]
- 47. Meissner A, Mikkelsen TS, Gu H, et al. Genome-scale DNA methylation maps of pluripotent and differentiated cells. Nature. 2008;454:766–770 [DOI] [PMC free article] [PubMed] [Google Scholar]
- 48. Li CC, Young PE, Maloney CA, et al. Maternal obesity and diabetes induces latent metabolic defects and widespread epigenetic changes in isogenic mice. Epigenetics. 2013;8:602–611 [DOI] [PMC free article] [PubMed] [Google Scholar]
- 49. Hartung T, Zhang L, Kanwar R, et al. Diametrically opposite methylome-transcriptome relationships in high- and low-CpG promoter genes in postmitotic neural rat tissue. Epigenetics. 2012;7:421–428 [DOI] [PMC free article] [PubMed] [Google Scholar]
Associated Data
This section collects any data citations, data availability statements, or supplementary materials included in this article.