Significance
Chemotaxis is a universal phenomenon whereby motile cells, like motile bacteria, navigate by following chemical gradients in their environment. Bacterial chemoreceptors can bind with specific chemoeffectors and transfer environmental signals to the cell. However, the molecular mechanisms for chemoeffector binding and signaling are not fully understood, and rational design of bacteria to respond to new chemicals has been challenging. In this study, by using a combined experimental and computational approach, we discovered novel antagonists and attractants for the Escherichia coli chemoreceptor Tar. The interaction differences of the novel antagonists and attractants with Tar provide clues to alter Tar–ligand specificity. Based on these understandings, E. coli strain was successfully engineered to sense l-arginine, a ligand unrecognized before.
Abstract
Bacterial chemoreceptors mediate chemotactic responses to diverse stimuli. Here, by using an integrated in silico, in vitro, and in vivo approach, we screened a large compound library and found eight novel chemoeffectors for the Escherichia coli chemoreceptor Tar. Six of the eight new Tar binding compounds induce attractant responses, and two of them function as antagonists that can bind Tar without inducing downstream signaling. Comparison between the antagonist and attractant binding patterns suggests that the key interactions for chemotaxis signaling are mediated by the hydrogen bonds formed between a donor group in the attractant and the main-chain carbonyls (Y149 and/or Q152) on the α4 helix of Tar. This molecular insight for signaling is verified by converting an antagonist to an attractant when introducing an N-H group into the antagonist to restore the hydrogen bond. Similar signal triggering effect by an O-H group is also confirmed. Our study suggests that the Tar chemoeffector binding pocket may be separated into two functional regions: region I mainly contributes to binding and region II contributes to both binding and signaling. This scenario of binding and signaling suggests that Tar may be rationally designed to respond to a nonnative ligand by altering key residues in region I to strengthen binding with the novel ligand while maintaining the key interactions in region II for signaling. Following this strategy, we have successfully redesigned Tar to respond to l-arginine, a basic amino acid that does not have chemotactic effect for WT Tar, by two site-specific mutations (R69′E and R73′E).
Two-component signaling pathways are ubiquitous in bacteria. They enable the cells to recognize and respond to different environmental stimuli (1). The control network of bacterial chemotaxis uses such a two-component system to sense the extracellular chemoeffector concentrations (2, 3). Chemoreceptors are the key upstream sensory components in the chemotaxis signaling pathway. They directly interact with specific extracellular chemoeffectors and transfer environmental information to the downstream response regulator, which ultimately controls the cell’s motility (4, 5).
Tar is one of the major chemoreceptors found in Escherichia coli and Salmonella enterica serovar Typhimurium (6). Attractant and repellent molecules that can induce chemotactic responses of the cells by interacting with Tar were studied (7). In addition to these two types of chemoeffectors, antagonist molecules that can directly bind to chemoreceptors without generating chemotactic responses should also exist. For example, antagonists for the sensor kinase TodS were found in the TodS/TodT two-component system (8). However, so far, antagonist molecules that function by directly binding to E. coli chemoreceptors have not been reported.
Much progress has been made in understanding the structural basis of chemoreceptor signaling. Crystal structures show that each monomer (in the Tar homodimer) contains a four-helix bundle (helices α1–α4) structure, of which the α1 and α4 helices span the membrane to form transmembrane domains (TM1 and TM2) (9–12). Increasing evidence verifies the piston model (13–20), which suggests that attractant binding to the Tar periplasmic domain generates a subtle piston-like sliding movement of the α4 helix relative to the α1 helix in one monomer within the chemoreceptor homodimer. This modest conformational change can be transduced over long distances to the cytoplasm. The attractant binding pocket of Tar has also been well characterized (12, 21–24). Among the key residues that bind with the ligand, some are on the signaling monomer (the monomer with the α4 sliding movement upon signaling) and others are on the nonsignaling monomer. This raises the question of the relationship between binding and signaling, that is, does binding always lead to signaling?
Tar is highly selective toward its chemoeffectors with the highest sensitivity for its native attractant l-aspartate (Asp), and lower sensitivities for several other amino acids (6, 25). Redesigning chemoreceptors to recognize and respond to nonnative ligands is highly desirable with potential applications in bioengineering and biotechnology. So far, however, successful change (or improvement) in chemoreceptor specificity were all carried out by genetic screening (i.e., directed evolution) (26). Structure-based rational design of receptor specificity remains highly challenging as the key molecular features for attractant binding and signaling are not fully understood.
In this paper, we report our work in trying to address these related questions. By using a combination of in vitro, in vivo, and in silico methods, we discovered several new chemoeffectors for Tar, including two antagonists. Comparing the molecular binding patterns of the attractants and the newly discovered antagonists suggests that the ligand–Tar interaction can be separated into two groups. The first group of interactions (type I) mainly stabilizes ligand binding. The second group of interactions (type II), which includes the hydrogen bonds formed between attractant and the main-chain carbonyls of the α4 helix, contributes to binding and signaling. These two types of interactions do not occur sequentially; they need to act together in concert to induce attractant signaling. Ligands that bind to Tar with only the type I interaction function as antagonists. Based on these molecular insights on binding and signaling, an E. coli mutant strain that responds to l-arginine (Arg) was designed successfully by introducing only two site-specific mutations.
Results
Screening for Potential Novel Chemoeffectors by Molecular Docking.
Molecular docking calculations were used to virtually screen compounds that may function as novel chemoeffectors for the E. coli Tar receptor. As no complex crystal structure is available for the periplasmic domain of E. coli Tar with Asp, we built a complex structure model based on the holo structure of Tar from Salmonella with Asp (Protein Data Bank ID code 1VLT) (12) and used it in virtual screening. Because of the limited size of the Asp binding pocket, compounds with molecular weight less than 300 Da were used (from the Available Chemical Directory, Elsevier MDL) in the docking study (27). The top 10,000 compounds with the lowest estimated binding free energies were manually inspected. Eighty typical compounds were purchased for the subsequent experimental study.
Binding Affinity Measurements by Isothermal Titration Calorimetry.
Isothermal titration calorimetry (ITC) is a technique for quantitatively measuring protein–ligand binding thermodynamic parameters. It is becoming widely used in fragment-based drug discovery to study low-affinity binding of fragments with target (refs. 28 and 29; www.gelifesciences.com/microcal). We measured the binding affinities of these 80 compounds to the purified E. coli Tar periplasmic domain by using ITC. The measured Kd of α-methyl-dl-aspartate (AMA; a known attractant for Tar) with the periplasmic domain (compound 1 in Table 1; see also SI Appendix, Fig. S1A) agrees with previously published Kd values obtained from competition centrifugation assay (6). Eight compounds exhibited significant binding to the Tar periplasmic domain (compounds 2–9 in Table 1; see also SI Appendix, Table S1 and Fig. S1 B–I).
Table 1.
Novel chemoeffectors for the E. coli chemoreceptor Tar
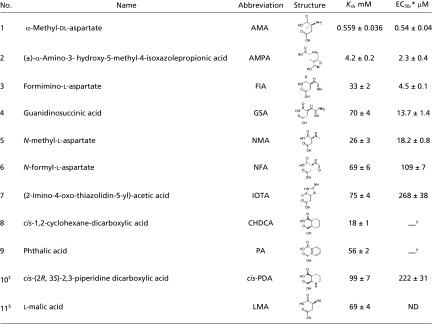 |
ND, not determined.
The attractant concentration eliciting the half-maximum response in FRET measurements.
No. 8 and 9 compounds induce no chemotactic response in cells upon binding to Tar.
No.10 compound was tested as an analog of the no. 8 compound CHDCA.
No.11 compound was tested as an analog of Asp.
Novel Chemoeffectors Identified by Microfluidic Experiments.
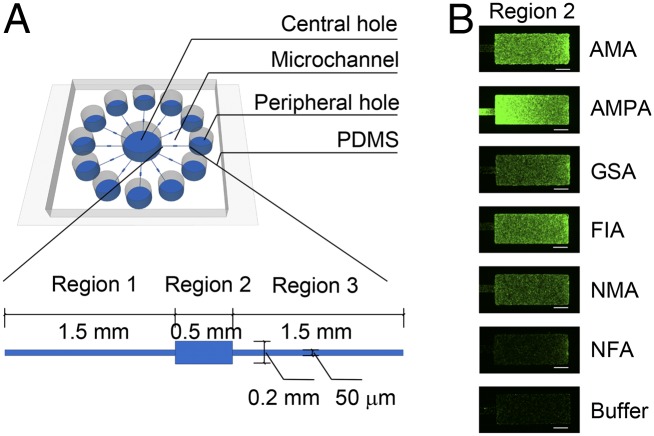
We measured the responses of E. coli cells to these 80 compounds, especially those that exhibited Tar binding, by using a specially designed microfluidic device in which the chemotaxis responses to several chemicals could be measured in parallel (Fig. 1A). We first measured the chemotactic responses of E. coli strains RP437 (WT) and UU1624 (possessing only the Tar chemoreceptor) to each of the 80 compounds. Cells labeled with GFP were placed in the central hole, and different test compounds (or different concentrations of the same compound) were introduced in the peripheral holes. For a true attractant such as AMA, which serves as the positive control, the cells sensed its gradient established by diffusion, moved through region 1 of the microchannel, and finally accumulated in region 2 (analysis region). Compared with the blank buffer, high fluorescence intensity in region 2, as in the case for AMA (Fig. 1B), indicated strong chemotactic response. Thus, the fluorescence intensity in region 2 indicated whether and how strong the corresponding test compound behaved as an attractant.
Fig. 1.
Microfluidic experiments identified novel Tar chemoeffectors. (A) Schematic of the microfluidic device used in the microfluidic experiments. Each microchannel is divided into three regions. The height of regions 1 and 3 is 5 μm, and that of region 2 is 25 μm. (B) Responses of the WT strain RP437 to AMA, novel attractants AMPA, GSA, FIA, NMA, NFA, and blank buffer, recorded by fluorescence microscopic images. (Scale bar, 100 μm.) Stronger fluorescence intensities (green) were observed in region 2 in the presence of gradients of attractants. The source concentrations were 1 mM for AMA and 10 mM for each of the five novel attractants.
Five compounds, guanidinosuccinic acid (GSA), AMPA, formimino-l-aspartate (FIA), N-methyl-l-aspartate (NMA), and N-formyl-l-aspartate (NFA) behaved as attractants for Tar, with a compound source concentration of 10 mM (Figs. 1B and 2 A and B). Another compound, (2-imino-4-oxo-thiazolidin-5-yl)-acetic acid (IOTA) showed attractant function at a compound source concentration of 100 mM (Fig. 2 A and B). Purity analysis ruled out possible contamination of Asp in the compound samples (SI Appendix, Fig. S2). All these six novel attractants showed binding to Tar in the ITC experiments. N-methyl-dl-aspartate was previously reported as an attractant to a mutant strain of E. coli (26). By using the highly sensitive microfluidic device, we found that NMA is an attractant specific for Tar. We also measured E. coli responses to different source concentrations of these novel attractants. The responses of cells were concentration dependent (SI Appendix, Fig. S3 A–F).
Fig. 2.
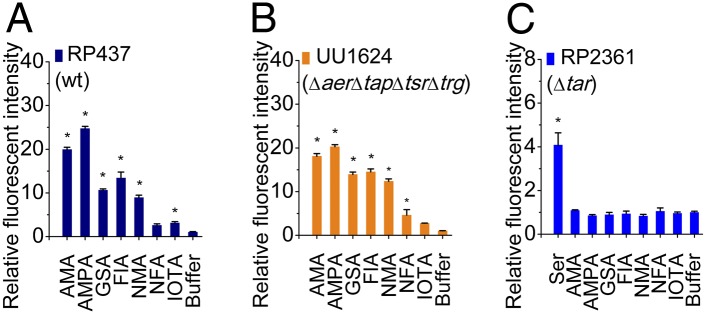
Responses of different E. coli strains to the novel attractants. The fluorescence intensities in region 2 emitted by different strains responding to novel attractants were normalized against the fluorescence intensity of cells responding to blank buffer. The relative intensities in region 2 emitted by RP437 (A) and UU1624 (B) are significantly stronger than the blank buffer, but those emitted by RP2361 (C) are similar to the blank buffer (mean ± SEM; n ≥ 2). As a control, the responses of RP437 and UU1624 to AMA, as well as RP2361 to l-serine (Ser), were also measured. The source concentrations were 1 mM for AMA and Ser; 10 mM for AMPA, GSA, FIA, NMA, and NFA; and 100 mM for IOTA. The compound concentration range for cells in region 1 was 0% to 50% of the source concentration (*Significance at P < 0.05 vs. blank buffer by one-way ANOVA).
To test whether these new compounds may also be sensed by other chemoreceptors, we used the mutant strain RP2361, which has all the chemoreceptors except Tar. As shown in Fig. 2C, RP2361 did not respond to any of the new compounds, showing that the new attractants work exclusively through Tar.
However, not all of the novel Tar binding molecules induced a chemotactic response. Compounds cis-1,2-cyclohexanedicarboxylic acid (CHDCA) and phthalic acid (PA), both binding to Tar, did not attract cells even when the source concentration was as high as 0.1 M (SI Appendix, Fig. S3 G and H). These two compounds have no repellent effect on Tar either, as verified by using another recently reported microfluidic device (30) optimized for detecting repellents as well as attractants. The discovery of these “futile” binding molecules provides a useful probe to understand the relationship of chemoeffector binding and chemotaxis signaling.
In Vivo Responses to Novel Chemoeffectors Measured by FRET.
To monitor the intracellular kinase activities, we measured cell intracellular response by using an in vivo assay based on FRET between CheY-YFP and CheZ-CFP (31). The Tar-only strain that expresses the CheY-YFP/CheZ-CFP pair and Tar receptor was stimulated by stepwise addition or removal of novel attractants at various concentrations (SI Appendix, Fig. S4 A–G). Following the same procedure reported in previous works (31, 32), the dose–response curves for each new attractant were measured and are shown in Fig. 3A. The EC50 value (i.e., the attractant concentration eliciting the half-maximum response) for each attractant was calculated. AMA was used as a control. Note that the Tar-only strain has more sensitive responses compared with the WT strain possessing all the chemoreceptors. For AMA, the EC50 value obtained here is 0.54 μM (for the Tar-only strain), whereas that from the previous study using the WT strain was 2.2 μM (33). The EC50 values for all of the novel attractants are in the micromolar or submillimolar range (Table 1), which are much lower than the Kd measured by ITC. Although we do not have an exact explanation for the large difference between the EC50 values and the Kd values, it is worth noting that the Kd value characterizes only the in vitro binding affinity of the ligand to the purified Tar periplasmic domain whereas the EC50 values depend on the in vivo kinase activity of the intact receptor complex, and they can be influenced by receptor clustering, which can further amplify signals resulting from ligand binding (31, 34). As a control, the Tsar-only strain (expressing the Tsar receptor, which is the chimera receptor replacing the periplasmic domain of Tar with the periplasmic domain of Tsr) showed no FRET response to the novel attractants, confirming that the attractant response was mediated by the Tar periplasmic domain (SI Appendix, Fig. S4H).
Fig. 3.
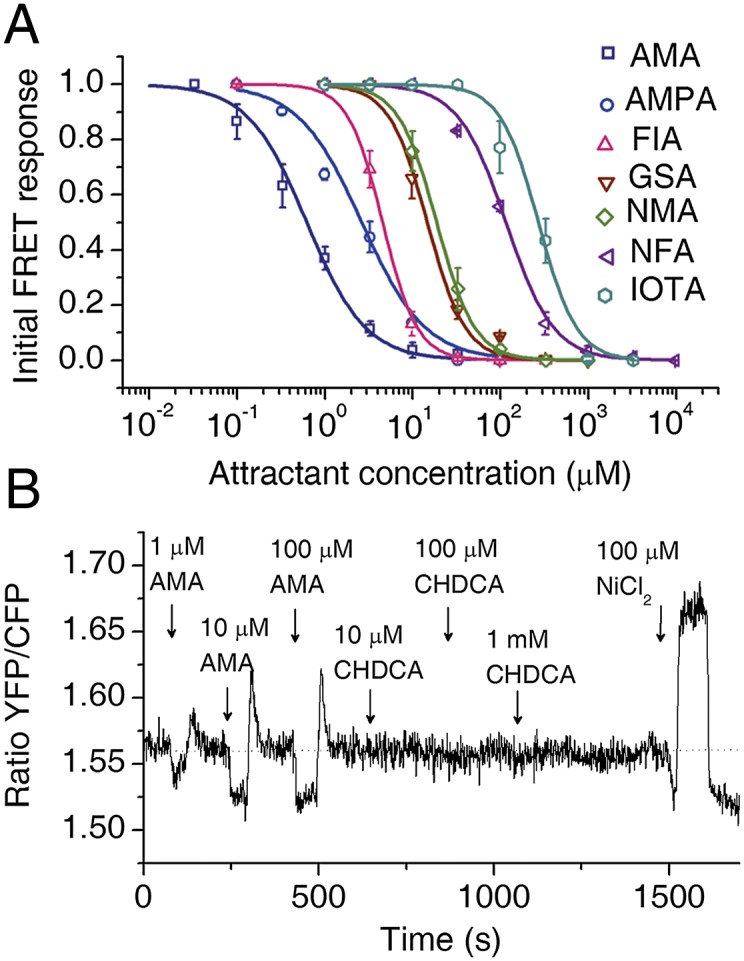
Responses of E. coli to novel chemoeffectors measured by FRET. (A) Responses of the Tar-only strain to steps of the novel attractants measured with the CheY-YFP/CheZ-CFP FRET pair (mean ± SEM; n ≥ 2). Data were fit by Hill model. (B) Response of the Tar-only strain to CHDCA measured by FRET. Cell responses to attractant AMA and repellent NiCl2 were measured as the controls.
We also measured the responses of the Tar-only strain to CHDCA and PA. No FRET signal changes were observed, which further verified that neither of them are attractants or repellents (Fig. 3B and SI Appendix, Fig. S4I).
Antagonists Compete with Attractants for Binding.
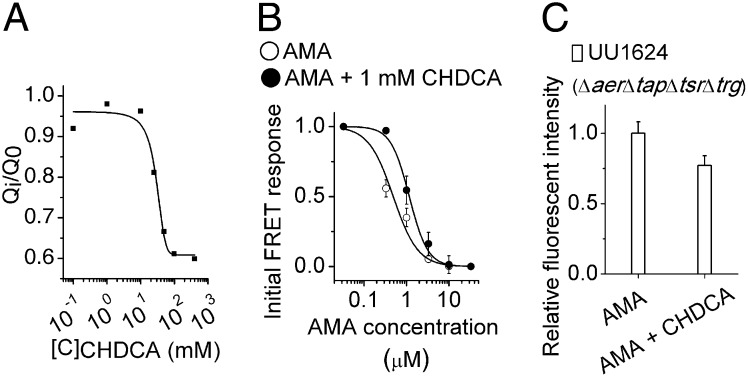
To understand the function of the antagonists, we used CHDCA to compete with AMA for Tar binding in several assays. By using ITC, we measured AMA binding with the purified Tar periplasmic domain in the presence of different concentrations of CHDCA. The measurements showed that the heat released from the binding of AMA to Tar was reduced depending on the CHDCA concentration (Fig. 4A). We also measured the intracellular kinase response to AMA in the presence of CHDCA by using FRET. With 1 mM background CHDCA, the dose–response curve of AMA shifted to higher concentrations, and the apparent EC50 increased from 0.5 μM to 1.2 μM (Fig. 4B and SI Appendix, Fig. S4J). Finally, E. coli cells were tested for their responses to AMA gradients with and without 1 mM uniform CHDCA by using the microfluidic assay. The mean speed and the mean angular speed of UU1624 cells that swimming in the blank buffer and in the ambient 1 mM CHDCA were almost the same during the experimental period, indicating that 1 mM CHDCA has little effect on the vitality and motility of cells (SI Appendix, Table S2). We found that cells showed weaker chemotactic responses to the AMA gradient with 1 mM CHDCA than without it (Fig. 4C). Higher concentrations of CHDCA were not investigated because of possible changes in the intracellular pH. All these results show that CHDCA functions as an antagonist by competitively binding to the attractant binding site in the Tar receptor.
Fig. 4.
Detection of the antagonist function of CHDCA. (A) Competitive ITC binding assay. CHDCA competes with AMA for Tar periplasmic domain binding. The WT Tar periplasmic domain was incubated with different concentrations of CHDCA, and the total heat released from its binding to AMA (Qi) were measured. Q0 was the total heat released from AMA binding to the same concentration of the Tar periplasmic domain without CHDCA. (B) Responses of the Tar-only strain to different AMA concentrations with or without 1 mM CHDCA (mean ± SEM; n ≥ 2) measured by FRET. Data are fitted by the Hill model. (C) The responses of UU1624 cells to the same gradient of AMA with or without 1 mM CHDCA (mean ± SEM; n = 12; P = 0.044, Student two-tailed unpaired t test). The presence of CHDCA reduces the chemotactic response to the AMA gradient.
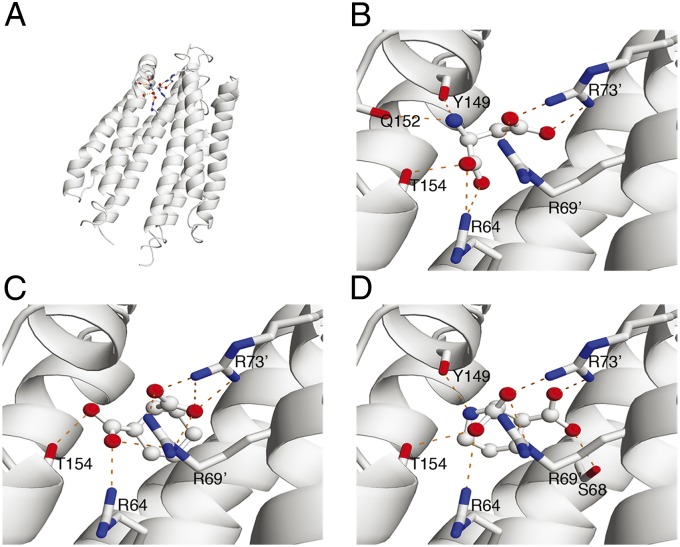
As shown in Fig. 5, molecular docking analysis predicted that CHDCA interacts with the Tar residues R64, R69′, and R73′, key residues reported for Asp binding (21, 24). To confirm these interactions, we made mutations R64A, R69′D, and R73′A in Tar and measured their binding affinities with CHDCA by ITC. These mutations degraded Tar’s binding affinity to CHDCA, with Kd values of 133 ± 35 mM for R64A and >200 mM for R69′D and R73′A, confirming the critical roles of these residues in CHDCA binding.
Fig. 5.
Comparison of attractant and antagonist binding to Tar predicted by molecular docking. (A) The whole view of Asp binding to the Tar periplasmic domain. Interactions of (B) Asp, (C) CHDCA, and (D) cis-PDA with Tar. The key interacting residues are shown as sticks, and the binding molecules are shown as balls and sticks. Hydrogen bonds were first identified with HBPLUS (43) and selected according to rational bond angles and distances, which are indicated by orange dashed lines. Oxygen atoms are shown in red and nitrogen atoms are shown in blue.
Converting an Antagonist to an Attractant.
To understand the key molecular features that differentiate attractants from antagonists, we compared their chemical structures and interaction patterns with Tar. All the attractant molecules possess at least one N-H group placed at a similar position as in Asp, whereas the two antagonist compounds do not. The N-H groups in the attractant molecules all form hydrogen bonds with the main-chain carbonyl groups of Y149 and/or Q152 on the α4 helix as Asp does.
To further investigate the role of the N-H group in signaling, we tested the effect of an CHDCA analog, cis-(2R,3S)-2,3-piperidine dicarboxylic acid (cis-PDA). Compared with CHDCA, the only difference in cis-PDA is the substitution of the cyclohexane ring with a piperidine ring, which corresponds to changing a methylene group to an imido group (compound 10 in Table 1). cis-PDA binds with the Tar periplasmic domain as shown in ITC study (Table 1 and SI Appendix, Table S1 and Fig. S1J). In contrast to CHDCA, cis-PDA behaves as an attractant in the microfluidic and FRET studies (Table 1 and SI Appendix, Fig. S5 A–E). The position of the cis-PDA N-H group in the binding pocket is similar to that of the Asp amino group, although somewhat distorted as a result of the ring structure (Fig. 5D).
The conversion of the futile binder CHDCA to an attractant by simply replacing a CH2 group with a NH group demonstrated that the N-H group in attractants functions as the signaling trigger, probably by inducing a downward shift of the α4 helix. The antagonist molecules, which lack an N-H group, can bind with Tar without inducing signaling. Besides the N-H group, other hydrogen bond donor groups can also serve as the trigger for signaling. Substituting the amino group in Asp with a hydroxyl group converts the molecule to l-malic acid (LMA; compound 11 in Table 1). Previous work reported that LMA is an attractant for E. coli and Salmonella (6, 35), although the detailed molecular interactions are not clear. Our ITC study shows that LMA can bind to the Tar periplasmic domain (Table 1 and SI Appendix, Table S1 and Fig. S1K). Microfluidic experiments show that only the strains possessing functional Tar (RP437 and UU1624) are attracted by LMA (SI Appendix, Fig. S5 F–H).
Taken together, our study indicates that a hydrogen bond donor group at the appropriate positions (near Y149 and Q152 of Tar) serves as the signaling trigger in attractant molecules.
Rational Design of Tar Specificity.
Based on the differences between attractants and antagonists analyzed here, we can classify the interactions between the receptor and chemoeffectors into two types: (i) those that contribute mainly to binding, and (ii) those that contribute to binding and signaling. For the molecules we tested, the interactions of the chemoeffector’s carboxyl groups with the binding pocket residues, especially R64, R69′, and R73′ (region I of the binding pocket), are type I interactions, whereas those of the chemoeffector’s N-H or O-H groups with the main-chain carbonyls of Y149 and/or Q152 on the α4 helix (region II of the binding pocket) are type II interactions. Both types of interactions contribute to the binding free energy, but type II interactions directly trigger downstream signaling. These two types of interactions act together in concert to induce attractant signaling. Based on these understandings, the binding pocket of Tar can be rationally designed to sense novel ligands by keeping interactions with region II while changing region I to form new interactions with the novel ligands. As Tar has the highest sensitivity to the acidic amino acid Asp, as an example of specificity engineering, we redesigned Tar to recognize Arg, a basic amino acid that cannot be sensed by WT Tar (6, 25) (SI Appendix, Fig. S6A). As the amino group in Arg can form hydrogen bonds with the region II of the Tar binding pocket, the main redesigning task is to make the region I in Tar favorably interact with Arg side chain. The R69′ and R73′ residues in the WT Tar binding pocket interact favorably with Asp. Changing these two positive charged residues to negative ones may produce Tar mutants that can bind to Arg. Following this strategy, we prepared three Tar mutants—R69′E, R73′E, and R69′ER73′E—and tested their responses to Arg.
Because we need to test response to only a single ligand, a simpler microfluidic device developed previously (30) was used to detect the responses of Tar mutant strains to Arg gradients (as detailed in SI Appendix).We found that the mutant strain R69′ER73′E in the observation channel could sense the gradient of Arg and accumulate in the analysis region (Fig. 6A). The relative fluorescent intensity in the analysis region increased with time, and the response was concentration dependent (Fig. 6B). The mutant strains R69′E and R73′E cannot sense Arg, probably because the remaining R69′ or R73′ destabilizes Arg side chain binding. In addition to Arg, the mutant strain R69′ER73′E can still sense Asp, although with a much lower ability (SI Appendix, Fig. S6B), and does not sense the other 18 types of amino acids. The mutant receptor R69′E, R73′E, and R69′ER73′E have similar expression level with WT Tar (SI Appendix, Fig. S6 C and D). Molecular docking analysis showed that the side chain of Arg interacts with the side chains of E69′ and E73′, and its amino group forms hydrogen bond with main-chain carbonyl group of Y149 (Fig. 6C). These results demonstrate the validity of our rational design strategy.
Fig. 6.
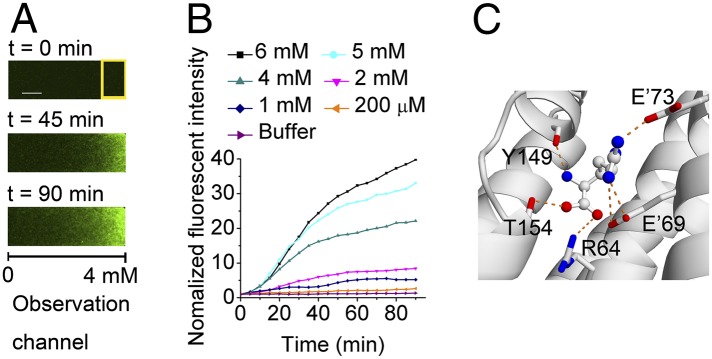
Rational design of Tar to chemotaxis to Arg. (A) Responses of the mutant strain R69′ER73′E to a gradient of Arg recorded by fluorescence microscopic images at different times (Scale bar, 100 μm.). The Arg gradient is from 0 to 4 mM across the observation channel. The response is characterized by the fluorescence intensity in the analysis region (yellow rectangle) of the observation channel. (B) Responses of the mutant strain R69′ER73′E to different Arg gradients. The concentrations given are the maximum Arg concentrations at the right end of the observation channel (the Arg concentration at the left end is 0 mM). The fluorescent intensities in the analysis region relative to the initial intensity were plotted as a function of time for different Arg gradients. (C) Interactions of Arg with the binding pocket of Tar variant R69′ER73′E predicted by molecular docking.
Summary and Discussion
In this paper, we combined computational and experimental methods to search for novel chemoeffectors for Tar. Virtual screening, an approach that has been used extensively in the drug discovery process (36, 37), was used to search for Tar binding compounds from a large chemical library. Six of the eight Tar binding compounds were attractants. The other two compounds behaved as antagonists. Borrok et al. identified an antagonist of the periplasmic glucose (or galactose) binding protein, which can inhibit glucose chemotaxis in E. coli via the chemoreceptor Trg (38). In the present study, we identified the first examples of antagonists that function by directly binding to the E. coli chemoreceptor. As chemotaxis is an important virulence factor for pathogenic bacteria, inhibiting chemotaxis of pathogenic bacteria is a potent therapeutic strategy to prevent or cure disease (39, 40). Discovering antagonists that directly interact with chemoreceptors may provide useful clues for antagonist design to inhibit the chemotaxis of pathogenic bacteria. Our combined computational and experimental approaches can be extended to discover novel chemoeffectors for other chemoreceptors.
Comparison between attractants and the antagonist molecules discovered here provided new molecular insights in chemoreceptor signaling. Previous work provided clues about the possible role of Asp amino group in chemotaxis signaling (10, 14, 15, 35, 41). Our study indicated explicitly that the interactions between the N-H group of chemoeffectors with carbonyls of Y149 and/or Q152 are crucial for signaling. Furthermore, we showed that the N-H group is not unique in serving as the signaling “trigger,” as other hydrogen bond donor groups such as the O-H group also work. Based on our study, the molecular interactions of a chemoeffector with Tar can be divided into two types: type I for binding and type II for binding and signaling. It would be interesting to study whether this molecular picture holds true for other chemoreceptors.
The structure-based rational design approach has been widely used in protein engineering and drug design. However, for chemoreceptor specificity change, rational design was difficult, as ligands designed to bind to Tar may not necessarily induce the right conformational changes that lead to chemotaxis (26). In this work, rational design of Tar to sense Arg was carried out by keeping the type II interactions intact while making changes to enhance/enable the type I interactions. By using this strategy, we designed a Tar variant that can positively sense Arg by only mutating two residues in the binding pocket. The successful Tar specificity redesign verifies our molecular understanding of the binding and signaling process in Tar. Although further optimization design or mutagenesis selection is needed to increase its sensitivity, our study demonstrated the proof of principle for rational design of chemoreceptor specificity, which can be extended to redesign specificities of other chemoreceptors (such as Tsr) or Tar to other nonnative chemoeffectors.
Materials and Methods
Strains and Plasmids.
Information regarding the genotypes, phenotypes, and sources of the bacterial strains and plasmids used in this study are listed in SI Appendix, Table S3.
Virtual Screening.
We modeled the complex structure of the E. coli Tar periplasmic domain with Asp based on the crystal structure of Salmonella Tar (SI Appendix, SI Materials and Methods). The AutoDock program (version 4.0.1) was used for the docking screening (42). Molecules with molecular weight <300 Da in the MDL Available Chemical Directory were selected for the docking study (149,063 molecules).
ITC Measurements.
ITC was performed at 25 °C on a MicroCal ITC200 calorimeter (GE Healthcare) to measure the binding affinities of compounds with the purified WT Tar periplasmic domain and those of CHDCA with the mutant proteins. All ITC data sets were analyzed by using the Origin software package supplied by MicroCal. See SI Appendix for details.
Microfluidic Experiments.
Details of the design, fabrication, and calibration of the device are shown in Fig. 1A and SI Appendix. For novel chemoeffector selection, compound solution was loaded into individual peripheral holes and stable linear gradients were generated. The prepared E. coli cells expressing GFP proteins were loaded into the central hole. One to two hours after loading the cells, the responses of cells to different compounds (or different concentrations of the same compound) were observed by using an inverted microscope at 30 °C. The fluorescence signals were measured to quantify cell densities in region 2. For the antagonist function detection, the test device and control device were filled with 1 mM CHDCA and blank buffer, respectively. Differences between the chemotactic responses of cells to the AMA gradient with or without CHDCA were observed and analyzed according to the accumulated intensities in region 2. All data were analyzed by using ImageJ [National Institutes of Health (NIH)].
FRET Measurements.
The cell preparation and FRET measurement were performed as described before (31, 32). Cells of the Tar-only strain or the Tsar-only strain were stimulated with chemoeffectors of interest. The fluorescence signals were recorded in the cyan and yellow channels. Data were analyzed as previously described and fit to a Hill model to obtain EC50 for each novel attractant (31).
Rational Design of Tar.
Tar mutants R69′E, R73′E, and R69′ER73′E were generated by site-directed mutagenesis by using the plasmid pPD12 encoding WT Tar as the template. The plasmid pPD12 or its mutants together with the GFP encoding plasmid pCM18 were transformed into E. coli strain UU1250 (lacks all chemoreceptors). The responses of E. coli strains expressing WT Tar, R69′E, R73′E, or R69′ER73′E mutant Tar proteins to the gradients of arginine were measured by using a previously described microfluidic device (30) (SI Appendix). The images were captured every 5 min for 90 min.
Other detailed experimental and computational procedures are described in SI Appendix, SI Materials and Methods.
Supplementary Material
Acknowledgments
We thank Prof. J. S. Parkinson (University of Utah) for providing the RP437, UU1250, UU1624, and RP2361 strains and the pLC113 plasmid; Prof. M. Goulian (University of Pennsylvania) for providing the pPD10 and pPD12 plasmid; and Prof. S. Molin (Technical University of Denmark) for providing the pCM18 plasmid. This work was supported in part by National Natural Science Foundation of China 21173013 and 11021463, Ministry of Science and Technology of China 2009CB918500, and NIH Grants GM081747 (to Y.T.) and GM082938 (to V.J. and V.S.).
Footnotes
The authors declare no conflict of interest.
*This Direct Submission article had a prearranged editor.
This article contains supporting information online at www.pnas.org/lookup/suppl/doi:10.1073/pnas.1306811110/-/DCSupplemental.
References
- 1.Stock AM, Robinson VL, Goudreau PN. Two-component signal transduction. Annu Rev Biochem. 2000;69:183–215. doi: 10.1146/annurev.biochem.69.1.183. [DOI] [PubMed] [Google Scholar]
- 2.Falke JJ, Bass RB, Butler SL, Chervitz SA, Danielson MA. The two-component signaling pathway of bacterial chemotaxis: A molecular view of signal transduction by receptors, kinases, and adaptation enzymes. Annu Rev Cell Dev Biol. 1997;13:457–512. doi: 10.1146/annurev.cellbio.13.1.457. [DOI] [PMC free article] [PubMed] [Google Scholar]
- 3.Baker MD, Wolanin PM, Stock JB. Signal transduction in bacterial chemotaxis. Bioessays. 2006;28(1):9–22. doi: 10.1002/bies.20343. [DOI] [PubMed] [Google Scholar]
- 4.Hazelbauer GL, Falke JJ, Parkinson JS. Bacterial chemoreceptors: High-performance signaling in networked arrays. Trends Biochem Sci. 2008;33(1):9–19. doi: 10.1016/j.tibs.2007.09.014. [DOI] [PMC free article] [PubMed] [Google Scholar]
- 5.Hazelbauer GL, Lai WC. Bacterial chemoreceptors: Providing enhanced features to two-component signaling. Curr Opin Microbiol. 2010;13(2):124–132. doi: 10.1016/j.mib.2009.12.014. [DOI] [PMC free article] [PubMed] [Google Scholar]
- 6.Clarke S, Koshland DE., Jr Membrane receptors for aspartate and serine in bacterial chemotaxis. J Biol Chem. 1979;254(19):9695–9702. [PubMed] [Google Scholar]
- 7.Boyd A, Simon M. Bacterial chemotaxis. Annu Rev Physiol. 1982;44:501–517. doi: 10.1146/annurev.ph.44.030182.002441. [DOI] [PubMed] [Google Scholar]
- 8.Busch A, Lacal J, Martos A, Ramos JL, Krell T. Bacterial sensor kinase TodS interacts with agonistic and antagonistic signals. Proc Natl Acad Sci USA. 2007;104(34):13774–13779. doi: 10.1073/pnas.0701547104. [DOI] [PMC free article] [PubMed] [Google Scholar]
- 9.Chi YI, Yokota H, Kim SH. Apo structure of the ligand-binding domain of aspartate receptor from Escherichia coli and its comparison with ligand-bound or pseudoligand-bound structures. FEBS Lett. 1997;414(2):327–332. doi: 10.1016/s0014-5793(97)01027-2. [DOI] [PubMed] [Google Scholar]
- 10.Milburn MV, et al. Three-dimensional structures of the ligand-binding domain of the bacterial aspartate receptor with and without a ligand. Science. 1991;254(5036):1342–1347. doi: 10.1126/science.1660187. [DOI] [PubMed] [Google Scholar]
- 11.Yeh JI, Biemann HP, Pandit J, Koshland DE, Jr, Kim SH. The three-dimensional structure of the ligand-binding domain of a wild-type bacterial chemotaxis receptor. Structural comparison to the cross-linked mutant forms and conformational changes upon ligand binding. J Biol Chem. 1993;268(13):9787–9792. [PubMed] [Google Scholar]
- 12.Yeh JI, et al. High-resolution structures of the ligand binding domain of the wild-type bacterial aspartate receptor. J Mol Biol. 1996;262(2):186–201. doi: 10.1006/jmbi.1996.0507. [DOI] [PubMed] [Google Scholar]
- 13.Chervitz SA, Falke JJ. Lock on/off disulfides identify the transmembrane signaling helix of the aspartate receptor. J Biol Chem. 1995;270(41):24043–24053. doi: 10.1074/jbc.270.41.24043. [DOI] [PMC free article] [PubMed] [Google Scholar]
- 14.Falke JJ, Hazelbauer GL. Transmembrane signaling in bacterial chemoreceptors. Trends Biochem Sci. 2001;26(4):257–265. doi: 10.1016/s0968-0004(00)01770-9. [DOI] [PMC free article] [PubMed] [Google Scholar]
- 15.Gardina PJ, Manson MD. Attractant signaling by an aspartate chemoreceptor dimer with a single cytoplasmic domain. Science. 1996;274(5286):425–426. doi: 10.1126/science.274.5286.425. [DOI] [PubMed] [Google Scholar]
- 16.Hughson AG, Hazelbauer GL. Detecting the conformational change of transmembrane signaling in a bacterial chemoreceptor by measuring effects on disulfide cross-linking in vivo. Proc Natl Acad Sci USA. 1996;93(21):11546–11551. doi: 10.1073/pnas.93.21.11546. [DOI] [PMC free article] [PubMed] [Google Scholar]
- 17.Lynch BA, Koshland DE., Jr The fifth Datta Lecture. Structural similarities between the aspartate receptor of bacterial chemotaxis and the trp repressor of E. coli. Implications for transmembrane signaling. FEBS Lett. 1992;307(1):3–9. doi: 10.1016/0014-5793(92)80891-j. [DOI] [PubMed] [Google Scholar]
- 18.Murphy OJ, 3rd, Kovacs FA, Sicard EL, Thompson LK. Site-directed solid-state NMR measurement of a ligand-induced conformational change in the serine bacterial chemoreceptor. Biochemistry. 2001;40(5):1358–1366. doi: 10.1021/bi0015109. [DOI] [PubMed] [Google Scholar]
- 19.Ottemann KM, Xiao W, Shin YK, Koshland DE., Jr A piston model for transmembrane signaling of the aspartate receptor. Science. 1999;285(5434):1751–1754. doi: 10.1126/science.285.5434.1751. [DOI] [PubMed] [Google Scholar]
- 20.Draheim RR, Bormans AF, Lai RZ, Manson MD. Tryptophan residues flanking the second transmembrane helix (TM2) set the signaling state of the Tar chemoreceptor. Biochemistry. 2005;44(4):1268–1277. doi: 10.1021/bi048969d. [DOI] [PubMed] [Google Scholar]
- 21.Björkman AM, Dunten P, Sandgren MO, Dwarakanath VN, Mowbray SL. Mutations that affect ligand binding to the Escherichia coli aspartate receptor: Implications for transmembrane signaling. J Biol Chem. 2001;276(4):2808–2815. doi: 10.1074/jbc.M009593200. [DOI] [PubMed] [Google Scholar]
- 22.Lee L, Imae Y. Role of threonine residue 154 in ligand recognition of the Tar chemoreceptor in Escherichia coli. J Bacteriol. 1990;172(1):377–382. doi: 10.1128/jb.172.1.377-382.1990. [DOI] [PMC free article] [PubMed] [Google Scholar]
- 23.Mowbray SL, Koshland DE., Jr Mutations in the aspartate receptor of Escherichia coli which affect aspartate binding. J Biol Chem. 1990;265(26):15638–15643. [PubMed] [Google Scholar]
- 24.Wolff C, Parkinson JS. Aspartate taxis mutants of the Escherichia coli Tar chemoreceptor. J Bacteriol. 1988;170(10):4509–4515. doi: 10.1128/jb.170.10.4509-4515.1988. [DOI] [PMC free article] [PubMed] [Google Scholar]
- 25.Hedblom ML, Adler J. Chemotactic response of Escherichia coli to chemically synthesized amino acids. J Bacteriol. 1983;155(3):1463–1466. doi: 10.1128/jb.155.3.1463-1466.1983. [DOI] [PMC free article] [PubMed] [Google Scholar]
- 26.Derr P, Boder E, Goulian M. Changing the specificity of a bacterial chemoreceptor. J Mol Biol. 2006;355(5):923–932. doi: 10.1016/j.jmb.2005.11.025. [DOI] [PubMed] [Google Scholar]
- 27.Wei D, Zheng H, Su N, Deng M, Lai L. Binding energy landscape analysis helps to discriminate true hits from high-scoring decoys in virtual screening. J Chem Inf Model. 2010;50(10):1855–1864. doi: 10.1021/ci900463u. [DOI] [PubMed] [Google Scholar]
- 28.Turnbull WB, Daranas AH. On the value of c: Can low affinity systems be studied by isothermal titration calorimetry? J Am Chem Soc. 2003;125(48):14859–14866. doi: 10.1021/ja036166s. [DOI] [PubMed] [Google Scholar]
- 29.Tellinghuisen J. Isothermal titration calorimetry at very low c. Anal Biochem. 2008;373(2):395–397. doi: 10.1016/j.ab.2007.08.039. [DOI] [PubMed] [Google Scholar]
- 30.Si G, Yang W, Bi S, Luo C, Ouyang Q. A parallel diffusion-based microfluidic device for bacterial chemotaxis analysis. Lab Chip. 2012;12(7):1389–1394. doi: 10.1039/c2lc21219f. [DOI] [PubMed] [Google Scholar]
- 31.Sourjik V, Berg HC. Receptor sensitivity in bacterial chemotaxis. Proc Natl Acad Sci USA. 2002;99(1):123–127. doi: 10.1073/pnas.011589998. [DOI] [PMC free article] [PubMed] [Google Scholar]
- 32.Sourjik V, Vaknin A, Shimizu TS, Berg HC. In vivo measurement by FRET of pathway activity in bacterial chemotaxis. Methods Enzymol. 2007;423:365–391. doi: 10.1016/S0076-6879(07)23017-4. [DOI] [PubMed] [Google Scholar]
- 33.Neumann S, Hansen CH, Wingreen NS, Sourjik V. Differences in signalling by directly and indirectly binding ligands in bacterial chemotaxis. EMBO J. 2010;29(20):3484–3495. doi: 10.1038/emboj.2010.224. [DOI] [PMC free article] [PubMed] [Google Scholar]
- 34.Sourjik V, Berg HC. Functional interactions between receptors in bacterial chemotaxis. Nature. 2004;428(6981):437–441. doi: 10.1038/nature02406. [DOI] [PubMed] [Google Scholar]
- 35.Mesibov R, Adler J. Chemotaxis toward amino acids in Escherichia coli. J Bacteriol. 1972;112(1):315–326. doi: 10.1128/jb.112.1.315-326.1972. [DOI] [PMC free article] [PubMed] [Google Scholar]
- 36.Walters WP, Stahl MT, Murcko MA. Virtual screening - an overview. Drug Discov Today. 1998;3(4):160–178. [Google Scholar]
- 37.Rester U. From virtuality to reality - Virtual screening in lead discovery and lead optimization: a medicinal chemistry perspective. Curr Opin Drug Discov Devel. 2008;11(4):559–568. [PubMed] [Google Scholar]
- 38.Borrok MJ, Zhu Y, Forest KT, Kiessling LL. Structure-based design of a periplasmic binding protein antagonist that prevents domain closure. ACS Chem Biol. 2009;4(6):447–456. doi: 10.1021/cb900021q. [DOI] [PMC free article] [PubMed] [Google Scholar]
- 39.Josenhans C, Suerbaum S. The role of motility as a virulence factor in bacteria. Int J Med Microbiol. 2002;291(8):605–614. doi: 10.1078/1438-4221-00173. [DOI] [PubMed] [Google Scholar]
- 40.Lux R, Moter A, Shi W. Chemotaxis in pathogenic spirochetes: Directed movement toward targeting tissues? J Mol Microbiol Biotechnol. 2000;2(4):355–364. [PubMed] [Google Scholar]
- 41.Yang Y, Park H, Inouye M. Ligand binding induces an asymmetrical transmembrane signal through a receptor dimer. J Mol Biol. 1993;232(2):493–498. doi: 10.1006/jmbi.1993.1405. [DOI] [PubMed] [Google Scholar]
- 42.Huey R, Morris GM, Olson AJ, Goodsell DS. A semiempirical free energy force field with charge-based desolvation. J Comput Chem. 2007;28(6):1145–1152. doi: 10.1002/jcc.20634. [DOI] [PubMed] [Google Scholar]
- 43.McDonald IK, Thornton JM. Satisfying hydrogen bonding potential in proteins. J Mol Biol. 1994;238(5):777–793. doi: 10.1006/jmbi.1994.1334. [DOI] [PubMed] [Google Scholar]
Associated Data
This section collects any data citations, data availability statements, or supplementary materials included in this article.


