

Significance
Pentameric ligand-gated ion channels (pLGICs) control membrane conductance in living systems from bacteria to humans. Molecular dynamics simulations based on the structures of the prokaryotic channels from Gloeobacter violaceus (GLIC) and Erwinia chrysanthemi (ELIC) and the eukaryotic channel from Caenorhabditis elegans (GluCl) show that the open-to-closed transition begins with a major quaternary (twisting) transition which is followed by tertiary relaxation of the pore-forming helices. The latter is initiated by the outward tilting of the extracellular β-sandwiches in response to agonist unbinding. The proposed atomic resolution mechanism for channel gating, which is in accord with the Monod–Wyman–Changeux model of allostery, is expected to be generally applicable to pLGICs.
Keywords: neurotransmitter receptors, chemo-electrical transduction, ion channel gating
Abstract
Pentameric ligand-gated ion channels (pLGICs) play a central role in intercellular communication in the nervous system and are involved in fundamental processes such as attention, learning, and memory. They are oligomeric protein assemblies that convert a chemical signal into an ion flux through the postsynaptic membrane, but the molecular mechanism of gating ions has remained elusive. Here, we present atomistic molecular dynamics simulations of the prokaryotic channels from Gloeobacter violaceus (GLIC) and Erwinia chrysanthemi (ELIC), whose crystal structures are thought to represent the active and the resting states of pLGICs, respectively, and of the eukaryotic glutamate-gated chloride channel from Caenorhabditis elegans (GluCl), whose open-channel structure was determined complexed with the positive allosteric modulator ivermectin. Structural observables extracted from the trajectories of GLIC and ELIC are used as progress variables to analyze the time evolution of GluCl, which was simulated in the absence of ivermectin starting from the structure with bound ivermectin. The trajectory of GluCl with ivermectin removed shows a sequence of structural events that couple agonist unbinding from the extracellular domain to ion-pore closing in the transmembrane domain. Based on these results, we propose a structural mechanism for the allosteric communication leading to deactivation/activation of the GluCl channel. This model of gating emphasizes the coupling between the quaternary twisting and the opening/closing of the ion pore and is likely to apply to other members of the pLGIC family.
Pentameric ligand-gated ion channels (pLGICs) mediate intercellular communication in the brain by converting a chemical signal, typically a local increase in the extracellular concentration of neurotransmitter, into an electrical signal, which is generated by an ion flux through the postsynaptic membrane (1). Understanding their function at an atomic level of detail is likely to be useful for the development of drug therapies against a range of disorders, including nicotine addiction, Alzheimer’s disease, schizophrenia, and depression (2).
pLGICs are oligomeric membrane proteins with a fivefold pseudosymmetry axis perpendicular to the membrane. Each subunit consists of an extracellular (EC) domain that contains the ligand-binding site and a transmembrane (TM) ion-pore domain. The agonist binding site is located at the boundary between subunits in the EC domain whereas the ion pore is formed by the transmembrane helices M2, which differentiate axial cationic and anionic channels (Fig. 1). An essential element of the mechanism is that these topologically distinct domains are allosterically coupled to each other (3, 4).
Fig. 1.

Topology of pentameric LGICs as visualized by the crystal structure of GluCl. (Upper) Side view of the homopentamer along the membrane delineated in yellow. The pseudosymmetry axis of the pentamer that runs perpendicular to the membrane is shown as small gray spheres. The front A and B subunits, which correspond to the principal (+) and the complementary (−) subunits, respectively, are shown in cartoon representations in light and dark gray, with residues of the “core” highlighted in orange and brown; see Materials and Methods for a structural definition of the core. The C, D, and E subunits are shown as solvent-accessible surfaces color-coded according to the EC (tones of red) and TM (cyan) domains. The endogenous agonist l-glutamate that binds to the orthosteric site at the A/B subunit interface in the EC domain is shown as green spheres. The orthosteric binding pocket is closed by the C-loop (thick blue tube) of the A subunit. The allosteric agonist ivermectin (IVM) that binds at the A/B subunit interface in the TM domain is depicted as sticks (magenta). The M2–M3 loop and the β1–β2 loop of the A subunit at the EC/TM interface are shown as thick red tubes. (Lower) View of the TM domain from the extracellular side; the EC domain was removed for clarity. The five M2–M3 loops (thick red tubes) and bound IVM ligands (magenta sticks) are shown. The orientation of the pore-lining helices M2 is crucial for the opening/closing of the ion pore (see Results).
Electrophysiology analysis of pLGICs first showed that the rapid delivery of agonist promotes fast opening of the channel whereas prolonged applications lead to a slow decrease of the response amplitude or “desensitization” (5). Several kinetic models have been proposed for the processes of activation and desensitization (2, 5). Based on the Monod–Wyman–Changeux (MWC) model (6), it has been postulated that allosteric LGICs spontaneously exist in a reversible equilibrium between several quaternary structures: a resting state (R), an active open-channel state (A), and one or several high-affinity desensitized state(s) with a closed channel (D) (2, 7). In this model, the effect of the ligand is described in terms of the affinity for the different states of the receptor; for example, agonist binding shifts the equilibrium to the A state and antagonist binding shifts the equilibrium to the R state. In addition, ligand binding can alter the rate of the transition between the quaternary states. The gating reaction, i.e., the pathway leading to ion-channel activation, has been described as the propagation of a conformational “wave” from the neurotransmitter site(s) to the transmembrane ion pore, which is produced by the sequential movement of nanometer-sized domains on the 10- to 100-ns timescale (8). In the original MWC model and its applications [see, for example, Cui and Karplus (9) and Changeux (10)], tertiary, as well as quaternary, changes can be involved in the transition from one state to the other. In this framework, the focus of ref. 8 is on the fast tertiary structural changes.
Prokaryotic pLGICs identified in Gloeobacter violaceus (GLIC) and Erwinia chrysanthemi (ELIC) (11–13) have recently provided structures for both the open and closed ion-channel forms at atomic resolution. Because GLIC, which is proton-activated, was crystallized in acidic conditions (14, 15) and ELIC was solved with no ligand bound (16) and in complex with the competitive antagonist acetylcholine (17), these structures are thought to represent the A and R states of pLGICs, respectively. More recently, the structure of a eukaryotic chloride channel from Caenorhabditis elegans, GluCl, crystallized in complex with the endogenous neurotransmitter l-glutamate and the positive allosteric modulator ivermectin has become available (18). This structure was solved using an artificial homopentameric construct, which was shown to respond to l-glutamate only upon activation by ivermectin, and represents an active state stabilized by ivermectin binding. Interestingly, this structure shows an open-channel form similar to that of GLIC. This set of structural data provides the basis for a description of the global conformational change that is likely to represent activation/deactivation in pLGICs more generally. It should be noted, however, that the significance of the structures of the prokaryotic channels is still under debate (19–21).
A structural comparison of the A versus the R state of GLIC and ELIC suggests that a global twisting of the receptor is involved in ion-channel activation (14). This movement, which was first identified by normal-mode analysis (NMA) of a homology model of the nicotinic receptor  , has been described as a quaternary change involving the concerted opposite-direction rotation of the EC and the TM domains around the pore axis (22). This observation was confirmed subsequently by a number of computational studies based on different models of
  (23) or the crystal structure of ELIC (24), all showing that receptor twisting could be described by one or a few low-frequency (i.e., low vibrational energy) modes. Moreover, it was reported that pathological mutations associated with congenital myasthenia and autosomal dominant nocturnal frontal lobe epilepsy significantly stiffen the twisting mode in a model of
  (25). These results support the view that receptor twisting is encoded in the topology of pLGICs and is likely to play a role in activation/deactivation. However, the crystal structures of GLIC and ELIC (14–16) showed unambiguously that, in addition to twisting, significant tertiary changes in the TM domain are involved in activation, in particular the tilting of the M2 and M3 helices that is required to open the ion-conducting pore. Understanding the coupling between the twist mode and the motion of the helices in the TM domain at an atomic level of detail is essential for a full description of activation/deactivation. The primary goal of this paper is to develop a model of the coupling mechanism.
In the following, we present explicit solvent/membrane molecular dynamics (MD) simulations of GLIC, ELIC, and GluCl. The simulations of the prokaryotic homologs are used to extract progress variables for characterizing activation/deactivation whereas the time evolution of GluCl with ivermectin removed is analyzed to elucidate the conformational transition from the active state toward a closed-channel form. From this perspective, the present approach to gating is analogous in spirit to the pH-stimulated relaxation of GLIC (26), with the advantage that the perturbation introduced in the calculations (i.e., the removal of ivermectin) is structurally localized. Moreover, the presence of l-glutamate at the orthosteric site(s) slows down the relaxation of the open-channel form, which enables us to disentangle the sequence of structural events mediating ion-channel deactivation. The trajectory of GluCl in the absence of the allosteric agonist ivermectin shows that receptor twisting is followed by a series of more local movements of the M2 helices that shrink the ion pore. Based on these results, a model for the allosteric coupling between agonist unbinding (binding) at the orthosteric site and ion-pore closing (opening) is presented.
Results
Structural Criteria for the Open/Closed Transition.
The conformational dynamics of both the active (A) and resting (R) states of pLGICs were investigated by room-temperature MD simulations with an explicit membrane and water model starting from the crystal structures of the prokaryotic channels GLIC and ELIC (Materials and Methods). The small values of the Cα-rmsd over 100 ns of simulation indicate that the conformations of the prokaryotic channels are stable on this timescale (SI Appendix, Fig. S1). Therefore, the trajectories of GLIC and ELIC were used to identify structural observables (i.e., reaction coordinates) to characterize the functional state of these prokaryotic channels and of pLGICs more generally. For this purpose, a series of angles and distances were monitored during the simulations. These observables include: (i) the quaternary twist of the receptor (τ), (ii) the tilting of the pore-lining helices M2 decomposed into the polar  and azimuthal
  components, (iii) the opening of the orthosteric site at the EC subunits interface (δ), and (iv) the size of the ion pore at the constriction point (σ) (see Materials and Methods for definitions and Table 1 for results). The MD results indicate that the resting state of pLGICs (ELIC) presents a globally twisted conformation of the receptor (τ of 23°) with M2 helices that are radially straight (
 of 1.3°) but tangentially tilted (
 of −8.5°). By contrast, the active state (GLIC) populates a significantly less twisted conformation
 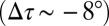 in which the M2 helices are tilted outward
  to keep the ion pore open
  Å2); here, the Δ values correspond to GLIC minus ELIC in Table 1. These conclusions are also supported by the probability distributions per subunit, which barely overlap (SI Appendix, Fig. S2). Finally, the orthosteric sites at the EC subunits interfaces are found to open wide in ELIC (δ of 19 Å) whereas they stay shut in GLIC
 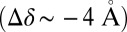 . Because δ measures the distance between pairs of residues belonging to the rigid core of adjacent subunits, which sit near the top of the principal or “+” subunit and at the bottom of the complementary or “−” subunit (SI Appendix, Fig. S3), this observation suggests that a reorientation of the β-sandwiches in the EC domain could be involved in activation/deactivation. Also, the large difference in the azimuthal tilt between GLIC and ELIC
 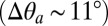 , which is almost twofold that of the polar tilt, indicates that a tangential reorientation of the M2 helices will occur at some point. As the size of the ion pore strongly correlates with the M2 polar tilting (SI Appendix, Fig. S4), the quaternary twist of the receptor (τ), both M2 tilting components
  , and the orientation of β-sandwiches in the EC domain will be used as “reaction” coordinates to characterize the conformational change involved in pLGICs activation/deactivation.
Table 1.
Structural observables for studying activation/deactivation in pLGICs
| Observable | Symbol | ELIC |
GLIC |
GluCl |
||||
| X-ray | MD | X-ray | MD | X-ray | MD | −IVM | ||
| Twist, ° | τ | 21.3 | 23.0 (1.2) | 13.8 | 15.1 (0.8) | 12.2 | 15.3 (0.8) | 20.2 (1.6) |
| M2 polar tilting, ° |  |
0.1 | 1.3 (0.4) | 6.8 | 6.8 (0.8) | 5.7 | 9.3 (0.7) | 6.6 (1.0) |
| M2 azimuthal tilting, ° |  |
−8.6 | −8.5 (0.7) | 1.9 | 2.3 (0.7) | 3.3 | 5.0 (0.7) | 3.1 (1.1) |
| Orthosteric site, Å | δ | 16.8 | 18.7 (0.6) | 14.0 | 15.1 (0.2) | 16.4 | 17.0 (0.3) | 16.9 (0.3) |
| Ion-pore size, Å2 | σ | 92.9 | 93.9 (3.0) | 143.2 | 120.9 (6.9) | 148.9 | 148.2 (7.1) | 127.2 (9.7) |
A schematic representation of the various observables is given in Fig. 2. X-ray, values measured in the crystal structures; MD, values averaged over the simulation trajectories at room temperature (SD in parentheses). For GluCl, MD corresponds to simulations with ivermectin present as in the crystal structure whereas −IVM corresponds to simulations carried out after the removal of ivermectin.
Relaxation of GluCl upon Removal of Ivermectin.
The structural (functional) observables extracted from the simulations of GLIC and ELIC were used to analyze the simulation of GluCl both in the presence and the absence of the allosteric agonist ivermectin (Materials and Methods). For this purpose, a 200-ns MD trajectory was calculated starting from the X-ray structure of the homopentameric construct with l-glutamate bound and ivermectin removed. The control simulation with ivermectin present was carried out for 100 ns. Fig. 2 compares the time series of the structural observables computed for GluCl with those obtained for GLIC and ELIC. When ivermectin is bound, the dynamics of GluCl is similar to GLIC; i.e., the ion channel is untwisted and the M2 helices stay tilted to keep the ion pore open. In sharp contrast, the simulation of GluCl with ivermectin removed shows a spontaneous conformational change initiated by the removal of the allosteric agonist. In particular, the time series of the twist angle (τ) highlights a striking transition from an open form similar to GLIC, to a fully twisted conformation similar to ELIC. The change is global and irreversible and completes in 100 ns (Fig. 2). The data show that the ion channel rapidly evolves to a partially twisted conformation (∼40 ns), which then undergoes a second transition to adopt a fully twisted ELIC-like form that is stable for the rest of the simulation. Despite the large quaternary change, the values of the polar  and azimuthal
  M2 tilting angles, which monitor the orientation of the pore-lining helices, fluctuate about their crystallographic values. However, in the absence of ivermectin, these helices are significantly more mobile and the fluctuations of the ion-pore size (σ) are almost twice those of the prokaryotic channels (Fig. 2). These results are consistent with the average room-temperature values in Table 1 that show a large increase in the twisting angle as well as shrinking of the ion pore upon removal of ivermectin; i.e., compare the average value of σ for GluCl without ivermectin (127.2 Å2) with those of GLIC (120.9 Å2) and ELIC (93.9 Å2). Additional details on the conformational dynamics of GluCl with ivermectin removed were obtained from a time-resolved analysis of the probability distributions of the M2 tilting components (SI Appendix, Fig. S2). The analysis shows that, after the first twisting transition completes (i.e., 40 ns), the M2 helices start populating a radially untilted state that is similar to that in ELIC. Because these local transitions are reversible, the ion channel remains globally open on the simulation timescale (see the time series of σ in Fig. 2). By contrast, the distributions of the azimuthal tilt show no shift or significant overlap with the resting state.
Fig. 2.

Time dependence of the structural/functional observables used for characterizing activation in pLGICs. From top to bottom, the time series of the global twist of the receptor (τ), the polar and azimuthal tilt of the M2 helices  , and the size of the ion pore (σ) are shown for the prokaryotic channels ELIC (red) and GLIC (black), and the eukaryotic GluCl with (green) and without (blue) ivermectin. Shown data points correspond to averages taken over consecutive time windows of 1 ns (i.e., 50 snapshots). On the right-hand side, a schematic representation of the various observables is given.
Analysis of the orthosteric site(s) of GluCl indicates an intermediate behavior between GLIC and ELIC (SI Appendix, Fig. S3). In particular, the probability distributions of δ show that the binding site of the endogenous agonist is in dynamic equilibrium between two forms, i.e., a closed state similar to GLIC, which is dominant, and an open state  consistent with the conformation of ELIC. Because the opening of the orthosteric site (δ) does not exhibit significant differences in the simulations of GluCl with and without ivermectin (SI Appendix, Fig. S3), this observable is not useful to characterize the relaxation of GluCl initiated by the removal of ivermectin.
In summary, the time evolution of GluCl with ivermectin removed produces a twisted conformation approaching that of ELIC, which still exhibits an open channel akin to GLIC. The twisting of the receptor results in the enhanced mobility of the pore-lining helices, which dynamically reorient in the radial direction, thus shrinking and reopening the ion pore reversibly. The orthosteric sites at the EC subunits interfaces are in equilibrium between the closed and the open conformations, whose populations are only marginally affected by the binding of ivermectin.
Allosteric Communication and Gating.
In the following, we analyze the trajectory of GluCl in the absence of ivermectin in greater detail to determine the important aspects of the conformational change at the atomic level. Specifically, we describe the local changes in the interaction pattern occurring at the EC/TM domain interfaces and correlate them with the tilting of the pore-lining helices, on the one hand, and agonist binding/unbinding at the orthosteric site, on the other.
The EC/TM domain interfaces.
The trajectory of GluCl with ivermectin removed shows a striking repositioning of the highly conserved M2–M3 loop with respect to the β1–β2 loop at the EC/TM domain interfaces. This rearrangement, here referred to as an inward displacement, involves the passage of the absolutely conserved P268 (on the M2–M3 loop) past the side chain of V45 (at the tip of the β1–β2 loop) in the direction of the ion pore (Fig. 3). The time series of the separation between the Cα atoms of V45 and P268 indicates that several transitions of the M2–M3 loop are sampled during the simulation (Fig. 3A). This analysis shows that (i) an inward displacement takes place in three of the five subunits, i.e., A, B, and D; (ii) these events are reversible, i.e., see B and D traces; and (iii) they do not occur before ∼40 ns. We note that the early increase in the V45–P268 distance observed in the B subunit at 10 ns (green dotted line in Fig. 3A) does not correspond to an inward displacement but rather to a tangential separation of the interfacial loops (SI Appendix, Fig. S5). Therefore, no inward displacement of the M2–M3 loop is observed before a global twisting of the receptor (here ∼40 ns) takes place; this sequence of events is discussed further below.
Fig. 3.

The inward displacement of the M2–M3 loop at the EC/TM domain interface is coupled to the unbinding of l-glutamate from the orthosteric site (EC) and the untilting of the M2 helices in the ion-pore region (TM). The time series of (A) the distance between the Cα carbons of V45 on the β1–β2 loop and P268 on the M2–M3 loop, (B) the Cα-rmsd of the C-loop, (C) the all-atom rmsd of l-glutamate, and (D) the polar tilting of the upper part of the M2 helix computed along the simulation of GluCl with ivermectin removed are shown in colors for the invidual subunits. The time traces corresponding to the A (red) and D (blue) subunits are given in thick lines. In the background, light red, light blue, and light green boxes mark the time span of the inward displacement of the M2–M3 loop sampled in the A, D, and B subunits, respectively. Threshold values (dashed lines) of 7 Å for the V45–P268 distance, 3 Å for the C-loop rmsd, 3 Å for the l-glutamate rmsd, and 8° for the polar tilting of the upper part of the M2 helix were used to distinguish, respectively, the out from the in position of P268, the shut from the open conformation of the C-loop, the bound from the unbound state of l-glutamate, and the untilted versus the tilted orientation of the M2 helices. At the top and the bottom of the figure, snapshots taken along the trajectory help to visualize the inward displacement of the M2–M3 loop and the untilting of M2. The β1–β2 loop, the M2–M3 loop, and the transmembrane helices M2 and M3 are color-coded in red, yellow, and cyan, respectively. Amino acid residues V45 (on the β1–β2 loop) and P268 (on the M2–M3 loop) are shown as vdW spheres. Color coding on the TM domain is used to highlight the M2 and M3 helices populating the polar untilted state, i.e., after the inward displacement of the M2–M3 loop has occurred.
The ion pore.
Because the M2 and M3 helices along with the interconnecting loop move as a whole during the simulation (SI Appendix, Fig. S6), the repositioning of the M2–M3 loop described above correlates with the reorientation of M2 in the direction of closing the ion pore. The time series of the M2 polar tilting angle  of the individual subunits shows, in fact, that the inward displacement of the M2–M3 loop always corresponds to an untilting of the M2 helix in the same subunit. For instance, the 2-Å increase in the V45–P268 distance measured between 30 and 50 ns in subunit A matches a 4° decrease in the polar tilting of M2 (SI Appendix, Fig. S7). Because the size of the ion pore and the polar tilting angle are strongly correlated (SI Appendix, Fig. S4), this result shows that the position of the strictly conserved Proline relative to the tip of the β1–β2 loop at the EC/TM domain interfaces (Fig. 3, Top) controls the opening/closing of the ion pore via the polar untilting of M2. Indeed, when the out position of P268 is stabilized (V45–P268 distance below 7 Å), the tilting of M2 is typical of an open-channel form; i.e., compare the value of the M2 polar tilting angle in subunit A averaged over the first 40 ns (6.2°) with those measured in GLIC (6.8°) and GluCl with ivermectin present (9.3°) over 100 ns. By contrast, when P268 moves in (V45–P268 distance above 7 Å), the polar tilting of M2 approaches that of a closed-channel form; i.e., compare the average
  between 40 and 120 ns in subunit A (3.2°) with that of ELIC (1.3°). The coupling between the relative position of the β1–β2 and M2–M3 interfacial loops and the opening of the ion pore provides a structural communication pathway for the allosteric regulation of ion-channel conductance.
A detailed analysis of the simulation trajectory shows that the polar untilting of M2 is realized through the coordinated unbending of the M2 and M3 helices (Fig. 4). Snapshots taken before and after the inward displacement of the M2–M3 loop (Fig. 4) along with the identification of two hinge regions, one located in the middle of M3 and one in the upper part of M2 (SI Appendix, Fig. S8), support this conclusion (see SI Appendix, Ion-Pore Closing for details). Because this tertiary change results in the repositioning of the side chain of A258 at the constriction point, the bending/unbending of the M2–M3 group couples the horizontal displacement of the M2–M3 loop to the opening/closing of the ion pore. Consistently, the polar tilting of the upper part of the M2 helix (residues 258–265), rather than that of the full-length helix, was found to maximize the signal-to-noise ratio on monitoring the tilting of the pore-lining helices (SI Appendix, Fig. S7). In addition, by focusing on the dynamics of the upper part of M2, we find that (i) a threshold of 8° in the polar tilting angle clearly distinguishes the polar tilted state from the polar untilted state of M2 in all subunits and (ii) the polar tilting of the upper part of M2 is strongly correlated in time with the inward displacement of the M2–M3 loop. These results indicate that P268 at the EC/TM interface controls the opening/closing of the ion pore in GluCl by stabilizing the bent conformation of the M2–M3 group (open channel) when it is in the out position and driving its unbending (closed channel) when it moves in. Provided that the upper portions of M2 and M3 are structurally coupled, the simulations suggest that the bending/unbending of the M2–M3 group is key to establishing the allosteric communication between the ion pore and the elements at the EC/TM domain interfaces. We note that helix M2 of subunit B is found to visit the polar untilted state in the early stages of the simulation (first 30 ns) without a corresponding displacement of the M2–M3 loop (Fig. 3, green traces). Visual inspection of the trajectory has shown that the large tangential separation of the interfacial loops occurring in this subunit (SI Appendix, Fig. S5) temporarily disengages P268 from V45, which uncouples the orientation of M2 from the position of the β1–β2 loop.
Fig. 4.

The unbending of the M2–M3 group couples the inward displacement of the M2–M3 loop at the EC/TM domain interface to the closing of the ion pore. Snapshots of the M2–M3 group taken before (1 ns) and after (50 ns) the inward displacement of the M2–M3 loop in the A subunit are shown as white and red ribbons, respectively. The side chains of P268 on the M2–M3 loop and A258 on M2 at the constriction point of the ion pore are highlighted by vdW and sticks representations, respectively. The position of the M284 and T285 residues that form a stable kink in the middle of M3 and structurally separates the M2–M3 group into upper and lower regions is also indicated. The comparison shows that the polar untilting of the M2 helices, which couples the repositioning of the interfacial loops to the closing of the channel, is realized through the coordinated unbending of the M2 and M3 helices (see blue arrow). Molecular snapshots are shown after optimal superimposition of the Cα atoms of the TM domain of the pentamer to project out structural changes introduced by twisting of the pLGIC.
The orthosteric neurotransmitter site.
The allosteric mechanism proposed here for ion gating in pLGICs requires that there is a correlation between the inward/outward displacement of the M2–M3 loop and agonist binding/unbinding at the orthosteric site. To search for this correlation, the time evolution of the orthosteric site(s) of GluCl with ivermectin removed was examined by measuring the rmsd from the X-ray structure of both l-glutamate (i.e., the endogenous agonist) and the C-loop after optimal superposition of the core of the EC domain; the former quantifies the displacement of the agonist from its active binding mode whereas the latter measures the opening of the binding-site lid. The starting configuration of the agonist-binding site in the simulations was that of the X-ray structure of GluCl, in which l-glutamate binding is stabilized by salt-bridge interactions with residues on the (−) subunit (R37 and R56), H-bonds and van der Waals (vdW) contacts with residues on the (+) subunit (S150 and Y151), and a cation–π interaction with Y200 on the C-loop, as described by Hibbs and Gouaux (18) (see SI Appendix, Fig. S9 for a pictorial representation). The analysis shows that the inward displacement of the M2–M3 loop is sampled only in subunits with an open C-loop (A, B, and D) (Fig. 3B). However, no direct correlation was found between agonist unbinding from the orthosteric site and the inward displacement of the M2–M3 loop (see “nonproductive” unbinding events in Fig. 3C sampled at 10 ns from the D/E interface and 40 ns from the E/A interface). Perhaps surprisingly, the latter suggests that agonist unbinding is not sufficient to elicit ion-pore closure; note that by agonist unbinding we refer here to motional fluctuations of the ligand in the binding pocket that result in a change of its binding mode rather than full dissociation of the ligand, which did not occur.
To provide an interpretation for these observations, a detailed analysis of the agonist/receptor interactions was carried out over the simulation trajectory. Specifically, the time series of the binding contacts visualized by the X-ray structure of GluCl were monitored over time and compared. In the following, the results of the analysis are summarized; details are given in SI Appendix, Agonist Binding Contacts in GluCl.
At the C/D interface, l-glutamate stays bound to the orthosteric site during the entire simulation, and the C-loop is shut over the agonist. Although the ligand visits an alternative binding mode between 40 and 170 ns (SI Appendix, Fig. S9), the salt-bridge interactions with R37 and R56 on the (−) subunit as well as the vdW contact with Y151 on the (+) subunit are preserved. At the A/B subunit interface, by contrast, the C-loop opens rapidly (at ∼10 ns), but the agonist leaves the orthosteric site only when the vdW contacts with Y200 (C-loop) and Y151 (B-loop) on the (+) subunit are lost (at 38 ns). Thus, it appears that agonist binding at the orthosteric site is controlled by the interactions with the aromatic residues Y151 and Y200 on the (+) subunit. Also, the present analysis suggests that C-loop opening is necessary but not sufficient for agonist unbinding.
At the D/E interface, the C-loop also opens rapidly, and l-glutamate unbinds from and rebinds to the orthosteric site twice (SI Appendix, Fig. S10). Interestingly, these apparently analogous unbinding/rebinding events from the (+) subunit turn out to have rather different allosteric consequences. Whereas the first unbinding (at ∼20 ns) leaves the tertiary structure of the subunits unaltered, the second unbinding (after 80 ns) is coupled to the inward displacement of the M2–M3 loop, which controls the orientation of the pore-lining helices (see Results, The ion pore). Thus, the global twisting of the receptor, which completes in ∼40 ns and so occurs before the second unbinding from the (+) subunit, mediates the allosteric coupling between the orthosteric site and the ion pore. Although the role of twisting proposed here is based on limited sampling, i.e., two agonist “unbinding” events and one inward displacement of the M2-M3 loop, this conclusion is fully supported by the control simulation with ivermectin present (SI Appendix, Fig. S11).
The mechanism of allosteric coupling.
The results presented above show that, once the twisting of GluCl has occurred (∼40 ns), there is a correlation between the loss of agonist interaction with the (+) subunit at the orthosteric site and the inward displacement of the M2–M3 loop, which is located ∼30 Å away. Further analysis shows that a nearly rigid-body reorientation of the β-sandwiches in the EC domain is involved in the allosteric coupling. The tertiary rearrangement of the EC domain in response to agonist unbinding from the (+) subunit is illustrated in Fig. 5 based on the spontaneous transition observed in subunit A. The time series of the polar tilting of the β-sandwich (Fig. 5A) shows that, between 38 and 58 ns, the core of the subunit tilts by 7° in the direction of the M4 helix, i.e., the outward direction. Strikingly, such an outward tilting results in a large repositioning of the β1–β2 loop (∼5 Å), which moves into the up position (Fig. 5B). This rearrangement at the EC/TM domain interface facilitates the passage of the bulky side chain of P268 past V45 in the direction of the ion pore and therefore mediates the inward displacement of the M2–M3 loop; we note that a similar change is observed in subunit D between 80 and 100 ns (SI Appendix, Fig. S13). Thus, the position of the tip of the β1–β2 loop is an essential element that controls the movement of the M2–M3 loop and therefore the tilting/untilting of the M2 helices that modulate the size of the pore. Remarkably, the data in Fig. 5A show that the outward tilting of the β-sandwich in subunit A occurs at the same time (∼38 ns) as the unbinding of the endogenous agonist from the same subunit; compare the black line in Fig. 5A with the red curve in Fig. 3C. This time correlation, which is also observed in subunit D, is striking and provides evidence that the polar orientation of the β-sandwiches may be controlled by agonist binding/unbinding at the orthosteric site.
Fig. 5.

An outward tilting of the β-sandwiches in the EC domain couples the unbinding of the agonist from the (+) subunit at the orthosteric site to the repositioning of the β1–β2 loop at the EC/TM domain interface. (A) Rigid-body reorientation of the EC subunits in response to agonist unbinding as illustrated by subunit A. The time series of the polar tilting of the β-sandwich  shows that the EC portion of the subunit tilts by 7° between 38 and 58 ns (see black line). Analysis of both polar
  and azimuthal
  tilting components along the trajectory indicates that the reorientation of the β-sandwich corresponds to a polar tilting in the outward direction (see black dots). Strikingly, the time of the outward tilting matches that of l-glutamate unbinding from the A subunit (Fig. 3C). (B) Allosteric communication in the EC domain. The structural rearrangement of the EC domain is visualized by comparing snapshots taken before (at 1 ns, gray) and after (at 45 ns, colors) agonist unbinding upon optimal superposition of the TM helices. The comparison shows that the reorientation of the β-sandwich occurs in the direction of the M4 helix (i.e., outwards) and results in the repositioning of the β1–β2 loop to the up position. See also SI Appendix, Fig. S12 for a top view of the outward tilting movement.
Taken together, these results support the conclusion that a tertiary rearrangement of the EC domain, subsequent to the quaternary twist motion, is key for translating agonist unbinding into the repositioning of the M2–M3 loop at the EC/TM domain interface. Because the inward displacement of the M2–M3 loop mediates the opening of the ion pore, the present results provide a complete structural model for ion gating in GluCl.
Discussion
pLGICs are oligomeric membrane proteins that convert a chemical signal, typically a local and transient increase in the extracellular concentration of a chemical messenger, into an electrical signal that results from the opening of the ion channel. In this report, we use atomistic MD simulations of three pLGICs, the prokaryotic GLIC and ELIC and the eukaryotic GluCl in a fully solvated explicit-membrane environment, to propose structural details of ion gating in these channels. The simulations of the prokaryotic homologs, starting with their X-ray structures, produced stable trajectories for both the resting (ELIC) and the active (GLIC) states of the channel. These trajectories were analyzed to extract structural observables to be used as “reaction” coordinates for activation/deactivation. The analysis showed that (i) the quaternary twist (which alters the interaction pattern at the domain interfaces), (ii) the orientation of the β-sandwiches in the EC domain (which modulates the opening/closing of the orthosteric site), and (iii) the tilting of the pore-lining M2 helices (which correlates with the size of the ion pore at the constriction point) clearly distinguish the active from the resting state in prokaryotic pLGICs. These observables were used to analyze the structural evolution of the eukaryotic GluCl channel simulated with and without the allosteric agonist ivermectin; ivermectin is required to stabilize the active state of the receptor construct used for the X-ray structure and in the simulations. The dynamic behavior of GluCl with ivermectin present is fully consistent with that of GLIC at low pH, which is typical of an active state. In sharp contrast, the MD evolution of GluCl without ivermectin shows the early stages of the transition toward a closed channel form, which enabled us to propose a model for the allosteric mechanism of ion gating (Fig. 6). Our analysis shows that a global structural change to a fully twisted conformation similar to ELIC is the first step of the transition from the A to the R state. As pointed out previously by Taly et al. in their normal mode study of the  nicotinic receptor (22), the twist mode has a large quaternary component; in the normal mode study the subunits move relative to each other as they do in GluCl. This quaternary change is followed by primarily tertiary relaxation to reach the fully developed R state. Significant tertiary changes after the quaternary transition are in accord with what has been predicted for hemoglobin (27). Once the twisting is completed, agonist unbinding (here l-glutamate) from the orthosteric site results in a large reorientation or tilting of the extracellular β-sandwiches in the outward direction, which drags the β1–β2 loop into the up position. This rearrangement at the EC/TM domain interface facilitates the displacement of the M2–M3 loop toward the ion pore, which involves the sliding of the strictly conserved bulky residue P268 (on the M2–M3 loop) past the side chain of V45 (on the β1–β2 loop). Because the upper portions of the M2 and M3 helices along with the interconnecting loop containing P268 move as a whole, the inward displacement of the M2–M3 loop drives the unbending of the M2–M3 group, which results in an outward-to-inward reorientation (polar untilting) of the pore-lining helices M2. The latter leads to the repositioning of the side chain of A258 at the constriction point, which shrinks the ion pore. This mechanism provides the structural details of the gating reaction initiated by orthosteric agonist unbinding. We note that a similar repositioning of the β1–β2 and M2–M3 loops at the EC/TM domain interface is observed when comparing the crystal structures of GLIC and ELIC (28). Also, the tertiary changes observed in helix M2 during closing are consistent with recent site-directed spin labeling and EPR measurements of GLIC (29). Finally, the spontaneous closing of the ion channel in response to the repositioning of the β1–β2 loop at the EC/TM interface is consistent with a recent free-energy simulation analysis of the gating transition of the GLIC transmembrane domain (30).
Fig. 6.

Model of the allosteric mechanism for gating ions in pLGICs. The simulation of GluCl with ivermectin removed shows that the closing of the ion pore involves four sequential events, here highlighted by large red numbers. The process is initiated by a global quaternary transition to a twisted conformation of the receptor (red 1). The spontaneous unbinding of l-glutamate from the orthosteric site is the next step (red 2). Agonist unbinding, which is mediated by the opening of the C-loop, results in a significant reorientation of the β-sandwiches in the EC domain that tilt in the outward direction (red 3). This rearrangement leads to the repositioning of the β1–β2 loop at the EC/TM domain interface that opens the way for the passage of the bulky side chain of P268 (on the M2–M3 loop) past V45 at the tip of the β1–β2 loop. The latter leads to an inward displacement of the M2–M3 loop, which results in an outward-to-inward untilting of the pore-lining helices to shut the ion pore (red 4). The closed ion channel produced by the repositioning of M2 is indicated by a red cross in IV. The proposed mechanism assigns a primary role to receptor twisting, which mediates the structural communication between the orthosteric site and the ion pore in pLGICs (see Results).
In our model of pore closing, the outward tilting of the β-sandwiches in the EC domain provides the structural communication pathway that couples the opening of the orthosteric neurotransmitter site to the closing of the ion pore. The rigid-body reorientation of the β-sandwiches is regulated by the binding/unbinding of the agonist at the orthosteric site, on the one hand, and it mediates the inward displacement of the M2–M3 loop by repositioning the tip of the β1–β2 loop at the EC/TM domain interface, on the other hand. When the tip is down, as in the active state, there is a steric barrier due primarily to the side chain of V45 that prevents the M2–M3 loop from moving inward and the channel remains open. Conversely, when the tip is up, the barrier is lowered and the M2–M3 loop can move in and out, thereby modulating the size of the ion pore. Based on this model, we suggest that amino acid substitutions of smaller or bulkier residues at the tip of the β1–β2 loop, which is not universally conserved among members of the pLGIC family, could accelerate or slow down the closing of the pore.
One recent model of gating based on site-directed mutagenesis and low-resolution structures of the human nicotinic acetylcholine receptor (nAchR) suggested that residue interactions at the EC/TM domain interface are key to maintaining the pore in the closed state (31). In contrast to this interpretation, the present model of gating suggests that the tip of the β1–β2 loop acts as a brake in the active state to prevent the inward movement of the M2–M3 loop in the direction of closing the ion pore. A reinterpretation of the data in ref. 31 in light of the presently available high-resolution structures of pLGICs consistently points to the model proposed here (SI Appendix, Comparison with Previous Models of Gating). Mutagenesis studies of the β1–β2 loop of GluCl would provide a direct experimental test for the proposed mechanism. As the outward tilting of the β-sandwiches is reversible even in the absence of the ligand during the simulation, our analysis supports the conclusion that agonist binding elicits an intrinsic conformational property of the ion channel, in agreement with the allosteric concept that the initial (open) and final (closed) structures are in preequilibrium (6).
An element of the allosteric mechanism described above is that the upper portions of the M2 and M3 helices and the interconnecting loop move as a unit. This coupling leads to the efficient translation of the repositioning of the EC/TM interfacial loops into opening/closing of the channel. If these transmembrane helices could reorient independently, pore closure would become independent of the position of P268 at the EC/TM domain interface and the allosteric coupling between the orthosteric site and the ion pore would be abolished. From this perspective, the structure of the recently published “locally closed” state of GLIC (32), which presents an “intermediate” structure with a closed ion pore while preserving most structural features of the active state including a shut orthosteric site and bent M3 helices, would be interpreted as an uncoupled state, perhaps compatible with fast desensitization (7).
Finally, the mechanistic scenario emerging from the simulations sheds light on the role of receptor twisting in pLGICs activation, which helps to reconcile previous computational and experimental findings. Computational studies of pLGICs based on Normal Mode analysis (22, 23) and Molecular Dynamics (24, 33) have demonstrated that global twisting is encoded in the structural topology of these ion channels and have suggested a role for this quaternary change in the gating process. These findings were refined by the structural studies at high resolution of GLIC, ELIC, and GluCl, which demonstrated that, in addition to quaternary twisting, substantial tertiary changes in the TM domain determine the opening/closing of the ion pore (14–16, 18). More recently, the structure of the locally closed state of GLIC (32), which shows a locally closed channel preserving most features of the open form, suggested that the quaternary twist and the reorientation of the pore-lining helices could be distinct events. Here, we have shown by simulation that the allosteric communication between the neurotransmitter site in the EC domain and the M2 helices in the TM domain, which is required for pore closure, is productive only when the twisting transition has occurred. From this viewpoint, the untwisted conformation of the receptor, such as that of GLIC or GluCl with ivermectin bound, would contribute to activation by “locking” the ion channel into an open-pore form, which is likely to be required for the generation of a stable ionic current. Importantly, this conclusion implies that pLGIC function can be regulated by chemical events solely affecting the global twisting of the receptor. If so, agonist binding at one or more allosteric sites, which prevents receptor twisting from the active state such as ivermectin in GluCl or cholesterol in the acetylcholine nicotinic receptor (34), would contribute to the stabilization of the open-channel conformation by uncoupling the orthosteric site from the ion pore, i.e., preventing the translation of agonist unbinding events into ion-pore closing. At the same time, orthosteric agonists that are unable to stabilize the untwisted or GLIC-like conformation of the ion channel, such as l-glutamate alone bound to GluCl (18), would result in a significantly lower interconversion barrier between the open and closed forms. This change is expected to decrease, if not abolish, ion-channel conductance independent of the binding affinity for the active state.
Conclusion
The present work describes a plausible atomistic model of the gating process for a eukaryotic chloride channel gated by glutamate. In accord with the concept that the allosteric communication emerges from the coupling between rigid-body domain motions connected by ”hinges” and specific interactions at the domains interfaces (9, 35), the results in this report present a structural framework for the allosteric coupling that regulates ion gating in GluCl. Given the similarities in both structure and dynamics with the prokaryotic channels GLIC and ELIC, this model of gating, which emphasizes the coupling between quaternary twisting and the opening/closing of the ion pore, is likely to be valid for other members of the pLGIC family. The mechanism proposed in the present study is expected to aid in the rational design of novel pharmacological agents.
Materials and Methods
Model Structures.
Atomistic models of ELIC, GLIC, and GluCl were prepared starting from crystal structures in the Protein Data Bank. The structure of ELIC at 3.3 Å resolution by Hilf and Dutzler (16) (PDB ID code 2VL0) was used as a model for the resting state. Steric clashes were reduced and hydrogen-bonding patterns optimized using the MolProbity server (36). All side-chain flips suggested for the Asn, Gln, and His residues were retained, i.e., 40 flips (SI Appendix, Table S1). We note that, although one residue (i.e., Gly164 in the β9 strand) is missing in this structure, as was recently shown by Tang and coworkers (PDB ID code 3RQU) (17), the conformation of the ion channel is only marginally affected by the local structure misalignment; i.e., the heavy-atoms rmsd between 2VL0 and 3RQU is 0.54 Å. Therefore, 2VL0 was used throughout the study.
The structure of GLIC solved at 3.3 Å resolution by Corringer and coworkers (37) (PDB ID: 3P50) was used as a model for the active state after removal of propofol from the TM domain. No side-chain flips were proposed by MolProbity. Although other structures of GLIC at low pH and in the absence of ligands were available (14, 15), the differences in conformation are marginal (i.e., heavy-atoms rmsd < 0.3 Å) and 3P50 was chosen for the study.
For the eukaryotic GluCl, the structure of the homopentameric construct by Hibbs and Gouaux (18) (PDB ID code 3RIF) solved at 3.35 Å resolution was used. When building the model, the endogenous agonist l-glutamate that binds to the EC domain at the orthosteric site was retained whereas the allosteric agonist ivermectin in the TM domain was either kept (reference simulation) or removed. All side-chain flips predicted by MolProbity (i.e., 26 flips) were introduced (SI Appendix, Table S1). Disulfide bonds between cysteine residues 130 and 144, and cysteine residues 191 and 202, were introduced in all subunits.
pKa Calculations.
The protonation state of the ionizable groups in ELIC, GLIC, and GluCl were obtained by pKa calculations carried out on the pentameric structures using the multiple-site titration approach (38). To search for a qualitatively consistent set of protonation states at a given pH (pH = 7.0 for ELIC; pH = 4.6 for GLIC, and pH = 4.5 for GluCl), standard methods based on continuum electrostatics were used (39). For that, the crystal structures of ELIC, GLIC, and GluCl with the MolProbity modifications were used (SI Appendix, Table S1). Complete atomistic models for the three ion channels were obtained using the CHARMM27 force field (40). The solvent was approximated by a continuum with dielectric constant of 80. Mobile ions in solution were represented as a Boltzmann-distributed charge density corresponding to a 150-mM solution of NaCl at 300 K. The thickness of the ion exclusion layer was set to 2.0 Å. The membrane was modeled using a 35-Å-thick low-dielectric slab centered on the TM helices. The membrane slab and protein interior were described using a dielectric constant of 4. Continuum electrostatic calculations were performed by solving the linearized Poisson–Boltzmann equation over a 3D grid with the Adaptive Poisson–Boltzmann Solver (41) through the tAPBS front-end (http://agknapp.chemie.fu-berlin.de/karlsberg).
The protonation probability of the titratable groups were obtained by Monte Carlo (MC) optimization, as implemented in the Karlsberg2 program (42, 43). pKa values, i.e., the pH corresponding to the half-protonation point, were derived from one-dimensional titration curves for each titratable site calculated by sampling the protonation probability at room temperature over a pH range from −2 to 16 by increments of 0.1 pH units. All titratable sites including the l-glutamate in GluCl and the carboxyl termini were considered. For Histidine residues, the three tautomeric forms, i.e., the imidazole Nδ1 and Nε2 neutral forms and the imidazolium charged form, were treated explicitly. Final pKa values for each residue were obtained by averaging over equivalent symmetry-related residues in the pentameric structure (SI Appendix, Table S4).
Simulation Setup.
Explicit solvent/membrane simulations for ELIC, GLIC, and GluCl were set up as follows. First, the structure of the protein with all titrable sites modeled in the most probable protonation state (see Materials and Methods, pKa Calculations) was embedded in a lipid bilayer composed of 1-palmitoyl-2-oleoyl-sn-glycero-3-phosphocholine (POPC) molecules. Initial coordinates for the lipids were obtained from an atomistic membrane model preequilibrated in the NPT ensemble at 303 K with the CHARMM36 lipid parameter set (44) available from J. Klauda’s resources webpage (http://terpconnect.umd.edu/~jbklauda/research/download.html). This model, which includes 72 POPC lipids and 2,242 water molecules, was replicated 3 × 3 along the membrane plane before protein insertion. All lipids and water molecules within 1 Å from the heavy atoms of the protein were removed, and additional water was introduced to produce a box with a solvent layer of 20 Å on both sides of the protein along the z axis. Then, an orthorombic box of 120 Å × 120 Å × 140 Å centered around the protein was extracted. The net charge of the system was neutralized by adding Na+ or Cl− counter ions and providing an excess of ions so as to match the physiological concentration of 150 mM NaCl. The solvation and ion placement steps were performed using the VMD 1.9 solvate and autoionize plug-ins, respectively. Based on this protocol, explicit solvent/membrane models for the active and resting states of pLGIC were prepared starting from the crystal structures of GLIC and ELIC, respectively. Atomistic models for GluCl with and without ivermectin were prepared from an equilibrated model of GLIC. The resulting simulation systems are (i) ELIC, which consists of 199,222 atoms (with 42,172 water molecules, 347 lipids, and 129 Na+ and 119 Cl− ions); (ii) GLIC, which consists of 202,622 atoms (with 43,325 water molecules, 347 lipids, and 122 Na+ and 147 Cl− ions); (iii) GluCl with ivermectin, which consists of 195,134 atoms (with 41,608 water molecules, 314 lipids, and 117 Na+ and 137 Cl− ions); and (iv) GluCl without ivermectin, which consists of 199,925 atoms (with 41,957 water molecules, 347 lipids, and 118 Na+ and 138 Cl− ions).
To prepare for the simulations, all systems were subjected to energy minimization using periodic boundary conditions. The all-atom CHARMM27 protein force-field [i.e., CHARMM22 (45) with CMAP corrections for backbone dihedrals (40)] and CHARMM36 lipid parameters (44) were used to model the energetics. The solvent was described using a modified TIP3P water model (46) and parameters for NaCl from Roux and coworkers (see ref. 47 and references therein). Force-field parameters for the allosteric agonist ivermectin were automatically derived making use of the CHARMM general force-field (48) version 2b7 through the CHARMM-GUI interface (49). Short-range nonbonded interactions were truncated at a 12-Å cutoff distance, and a force-switching function (50) starting at 10 Å was applied to properly scale down the van der Waals interactions at the cutoff distance (44) as no Lennard–Jones tail correction (51) was used. Long-range electrostatic interactions were accounted for by the Particle Mesh Ewald (PME) method using a grid spacing of 1 Å along with a sixth-order B-spline charge interpolation scheme. An initial 5,000 steps of energy minimization were performed at constant volume. Harmonic positional restraints with force constants of 10 and 1 kcal⋅mol−1⋅Å−2 were applied to the protein main chain and side-chain heavy atoms, respectively. The coordinates of the energy-minimized setups were used as starting structures for Molecular Dynamics simulations. All simulations were performed in the isothermal-isobaric (NPT) ensemble using the highly scalable NAMD package (52). All covalent bonds involving hydrogen atoms were constrained with the SHAKE algorithm (53). The r-RESPA multiple time step method (54) was used with a 2-fs time step for both bonded and short-range nonbonded interactions, and 4 fs for long-range electrostatic forces. The molecular systems were thermalized at 300 K over a 600-ps MD simulation by gradually increasing the temperature with random reassignment of the atomic velocities every 4 ps. Pressure control at 1 atm was achieved through the Berendsen barostat method (55) by weakly coupling the system to an external bath with a relaxation time of 400 fs and a compressibility of 4.57 × 10⁻⁵ bar−1 corresponding to liquid water. The simulation cell was allowed to fluctuate anisotropically while keeping a constant ratio between the x and y dimensions, which are parallel to the membrane plane. The systems were equilibrated at room temperature (NPT ensemble, 1 atm, 300 K) for 2 ns by gradually removing the positional restraints on the protein heavy atoms. Temperature control was achieved using a Langevin thermostat with damping coefficients equal to 1 and 0.1 ps−1 for the equilibration and production phases, respectively. Finally, sub-μs production runs were performed in the NPT ensemble at 1 atm and 300 K. Efficient trajectory handling and part of the analysis were done with the program Wordom (56).
Structural Observables.
Five structural observables were used to characterize the functional state of the pLGIC. As the observables rely on the structure of the evolutionary conserved core of these ion channels, their definition can be transposed across species. The structural definition of the core, which includes five β-strands in the EC domain and four α-helices in the TM domain, is given in SI Appendix, Table S2. A schematic representation of the various observables, which complements the definitions below, is given in Fig. 2.
Twist angle.
The twist of the ion channel, τ, was determined by averaging the angle between the projections of the center-of-mass vectors of the EC and TM regions of the individual subunits over the plane perpendicular to the symmetry axis of the receptor. To compare the numerical values obtained for the various pLGICs, which differ both in sequence and structure, only the Cα atoms of the core were considered in the calculation of τ. The direction of the principal (symmetry) axis of the receptor was obtained by 3D least-square fitting of the Cartesian coordinates of the Cα atoms.
Tilt angle.
The tilting of the pore-lining helices M2 was determined by measuring the angle between the individual helical axes and the axis of the receptor and averaging over the subunits. The axes were obtained by 3D least-square fitting of the Cartesian coordinates of the Cα atoms. The following definitions of M2 were used: residues 233–249 in ELIC, residues 227–243 in GLIC, and residues 248–264 in GluCl. In the simulation of GluCl, the polar tilting angle of the upper part of the M2 helix (i.e., residues 258–265) rather than that of the full-length helix was considered, which was found to maximize the signal-to-noise ratio due to the bending/unbending of M2 (SI Appendix, Ion-Pore Closing). The high-resolution structures of GLIC and ELIC suggest that ion-channel activation should involve not only a radial reorientation or outward tilting of the M2 helices (28) but also a tangential movement. Therefore, the tilting angle was separated into polar  and azimuthal
  components, which were analyzed separately throughout the paper. These components were determined using a reference frame centered on the center of mass of the M2 helix with the z axis parallel to the symmetry axis of the receptor and the x axis pointing outward along the radial direction. With this convention, the polar tilt is measured as the angle between the projection of the helical axis on the xz plane and the z axis, and the azimuthal tilt as the angle between the projection of the helical axis on the xy plane and the x axis.
Orthosteric site opening.
The opening of the orthosteric site of pLGICs, δ, was analyzed by measuring the distance between residues sitting near the top of the (+) subunit, which roughly correspond to the position of the C-loop, with residues located at the bottom of the (−) subunit, which are associated with the position of the F-loop (SI Appendix, Fig. S3). Because the C- and F-loops are far apart in the resting state (16, 57) and approach to bind the agonist in the active state (14, 18), their structural distance is relevant to study activation. In our analysis, δ was defined as the distance between the Cα carbons of P132 and N21 in ELIC, V132 and I25 in GLIC, and S150 and R37 in GluCl. Because these residues in GluCl (i.e., S150 and R37) form direct H-bonding interactions with l-glutamate, the value of δ is expected to correlate with the binding affinity for the agonist, i.e., the larger the distance, the wider the opening of the site and the lower the affinity for the ligand. Also, these residues belong to the structurally conserved core; significant variations in the value of δ are expected to correlate with tertiary changes in the EC domain, i.e., a rigid-body reorientation of the β-sandwiches.
Ion-pore size.
The opening of the ion pore, σ, was analyzed by using the simplified approach described in ref. 22. To this aim, the average distance between the Cα carbons sitting on adjacent M2 helices at position 13 in prime notation (58) was determined first, i.e., A243 in ELIC, A237 in GLIC, and A258 in GluCl. The value of σ was then approximated by the area of the corresponding regular pentagon whose edge was set equal to the average distance at position 13′. We note that position 13′ corresponds to the constriction point of the pore, where the difference between the crystal structures of the resting (ELIC) versus the active state (GLIC) is maximal (see figure 4 in ref. 18).
Inward displacement of the M2–M3 loop.
The distance between the Cα carbons of residues P268 (on the M2–M3 loop) and V45 (at the tip of the β1–β2 loop) in GluCl was used to analyze the inward displacement of the M2–M3 loop during the simulation of GluCl with and without ivermectin. These residues are optimally located at the interface between the EC and TM domains as they pack against each other in the active state, e.g., the X-ray structures of GLIC or GluCl, and move apart in the resting state, e.g., the X-ray structure of ELIC (28). We note, however, that this observable is unable to distinguish between inward and outward displacements of the M2–M3 loop nor separate radial from tangential repositioning of the interfacial loops, which all correspond to an increasing distance between the Cα carbons of P268 and V45. Therefore, the identification of inward-displacement events was complemented by visual inspection of the simulation trajectory.
Outward tilting of the β-sandwiches.
The orientation of the β-sandwiches in the EC domain of GluCl was analyzed by monitoring both the polar and the azimuthal tilting over time, similarly to what was done for the helices M2 (see Materials and Methods, Tilt angle). For this purpose, the axes of the β-sandwiches were determined by 3D least-square fitting of the Cα coordinates of the strands β1–β2 (residues 29–59), β3–β4 (residues 88–100), β6–β7 (residues 124–150), and β9–β10 (residues 182–210); residue numbering refers to GluCl.
Supplementary Material
Acknowledgments
We thank Adak Nasiripourdori and Sergei Krivov for contributing to the work in the early stages. This work was granted access to the High Performance Computing resources of the Centre de Calcul Recherche et Technologie/Centre Informatique National de l’Enseignement Supérieur/Institut du Développement et des Ressources en Informatique Scientifique under the allocation 2012-[076644] made by the Grand Equipement National de Calcul Intensif. We acknowledge the Partnership for Advanced Computing in Europe for awarding us access to resource SuperMUC based in Germany at the Leibniz Supercomputing Centre. Financial support from the Centre National de la Recherche Scientifique, Unité de Recherche Associée 2182 (to J.-P.C.) and from the International Center for Frontier Research in Chemistry is gratefully acknowledged.
Footnotes
The authors declare no conflict of interest.
See Commentary on page 16700.
This article contains supporting information online at www.pnas.org/lookup/suppl/doi:10.1073/pnas.1313785110/-/DCSupplemental.
References
- 1.Katz B. Nerve, Muscle, and Synapse. New York: McGraw-Hill; 1966. [Google Scholar]
- 2.Changeux J, Edelstein S. Nicotinic Acetylcholine Receptors: From Molecular Biology to Cognition. New York: Odile Jacob Publishing Corp; 2005. [Google Scholar]
- 3.Changeux JP, Devillers-Thiéry A, Chemouilli P. Acetylcholine receptor: An allosteric protein. Science. 1984;225(4668):1335–1345. doi: 10.1126/science.6382611. [DOI] [PubMed] [Google Scholar]
- 4.Changeux JP, Taly A. Nicotinic receptors, allosteric proteins and medicine. Trends Mol Med. 2008;14(3):93–102. doi: 10.1016/j.molmed.2008.01.001. [DOI] [PubMed] [Google Scholar]
- 5.Katz B, Thesleff S. A study of the desensitization produced by acetylcholine at the motor end-plate. J Physiol. 1957;138(1):63–80. doi: 10.1113/jphysiol.1957.sp005838. [DOI] [PMC free article] [PubMed] [Google Scholar]
- 6.Monod J, Wyman J, Changeux JP. On the nature of allosteric transitions: A plausible model. J Mol Biol. 1965;12:88–118. doi: 10.1016/s0022-2836(65)80285-6. [DOI] [PubMed] [Google Scholar]
- 7.Edelstein SJ, Schaad O, Henry E, Bertrand D, Changeux JP. A kinetic mechanism for nicotinic acetylcholine receptors based on multiple allosteric transitions. Biol Cybern. 1996;75(5):361–379. doi: 10.1007/s004220050302. [DOI] [PubMed] [Google Scholar]
- 8.Purohit P, Mitra A, Auerbach A. A stepwise mechanism for acetylcholine receptor channel gating. Nature. 2007;446(7138):930–933. doi: 10.1038/nature05721. [DOI] [PubMed] [Google Scholar]
- 9.Cui Q, Karplus M. Allostery and cooperativity revisited. Protein Sci. 2008;17(8):1295–1307. doi: 10.1110/ps.03259908. [DOI] [PMC free article] [PubMed] [Google Scholar]
- 10.Changeux JP. Allostery and the Monod-Wyman-Changeux model after 50 years. Annu Rev Biophys. 2012;41:103–133. doi: 10.1146/annurev-biophys-050511-102222. [DOI] [PubMed] [Google Scholar]
- 11.Tasneem A, Iyer LM, Jakobsson E, Aravind L. Identification of the prokaryotic ligand-gated ion channels and their implications for the mechanisms and origins of animal Cys-loop ion channels. Genome Biol. 2005;6(1):R4. doi: 10.1186/gb-2004-6-1-r4. [DOI] [PMC free article] [PubMed] [Google Scholar]
- 12.Bocquet N, et al. A prokaryotic proton-gated ion channel from the nicotinic acetylcholine receptor family. Nature. 2007;445(7123):116–119. doi: 10.1038/nature05371. [DOI] [PubMed] [Google Scholar]
- 13.Corringer PJ, et al. Structure and pharmacology of pentameric receptor channels: From bacteria to brain. Structure. 2012;20(6):941–956. doi: 10.1016/j.str.2012.05.003. [DOI] [PubMed] [Google Scholar]
- 14.Bocquet N, et al. X-ray structure of a pentameric ligand-gated ion channel in an apparently open conformation. Nature. 2009;457(7225):111–114. doi: 10.1038/nature07462. [DOI] [PubMed] [Google Scholar]
- 15.Hilf RJ, Dutzler R. Structure of a potentially open state of a proton-activated pentameric ligand-gated ion channel. Nature. 2009;457(7225):115–118. doi: 10.1038/nature07461. [DOI] [PubMed] [Google Scholar]
- 16.Hilf RJ, Dutzler R. X-ray structure of a prokaryotic pentameric ligand-gated ion channel. Nature. 2008;452(7185):375–379. doi: 10.1038/nature06717. [DOI] [PubMed] [Google Scholar]
- 17.Pan J, et al. Structure of the pentameric ligand-gated ion channel ELIC cocrystallized with its competitive antagonist acetylcholine. Nat Commun. 2012;3:714. doi: 10.1038/ncomms1703. [DOI] [PMC free article] [PubMed] [Google Scholar]
- 18.Hibbs RE, Gouaux E. Principles of activation and permeation in an anion-selective Cys-loop receptor. Nature. 2011;474(7349):54–60. doi: 10.1038/nature10139. [DOI] [PMC free article] [PubMed] [Google Scholar]
- 19.Parikh RB, Bali M, Akabas MH. Structure of the M2 transmembrane segment of GLIC, a prokaryotic Cys loop receptor homologue from Gloeobacter violaceus, probed by substituted cysteine accessibility. J Biol Chem. 2011;286(16):14098–14109. doi: 10.1074/jbc.M111.221895. [DOI] [PMC free article] [PubMed] [Google Scholar]
- 20.Gonzalez-Gutierrez G, et al. Mutations that stabilize the open state of the Erwinia chrisanthemi ligand-gated ion channel fail to change the conformation of the pore domain in crystals. Proc Natl Acad Sci USA. 2012;109(16):6331–6336. doi: 10.1073/pnas.1119268109. [DOI] [PMC free article] [PubMed] [Google Scholar]
- 21.Spurny R, et al. Pentameric ligand-gated ion channel ELIC is activated by GABA and modulated by benzodiazepines. Proc Natl Acad Sci USA. 2012;109(44):E3028–E3034. doi: 10.1073/pnas.1208208109. [DOI] [PMC free article] [PubMed] [Google Scholar]
- 22.Taly A, et al. Normal mode analysis suggests a quaternary twist model for the nicotinic receptor gating mechanism. Biophys J. 2005;88(6):3954–3965. doi: 10.1529/biophysj.104.050229. [DOI] [PMC free article] [PubMed] [Google Scholar]
- 23.Cheng X, Lu B, Grant B, Law RJ, McCammon JA. Channel opening motion of α7 nicotinic acetylcholine receptor as suggested by normal mode analysis. J Mol Biol. 2006;355(2):310–324. doi: 10.1016/j.jmb.2005.10.039. [DOI] [PubMed] [Google Scholar]
- 24.Cheng X, Ivanov I, Wang H, Sine SM, McCammon JA. Molecular-dynamics simulations of ELIC-a prokaryotic homologue of the nicotinic acetylcholine receptor. Biophys J. 2009;96(11):4502–4513. doi: 10.1016/j.bpj.2009.03.018. [DOI] [PMC free article] [PubMed] [Google Scholar]
- 25.Taly A, et al. Implications of the quaternary twist allosteric model for the physiology and pathology of nicotinic acetylcholine receptors. Proc Natl Acad Sci USA. 2006;103(45):16965–16970. doi: 10.1073/pnas.0607477103. [DOI] [PMC free article] [PubMed] [Google Scholar]
- 26.Nury H, et al. One-microsecond molecular dynamics simulation of channel gating in a nicotinic receptor homologue. Proc Natl Acad Sci USA. 2010;107(14):6275–6280. doi: 10.1073/pnas.1001832107. [DOI] [PMC free article] [PubMed] [Google Scholar]
- 27.Fischer S, Olsen KW, Nam K, Karplus M. Unsuspected pathway of the allosteric transition in hemoglobin. Proc Natl Acad Sci USA. 2011;108(14):5608–5613. doi: 10.1073/pnas.1011995108. [DOI] [PMC free article] [PubMed] [Google Scholar]
- 28.Hilf RJ, Dutzler R. A prokaryotic perspective on pentameric ligand-gated ion channel structure. Curr Opin Struct Biol. 2009;19(4):418–424. doi: 10.1016/j.sbi.2009.07.006. [DOI] [PubMed] [Google Scholar]
- 29.Velisetty P, Chalamalasetti SV, Chakrapani S. Conformational transitions underlying pore opening and desensitization in membrane-embedded Gloeobacter violaceus ligand-gated ion channel (GLIC) J Biol Chem. 2012;287(44):36864–36872. doi: 10.1074/jbc.M112.401067. [DOI] [PMC free article] [PubMed] [Google Scholar]
- 30.Zhu F, Hummer G. Pore opening and closing of a pentameric ligand-gated ion channel. Proc Natl Acad Sci USA. 2010;107(46):19814–19819. doi: 10.1073/pnas.1009313107. [DOI] [PMC free article] [PubMed] [Google Scholar]
- 31.Lee WY, Free CR, Sine SM. Nicotinic receptor interloop proline anchors β1-β2 and Cys loops in coupling agonist binding to channel gating. J Gen Physiol. 2008;132(2):265–278. doi: 10.1085/jgp.200810014. [DOI] [PMC free article] [PubMed] [Google Scholar]
- 32.Prevost MS, et al. A locally closed conformation of a bacterial pentameric proton-gated ion channel. Nat Struct Mol Biol. 2012;19(6):642–649. doi: 10.1038/nsmb.2307. [DOI] [PubMed] [Google Scholar]
- 33.Yi M, Tjong H, Zhou HX. Spontaneous conformational change and toxin binding in α7 acetylcholine receptor: Insight into channel activation and inhibition. Proc Natl Acad Sci USA. 2008;105(24):8280–8285. doi: 10.1073/pnas.0710530105. [DOI] [PMC free article] [PubMed] [Google Scholar]
- 34.Brannigan G, Hénin J, Law R, Eckenhoff R, Klein ML. Embedded cholesterol in the nicotinic acetylcholine receptor. Proc Natl Acad Sci USA. 2008;105(38):14418–14423. doi: 10.1073/pnas.0803029105. [DOI] [PMC free article] [PubMed] [Google Scholar]
- 35.Cecchini M, Houdusse A, Karplus M. Allosteric communication in myosin V: From small conformational changes to large directed movements. PLOS Comput Biol. 2008;4(8):e1000129. doi: 10.1371/journal.pcbi.1000129. [DOI] [PMC free article] [PubMed] [Google Scholar]
- 36.Chen VB, et al. MolProbity: All-atom structure validation for macromolecular crystallography. Acta Crystallogr D Biol Crystallogr. 2010;66(Pt 1):12–21. doi: 10.1107/S0907444909042073. [DOI] [PMC free article] [PubMed] [Google Scholar]
- 37.Nury H, et al. X-ray structures of general anaesthetics bound to a pentameric ligand-gated ion channel. Nature. 2011;469(7330):428–431. doi: 10.1038/nature09647. [DOI] [PubMed] [Google Scholar]
- 38.Bashford D, Karplus M. Multiple-site titration curves of proteins: An analysis of exact and approximate methods for their calculations. J Phys Chem. 1991;95:9556–9561. [Google Scholar]
- 39.Bashford D, Karplus M. pKa’s of ionizable groups in proteins: Atomic detail from a continuum electrostatic model. Biochemistry. 1990;29(44):10219–10225. doi: 10.1021/bi00496a010. [DOI] [PubMed] [Google Scholar]
- 40.Mackerell AD, Jr, Feig M, Brooks CL., 3rd Extending the treatment of backbone energetics in protein force fields: Limitations of gas-phase quantum mechanics in reproducing protein conformational distributions in molecular dynamics simulations. J Comput Chem. 2004;25(11):1400–1415. doi: 10.1002/jcc.20065. [DOI] [PubMed] [Google Scholar]
- 41.Baker NA, Sept D, Joseph S, Holst MJ, McCammon JA. Electrostatics of nanosystems: Application to microtubules and the ribosome. Proc Natl Acad Sci USA. 2001;98(18):10037–10041. doi: 10.1073/pnas.181342398. [DOI] [PMC free article] [PubMed] [Google Scholar]
- 42.Rabenstein B, Knapp EW. Calculated pH-dependent population and protonation of carbon-monoxy-myoglobin conformers. Biophys J. 2001;80(3):1141–1150. doi: 10.1016/S0006-3495(01)76091-2. [DOI] [PMC free article] [PubMed] [Google Scholar]
- 43.Kieseritzky G, Knapp EW. Optimizing pKa computation in proteins with pH adapted conformations. Proteins. 2008;71(3):1335–1348. doi: 10.1002/prot.21820. [DOI] [PubMed] [Google Scholar]
- 44.Klauda JB, et al. Update of the CHARMM all-atom additive force field for lipids: validation on six lipid types. J Phys Chem B. 2010;114(23):7830–7843. doi: 10.1021/jp101759q. [DOI] [PMC free article] [PubMed] [Google Scholar]
- 45.MacKerell A, Jr, et al. All-atom empirical potential for molecular modeling and dynamics studies of proteins. J Phys Chem B. 1998;102:3586–3616. doi: 10.1021/jp973084f. [DOI] [PubMed] [Google Scholar]
- 46.Durell S, Brooks B, Ben-Naim A. Solvent-induced forces between two hydrophilic groups. J Phys Chem. 1994;98:2198–2202. [Google Scholar]
- 47.Luo Y, Roux B. Simulation of osmotic pressure in concentrated aqueous salt solutions. The Journal of Physical Chemistry Letters. 2010;1:183–189. [Google Scholar]
- 48.Vanommeslaeghe K, et al. CHARMM general force field: A force field for drug-like molecules compatible with the CHARMM all-atom additive biological force fields. J Comput Chem. 2010;31(4):671–690. doi: 10.1002/jcc.21367. [DOI] [PMC free article] [PubMed] [Google Scholar]
- 49.Jo S, Kim T, Iyer VG, Im W. CHARMM-GUI: A web-based graphical user interface for CHARMM. J Comput Chem. 2008;29(11):1859–1865. doi: 10.1002/jcc.20945. [DOI] [PubMed] [Google Scholar]
- 50.Steinbach PJ, Brooks BR. New spherical-cutoff methods for long-range forces in macromolecular simulation. J Comput Chem. 1994;15:667–683. [Google Scholar]
- 51.Frenkel D, Smit B. Understanding Molecular Simulation: From Algorithms to Applications. Vol 1. New York: Academic; 2001. [Google Scholar]
- 52.Phillips JC, et al. Scalable molecular dynamics with NAMD. J Comput Chem. 2005;26(16):1781–1802. doi: 10.1002/jcc.20289. [DOI] [PMC free article] [PubMed] [Google Scholar]
- 53.Ryckaert J, Ciccotti G, Berendsen H. Numerical integration of the cartesian equations of motion of a system with constraints: Molecular dynamics of n-alkanes. J Comput Phys. 1977;23:327–341. [Google Scholar]
- 54.Tuckerman M, Berne B, Martyna G. Reversible multiple time scale molecular dynamics. J Chem Phys. 1992;97:1990. [Google Scholar]
- 55.Berendsen H, Postma J, van Gunsteren W, DiNola A, Haak J. Molecular dynamics with coupling to an external bath. J Chem Phys. 1984;81:3684–3690. [Google Scholar]
- 56.Seeber M, Cecchini M, Rao F, Settanni G, Caflisch A. Wordom: A program for efficient analysis of molecular dynamics simulations. Bioinformatics. 2007;23(19):2625–2627. doi: 10.1093/bioinformatics/btm378. [DOI] [PubMed] [Google Scholar]
- 57.Unwin N. Refined structure of the nicotinic acetylcholine receptor at 4A resolution. J Mol Biol. 2005;346(4):967–989. doi: 10.1016/j.jmb.2004.12.031. [DOI] [PubMed] [Google Scholar]
- 58.Thompson AJ, Lester HA, Lummis SC. The structural basis of function in Cys-loop receptors. Q Rev Biophys. 2010;43(4):449–499. doi: 10.1017/S0033583510000168. [DOI] [PubMed] [Google Scholar]
Associated Data
This section collects any data citations, data availability statements, or supplementary materials included in this article.