Abstract
Multispectral near-infrared (NIR) tomographic imaging has the potential to provide information about molecules absorbing light in tissue, as well as subcellular structures scattering light, based on transmission measurements. However, the choice of possible wavelengths used is crucial for the accurate separation of these parameters, as well as for diminishing crosstalk between the contributing chromophores. While multispectral systems are often restricted by the wavelengths of laser diodes available, continuous-wave broadband systems exist that have the advantage of providing broadband NIR spectroscopy data, albeit without the benefit of the temporal data. In this work, the use of large spectral NIR datasets is analyzed, and an objective function to find optimal spectral ranges (windows) is examined. The optimally identified wavelength bands derived from this method are tested using both simulations and experimental data. It is found that the proposed method achieves images as qualitatively accurate as using the full spectrum, but improves crosstalk between parameters. Additionally, the judicious use of these spectral windows reduces the amount of data needed for full spectral tomographic imaging by 50%, therefore increasing computation time dramatically.
Keywords: iomedical optics, image reconstruction, inverse problems
1 Introduction
Near-infrared (NIR) diffuse optical tomography is a noninvasive imaging technique used to obtain pathophysiological images of biological tissue. Using this technique, NIR light between wavelengths of 650 and 930 nm is injected into the external surface of tissue and the emergent light is measured along the tissue boundaries. These “boundary” data are then used with a light propagation model to predict the internal chromophore concentrations of soft tissue such as hemoglobin, oxygen saturation, and water content, as well as scattering properties.1–4 Although NIR light suffers from high scattering within tissue at these wavelengths, diffuse NIR optical imaging has shown its potential as a tool for quantifying brain function activity.5 as well as breast cancer characterization and detection.1,6–8 The issue of which spectral bands and measurement data types to use has been a point of continuous debate in the field, and our study applies the original and unique method presented by Corlu et al.9 to broadband data selection to examine which spectral windows present the unique data needed for spectral image reconstruction.
There are three common methods used for the collection of NIR transmission data: continuous wave, time domain, and frequency domain.10 Of these methods, continuous wave (cw) systems are the most cost effective and easiest to implement, where only the intensity of the emergent NIR light is measured at a given wavelength. Using cw systems, no information about the path length of NIR light within tissue is measured. Time-resolved systems are the most expensive, since they rely on photon counting systems and suffer from long data integration times,11 but can potentially provide absolute information regarding the total signal intensity as well as photon propagation time by means of measuring the temporal point spread function (TPSF). Alternatively, frequency domain systems take advantage of amplitude modulated signals to measure both the intensity and phase of the boundary data, providing information regarding the average path length of the measured photons in tissue.12 Although it has been shown that the absorption and scattering properties at a given wavelength cannot be separated using continuous wave data alone without a priori information,13 recent work in spectral imaging has shown that by using spectral constraints using cw data, it may be possible to resolve chromophore concentrations directly, using an optimum set containing a finite number of wavelengths.9 This original work by Corlu et al.9 demonstrated that by using spectral reconstruction and wavelength optimization, it is possible to overcome the nonuniqueness problem observed in cw measurements.
In this work, a method is presented to examine the viability of using large cw datasets containing many wavelengths to achieve a unique solution with minimal crosstalk between chromophores. Other tomographic studies to date have restricted spectral reconstruction to using datasets of five or six wavelengths for image reconstruction due to technical limitations.14,15 Although a set of five or six wavelengths will be computationally faster, the use of more wavelengths increases the amount of information available and is considered important in constraining the inverse problem further, such that crosstalk between chromophores can be reduced, which can be especially important for systems or wavelengths (such as 650 or 950 nm, where absorption by deoxyhemoglobin and water dominate) with higher measurement noise. The measurement of cw data over the entire range of NIR wavelengths is currently limited using most experimental systems available. The use of two or more wavelengths has been used within a time domain system,16 as well as five or six discrete wavelengths using frequency domain systems.7,11 More recently, a cw system allowing the complete spectral measurements of NIR data for small animal imaging system has also been developed,17 allowing dual modality MRI and NIR data collection for the study of small animal brain physiology. However, to date, there has been little work into the investigation of an optimum set of wavelengths to provide a unique and well-conditioned solution, under the assumption that boundary data are available at all wavelengths between 650 and 930 nm.
The methods proposed by Nielsen and Brendal18 and Corlu et al.9 are used as the basis of the presented study. Rather than restricting the image reconstruction to the best five or six wavelengths that provide a better conditioned problem, a method is proposed that finds ranges, or “windows,” of wavelengths over the entire spectrum, which contribute to producing highly conditioned and unique images.
2 Theory
For model-based image reconstruction, an accurate forward model is required that predicts the path of photons within tissue and a reliable inverse model, which gives a unique set of optical parameters based on some boundary measurements. The transport of light through tissue can accurately be described by the diffusion approximation to the radiative transport equation when the detectors are placed more than three scattering lengths away from the sources, and where light propagation is dominated by scattering events.2 For continuous wave light, the diffusion equation can be written as
| (1) |
where κ is the diffusion coefficient, κ=1/3(µa+µs′), Φ is the fluence rate, µa is the absorption coefficient, µs′, is the reduced scattering coefficient, µs′, = µs(1 – g), where µs is the transport scatter and g is the anisotropic factor (set as 0.9 for soft tissue), and q is an isotropic source modeled as one scattering distance inside (1/µs′) the external boundary.
Given a set of optical parameters, the diffusion equation can be used to calculate light distribution within a domain and hence the boundary data. For complex geometries, the diffusion equation is difficult to solve analytically, so numerical solutions such as the finite element method (FEM 1 can be used as a flexible approach to the forward problem.1
To solve the forward problem, the distribution of the optical parameters µa and κ must be known. However, a multi-spectral model can relate the wavelength dependence of the optical parameters with concentrations of oxygenated hemoglobin (HbO2), deoxygenated hemoglobin (Hb), water (H2O) fraction, and scattering properties.3,9 The absorption coefficient can be calculated from the chromophore concentrations (c) and published extinction coefficients (ε).19 From Beer’s law, the absorption at a given wavelength is given by a linear summation of the contributions from each absorber, which has a known extinction spectra, and the concentration c is to be estimated from the absorption spectra,
| (2) |
Here, N is the number of chromophores and i is the wavelength number.20 The reduced scattering parameter is given by the empirical formula, given by
| (3) |
where A is the scattering amplitude and b is the scattering power.4
The inverse problem has the aim of recovering the distribution of optical parameters in tissue given a set of boundary data at a given wavelength. This is achieved by reducing the difference between the measured data ΦM and the calculated data (from the forward model) Φc. The image reconstruction algorithm minimizes this objective function,
| (4) |
where µ is the optical parameters to be reconstructed and NM is the number of measurements. Ω is known as the projection error and gives a value with which the convergence of the inverse model can be determined. However, the inverse problem is nonlinear and illposed due to the large number of unknowns. Assuming that the initial estimate of the optical properties is close to the actual optical properties, this inverse problem can be linearized by minimizing Eq. (4) with respect to the optical parameters and only keeping the first-order terms. This gives the iterative equation
| (5) |
Here, δµ is the update optical parameter vector, δΦ is the update data vector, and λ is the regularization parameter scaled by the maximum of the diagonal of the Hessian (JTJ) and reduced systematically at each iteration. J is the Jacobian matrix that relates the change in data to a change in optical parameters. In this work, Eq. (5) is solved iteratively until the projection error dose is reduced up to 0.2%, compared to the previous iteration.
For a multispectral model, the image reconstruction is also an iterative problem and a modified version of Eq. (5) is used. However for multispectral reconstruction, the Jacobian is a matrix consisting of a number of measurements by a number of wavelength rows and number of FEM nodes by number of chromophores columns.14 Therefore by dimensionality, the update data vector has a length of NM by number of wavelengths, leading to the update vector δµ corresponding to the total number of unknowns.
It has been shown that continuous wave measurements can result in identical data for different sets of optical parameters due to crosstalk between absorption and scattering. But the correct wavelength selection in a multispectra model can reduce the effect of this uniqueness problem.13 by directly reconstructing for the chromophore and scattering properties. Algorithms have been suggested that extend the image reconstruction process by choosing sets of optimized finite wavelengths for a continuous wave system13 to reduce the nonuniqueness from image reconstruction and reduce the crosstalk between the chromophores. A further criteria has also been suggested that considers the error in the assumed extinction coefficients of the chromophores and examines its role in the optimized wavelength set.18 However, these methods have been limited to small and finite wavelength sets (typically five wavelengths), restricting its use for modified systems where larger wavelength sets may be available, and hence allowing a better conditioning of the inverse problem.
Since different sets of optical parameters have been shown to give identical cw data due to crosstalk between absorption and scattering, the nonuniqueness concept for cw measurements,13 proposes that by solving a matrix expression that considers the spectral response of the chromophores directly, the ranges of wavelengths that provide unique measurement data can be found using:
| (6) |
where R is the figure of merit or norm of the residual that determines the uniqueness of this matrix problem, and E is the extinction coefficient matrix normalized by the wavelength given by
| (7) |
where i is the number of chromophores and j is the total number of wavelengths considered in the image reconstruction. By the definition of Eq. (6), if two or more sets of parameters lead to the same solution, the inverse problem has a nonunique solution and the residual R will be zero. Using this criterion, the inverse problem therefore has a unique solution if the residual is large. To achieve the uniqueness criteria as given by Eq. (6), if these three chromophores and the scattering amplitude are allowed to vary, then it has been suggested for cw data that at least four wavelengths must be used within a spectral model.9 For this analysis and the work presented, the scattering power b is kept as a constant throughout the problem. This is because the separability of scatter power from other parameters is poor, and the crosstalk between chromophores is high using continuous wave data alone.9
The inverse problem must also be able to distinguish between chromophores, such that each chromophore has an equal contribution to the total measured absorption that can be derived from expressing Eq. (2) in matrix form,
| (8) |
if the extinction coefficient matrix [first term on right hand side of Eq. (8)] has similar singular values, the condition number of the matrix is also small and each chromophore would contribute equally to the absorption.
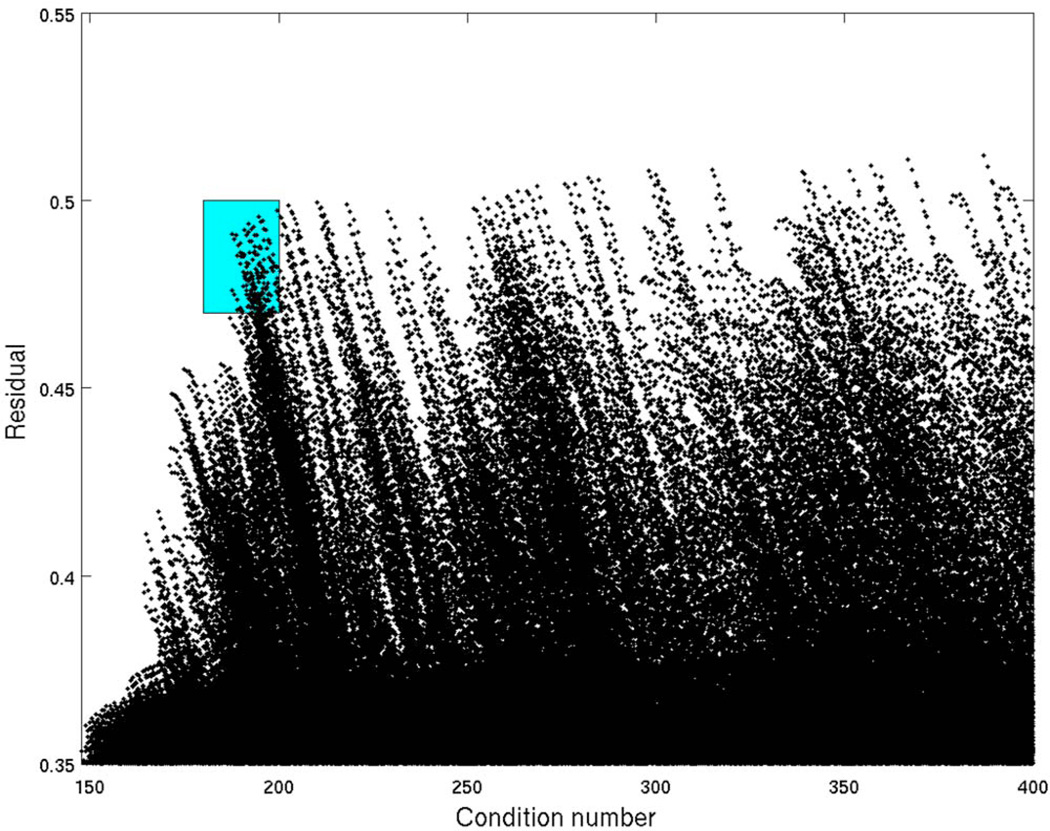
Assuming that only six discrete wavelengths can be measured from the entire spectral range of 650 to 930 nm, with a separation of 4 nm (from a complete set of 71 wavelengths), there exists 1.4 × 10⁸ combinations of six wavelengths sets. Each set has a condition number and associated residual calculated using published values of extinction and scattering coefficients20. In this work, three chromophores have been assumed to vary (hemoglobin, oxyhemoglobin, and water) as well as the scatter amplitude, while scatter power is held constant and is equal to 1. A scatter plot of the calculated residual and condition number for each of these 1.4 × 10⁸ combination six wavelength sets have been calculated and are shown in Fig. 1. Due to the large number of points, the results shown are limited to those sets with a residual above 0.35 and a condition number below 400. The sets of wavelengths of interest that provide the most adequate information about the problems are those in the proximity of the top left-hand corner (as highlighted by the shaded region in Fig. 1), as these contain the sets that have the highest residual and lowest condition number.
Fig. 1.
Scatter plot of the residual and condition number calculated for three chromophores, hemoglobin, deoxyhemoglobin, and water. Each point represents a different combination set of six wavelengths from the spectra 650 to 930 nm with 4-nm separation. The region highlighted satisfies the criteria of uniqueness (large residual) and chromophore separability (small condition number).
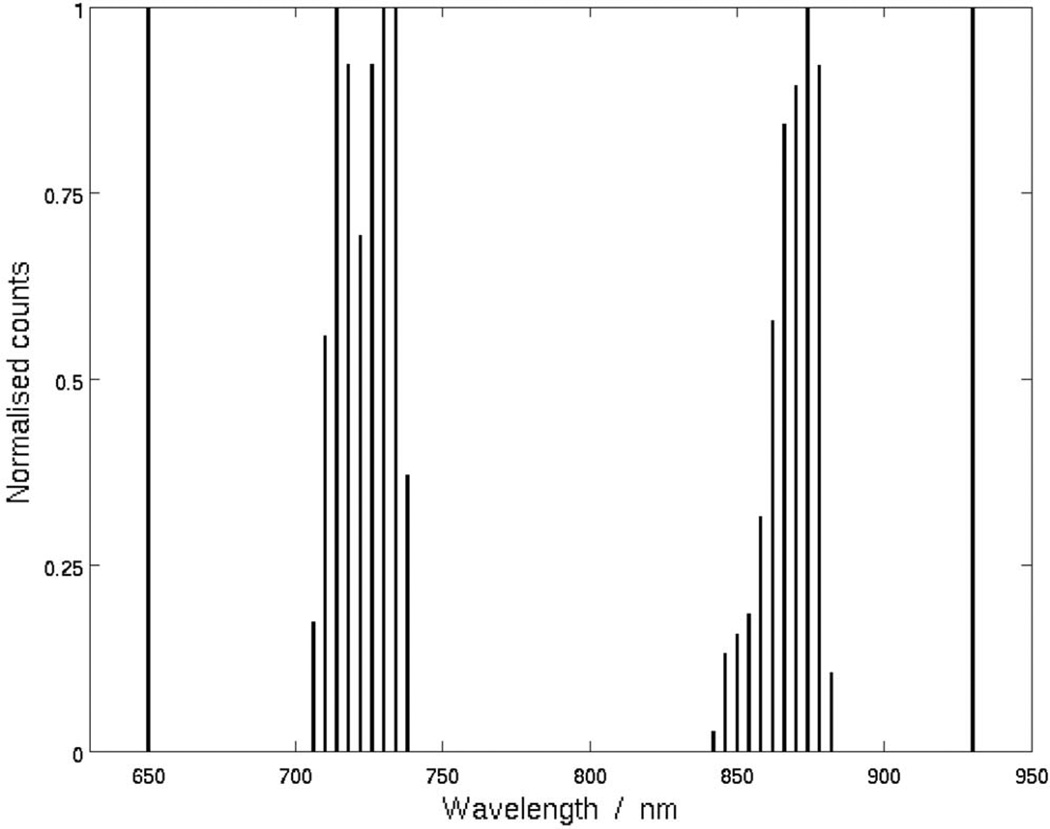
Figure 2 shows a histogram of the distribution of optimal wavelength sets with high residual (>0.47) and low condition number (<200) criteria, as taken from the region highlighted in Fig. 1 as being those that best fulfill the criteria. The histogram is formed by counting the frequency where a particular wavelength appears for each of the six wavelength choices (or bins), normalized to the most frequently appearing wave length for that specific bin. From Fig. 2, it is evident that six individual wavelengths are seen as having the highest count; however, these wavelength peaks themselves do not form the best optimized set, since it lies in the bottom right-hand corner of the highlighted region in Fig. 1. There are four clear spectral regions (or windows) that contribute to the high residual and low condition criteria, and these are distributed around 650, 736, 874, and 930 nm. This shows that the wavelengths within the optimized sets that meet the residual and condition calculation are confined to narrow spectral windows. For each optimized set, the wavelengths 650 and 930 nm are common, as there is only a single peak with a normalized count of unity due to the peak in the absorption by Hb at 650 nm and water at 930 nm. The second, third, and fourth common wavelengths are found in the region of 706 to 738 nm, while the fifth most common is taken from the region 846 to 882 nm. However, it is important to note that increasing the number of wavelengths in a set (from six wavelengths to perhaps 10 or 12 wavelengths per set) does not increase the width of these bands significantly, and the trends are similar.9
Fig. 2.
Histogram of optimized wavelength sets that satisfy the high residual and low condition number criteria for three varying chromophores. Each wavelength count is normalized to the most frequent wavelength.
For a spectral model, a larger number of wavelengths confines the inverse problem by reducing the ill-posed nature. Taking all the wavelengths within the spectra 650 to 930 nm with a separation of 4 nm, a residual of 2 and a condition number of 246 is calculated. The condition number is comparable to each optimized set of six wavelengths, but the residual is approximately four times higher, implying that using 71 wavelengths for the inverse problem could give a better solution. However, increasing the amount of data also increases the size of the Jacobian, and thus the memory requirements and the computation time.
A large wavelength set can also be derived from the histogram in Fig. 2. Each of the wavelengths within the histogram contributes to a small condition number or a large residual within the optimized sets. Due to computational limits, it is difficult to find optimized 10, 15, or 40 wavelength sets without increasing the step size dramatically (to 10 or 20 nm), which will inevitably reduce the spectral resolution from the absorption spectrum. Instead, by taking each wavelength that contributes to the residual and condition criteria, as shown in the histogram of Fig. 2, a wavelength set using windows of the spectrum can be formed. This set, in this instance, consists of 21 wavelengths, but importantly is only 28% of the size of the original full spectrum considered. The condition number is comparable to each of the other wavelength sets, as shown by Table 1.
Table 1.
Residual, average residual (for the number of wavelength used), and condition number for corresponding wavelength sets.
| Wavelength selection |
Condition number |
Residual | Average residual |
|---|---|---|---|
| Full spectrum | 246 | 2.0 | 0.028 |
| Windows method | 195 | 1.1 | 0.044 |
| Six wavelengths | 200 | 0.47 | 0.078 |
3 Methods and Results
To compare the effects of wavelength selection, simulations were performed using a simulated tissue region. Using a known and defined numerical model has the benefit that the target locations and values are known exactly, allowing accurate analysis of the reconstructed images, and also allowing the effects of the wavelength selection to be investigated exactly. The simulated 2-D region consisted of a uniform circular mesh of radius 43 mm with 1785 nodes corresponding to 3418 linear triangular elements. 16 optical fibers placed equidistant from the center of the mesh were used for the data collection of amplitude with a modulation frequency of 100 MHz. Random noise of either 1, 5, or 10% is then added systematically to the cw intensity-only data. The background had scattering amplitude equal to 1 mm−1, water content of 40%, deoxygenated hemoglobin concentration of 0.01 mM, and oxygenated hemoglobin concentration of 0.01 mM. Four circular anomalies of radius 7.5 mm are placed within the model in separate individual locations within the mesh, as shown in Fig. 3 (left-hand column). Within each anomaly, only one parameter was changed, corresponding to either scattering amplitude of 0.5 mm−1, water content of 80%, deoxygenated hemoglobin concentration of 0.02 mM, or oxygenated hemoglobin concentration of 0.02 mM. The scatter power was set as a constant throughout the entire phantom at 1.0. To reduce the number of unknown parameters, a region mapping algorithm was used to transform the Jacobian from a nodal basis to a region basis.21 In this case, by using. “hard a priori” and reconstructing the values only for the regions, the differences in the reconstructed images will be due to the different selection of wavelengths alone and not due to the inverse problem. A transformation matrix k that has dimensions of a number of unknowns (number of FEM nodes times number of chromophores) by a number of regions by a number of chromophores is applied to the Jacobian such that,
| (9) |
This transformation sums all parameters of a given chromophore in a given region together. The equation to be solved is then
| (10) |
where premultiplying the update equation with k transforms the update vector back into a nodal basis. The Hessian J̃TJ̃ was then much smaller (number of regions by number of reconstructed chromophores) which in this case is 20 (five regions and four chromophores).
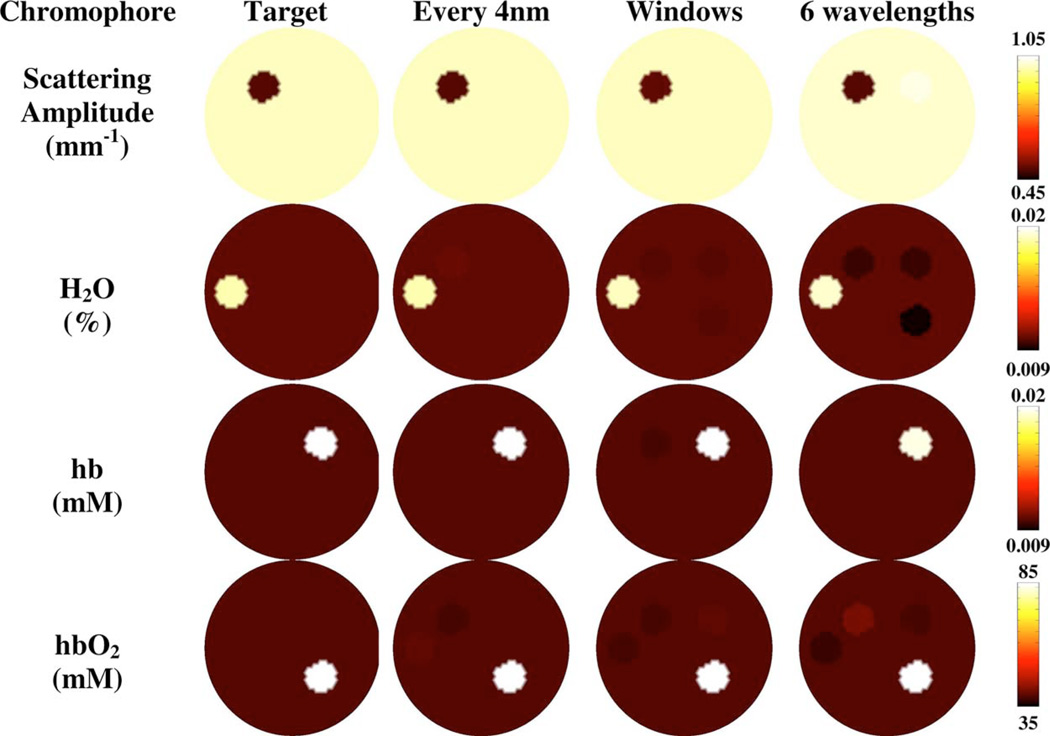
Fig. 3.
Region-based spectral reconstruction of scattering amplitude, water, deoxyhemoglobin, and oxyhemoglobin using three different wavelength selections; the full spectrum (650 to 930 nm), denoted by every 4 nm, windows of wavelengths sampled from the full spectrum, and a set of six wavelengths derived from a typical measurement system. The cw data has 5% added noise.
The reconstructions were carried out using three different wavelength sets: 1. the full spectrum consisting of the range 650 to 930 nm with 4-nm separation; 2. the windows method consisting of the wavelength ranges 650 nm, 706 to 738 nm, 846 to 882 nm, and 930 nm at 4 nm separation; and 3. a set of six wavelengths determined by a current realistic system using laser diodes at 660, 734, 760, 808, 826, and 850 nm, which is clearly not an optimized set as described before, but limited by the typical availability of specific laser diodes.14
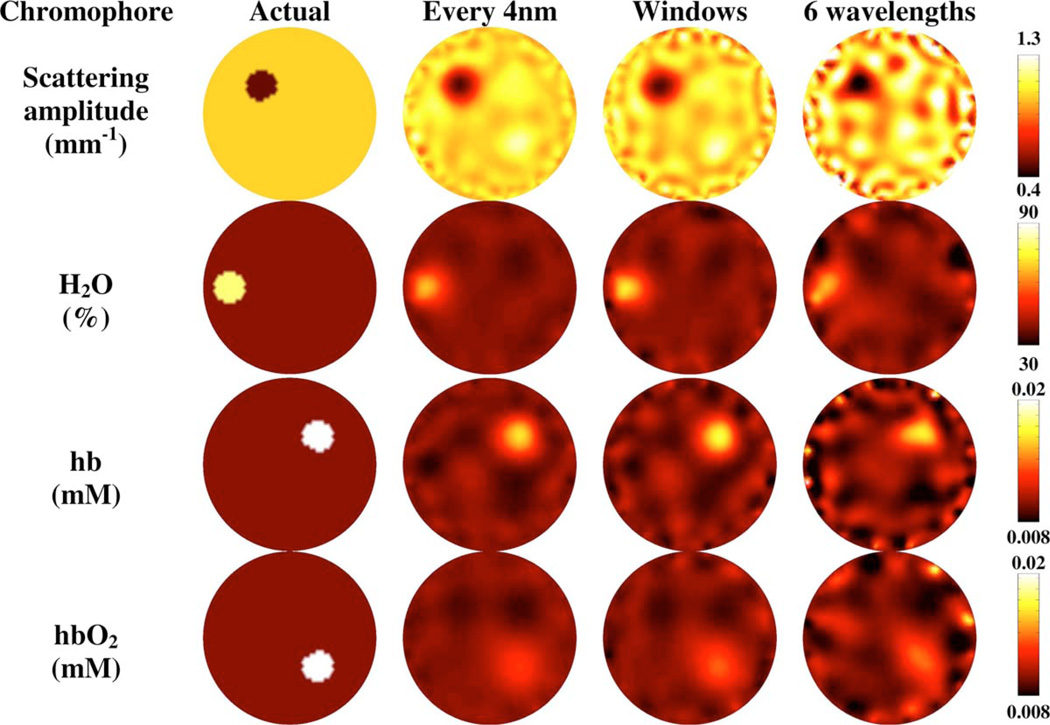
Figure 3 (columns 2, 3, and 4) shows the reconstructed images to demonstrate the crosstalk for each of the three wavelength methods for 5% added noise. Similar results are found for the crosstalk between chromophores for 1 and 10% noise (not shown). The corresponding reconstructed and target values for each image are shown in Table 2. Reconstructions were also carried out using different background values such as high oxyhemoglobin with a low target value. The results in these cases were similar to those presented here, and are not shown.
Table 2.
Reconstructed anomaly values for the four regions of interest from a simple phantom using three different wavelength selections with 1, 5, and 10% added noise. Reconstructions using the whole spectrum with a 4-nm separation (denoted by 71 wavelengths), the windows method (denoted by 21 wavelengths), and a selection of six wavelengths.
| Noise level | Number of wavelengths |
SA (mm−1) | HbO2 (mM) | Hb (mM) | H2O(%) |
|---|---|---|---|---|---|
| Target value | 0.500 | 0.0200 | 0.0200 | 80 | |
| 1% | 6 | 0.502 | 0.0202 | 0.0200 | 80.4 |
| 21 | 0.499 | 0.0199 | 0.0200 | 80.0 | |
| 71 | 0.499 | 0.0200 | 0.0196 | 79.9 | |
| 5% | 6 | 0.500 | 0.0210 | 0.0196 | 81.4 |
| 21 | 0.507 | 0.0202 | 0.0200 | 80.1 | |
| 71 | 0.502 | 0.0200 | 0.0200 | 79.8 | |
| 10% | 6 | 0.472 | 0.0198 | 0.0197 | 75.1 |
| 21 | 0.496 | 0.0186 | 0.0196 | 76.7 | |
| 71 | 0.505 | 0.0192 | 0.0200 | 78.7 |
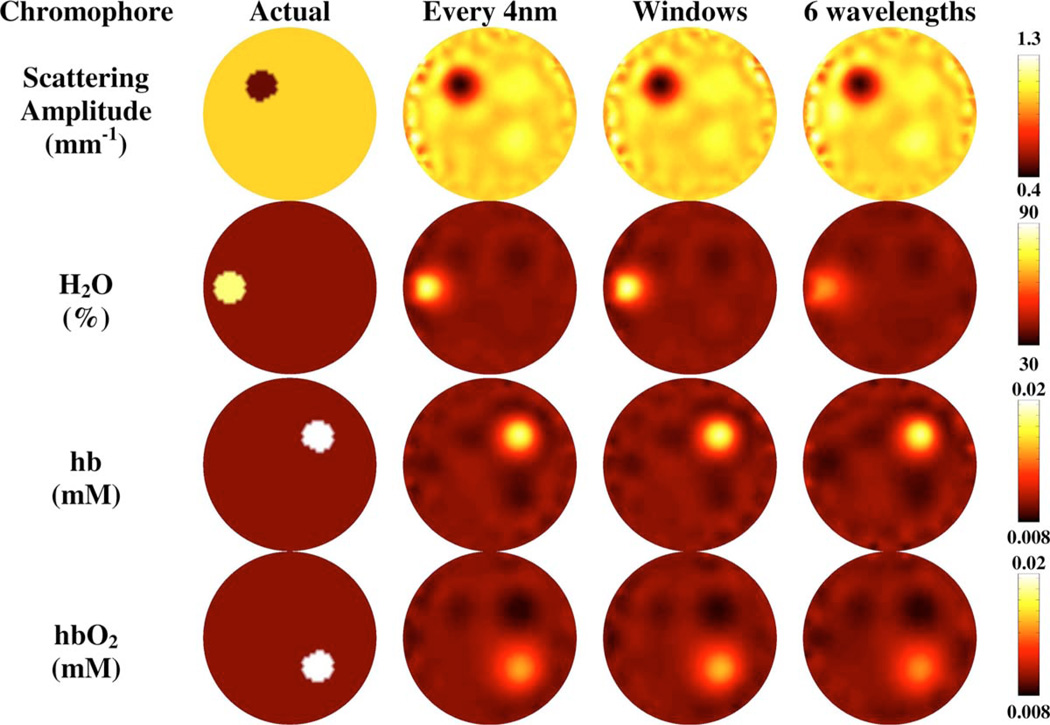
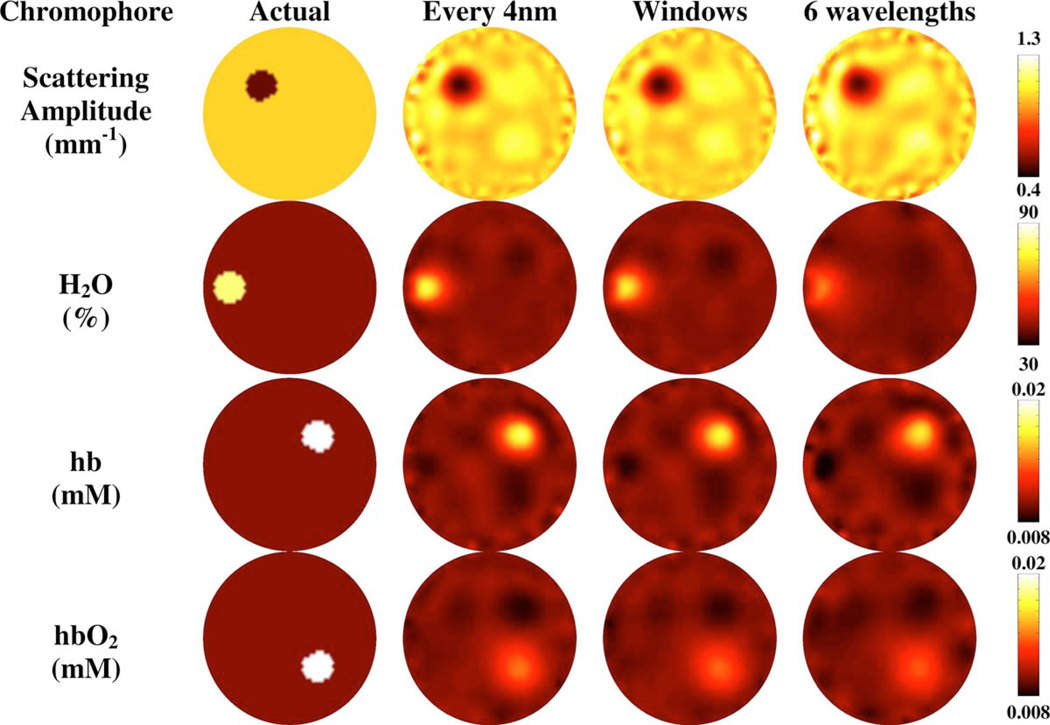
To test the robustness of the windows method, standard image reconstructions using a spectrally modified version of Eq. (5) have been carried out on the same simulated phantom as defined before, since in most real situations the exact locations of regions are not known. Reconstructions for 1, 5, and 10% added noise are shown in Figs. 4–6 respectively.
Fig. 4.
Spectral image reconstruction of scattering amplitude, water, deoxyhemoglobin and oxyhemoglobin using a simulated phantom with 1% added noise for the three wavelength selections; the full spectrum, the windows sampled from the full spectrum, and a set of six wavelengths.
Fig. 6.
Same as Fig. 4, but with 10% added noise.
To test the feasibility of the windows method for wavelength selection for an experimental system, data have been used in reconstruction of a simple gelatine-based phantom. The cylindrical tissue simulation was designed with radius 43 mm and length 88 mm. A cylindrical anomaly of radius 12.5 mm is placed 25 mm from the center. The background hemoglobin concentration is 0.011 mM, while the anomaly has hemoglobin concentration of 0.027 mM. Wavelengths between 690 and 840 nm with 5-nm separation, excluding 760 nm, were collected, giving a total of 29 wavelengths using a frequency domain system incorporated with a mode-locked Ti:sapphire laser for the source between 690- and 850-nm wavelengths, described elsewhere.22
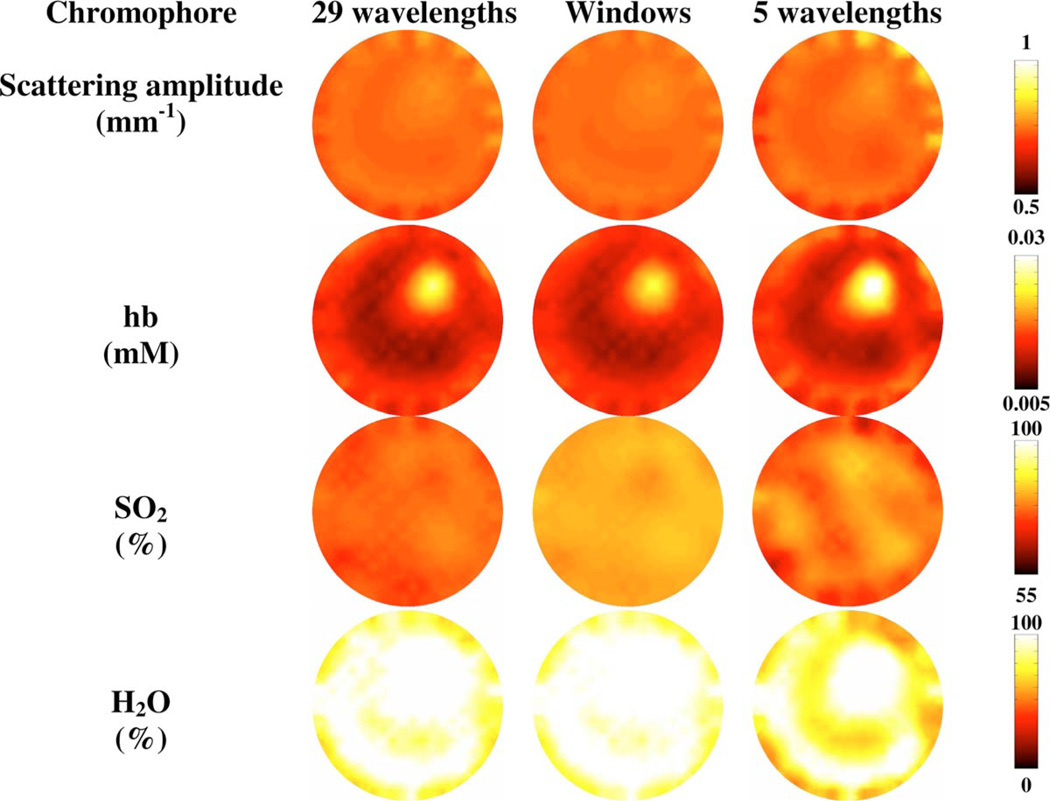
Using the same method as previously defined with the new wavelength range, windows of wavelengths of 695 nm, 715 to 735 nm, 755 nm, 765 to 770 nm, and 800 to 810 nm can be calculated as the wavelength set (12 wavelengths in total). The residual per wavelength increases from 0.0065 using the whole spectrum to 0.0122 for the windows method, while the condition number for the windows method is 654 compared to 630 using the entire available spectrum. The inverse problem is carried out on the same circular mesh as before, after appropriate data calibration,1 and Fig. 7 shows the reconstructed images with the full spectrum (695 to 840 nm), denoted by 29 wavelengths, the windows method, and a selection of five wavelengths from across the spectrum (700, 750, 800, 830, and 840 nm).
Fig. 7.
Experimental phantom images reconstructed with three different wavelength selections using cw data and reconstructing for scatter amplitude, total hemoglobin, oxygen saturation, and water.
4 Discussions
Using a numerical model and region-based image reconstruction, the use of windows-based wavelength optimization was investigated to allow a direct analysis of results without image inaccuracy due to the inverse problem. Region-based images were reconstructed using either the complete spectrum at 4-nm separation, a set of windows-based optimized wavelengths, or six defined wavelengths, as commonly available in most experimental systems, Fig. 3, and Table 2. For each method the target values were observed, and additionally, to allow a more quantitative analysis, error was also calculated by
| (11) |
where µc is the calculated parameter and µt is the target value for each region of interest, summarized by Table 3. Using region-based reconstruction, for both the windows method and the full spectrum the target values were found with an error less than 1.4%, with 5% added noise, whereas using six wavelengths the largest error was found with a maximum of 4.8%. However, the crosstalk between chromophores varied depending on the wavelength selection. Using both the windows method and the full spectrum gave the lowest crosstalk between each of the regions with the largest percentage error in the reconstruction of the background HbO2 of 0.7 and 1.5%, respectively. However, using six wavelengths gave the largest crosstalk with the reconstructed background H2O of 7%. The windows method has a much lower crosstalk at high noise in comparison to using just six wavelengths, and remains similar to the results of taking the full spectrum. As the noise increases, the qualitative accuracy attained by the reconstruction decreases for each wavelength set. However, even at 10% noise, the error in the target values for each chromophore is small for each selection of wavelengths, with a maximum error found for the reconstruction of the H2O anomaly with six wavelengths of 6.1% and the HbO2 anomaly with the windows method and the full spectrum of 6.8 and 3.9%, respectively. Importantly, the reconstructed values using the windows method are very similar to the reconstructed values found using the entire spectrum, and the crosstalk is much smaller than using the selection of six wavelengths, in Table 3. Similar results were found when reconstructing for domains with different background values (not shown). The method of selecting the optimum wavelength windows of the spectrum is entirely dependent on the number of chromophores considered, and thus the extinction coefficients of the available wavelengths. The optimum wavelengths are selected independent of the imaging volume, but since the problems of uniqueness and condition of the inverse problem have been considered objectively, the method is flexible to cope with a wide range of target and background values.
Table 3.
Calculated error (%) for the anomalous region (A) and background (BG) using two different reconstruction methods and three different wavelength selections with 5% added noise. A similar trend is seen at 1 and 10% added noise. Reconstructions using the whole spectrum with a 4-nm separation (denoted by 71 wavelengths), the windows method (denoted by 21 wavelengths), and a selection of six wavelengths.
| SA |
HbO2 |
Hb |
H2O |
|||||||
|---|---|---|---|---|---|---|---|---|---|---|
| Reconstruction method |
Noise level |
Number of wavelengths |
A | BG | A | BG | A | BG | A | BG |
| Region-based reconstruction | 5% | 6 | 0.1 | 1.1 | 4.8 | 3.1 | 1.9 | 0.5 | 1.8 | 7.0 |
| 21 | 1.4 | 0.3 | 0.9 | 1.5 | 0.2 | 0.7 | 0.7 | 1.4 | ||
| 71 | 0.4 | 0.0 | 0.1 | 0.7 | 0.1 | 0.1 | 0.3 | 0.6 | ||
| Standard reconstruction | 5% | 6 | 23.5 | 9.8 | 35.4 | 7.2 | 25.7 | 9.2 | 32.1 | 4.9 |
| 21 | 20.7 | 6.8 | 30.0 | 6.2 | 23.5 | 5.3 | 18.4 | 4.8 | ||
| 71 | 20.6 | 7.1 | 33.5 | 6.1 | 22.6 | 6.1 | 19.8 | 4.1 | ||
To evaluate the use of optimized wavelengths in a true tomographic setting, the data as used in the previous case were used to reconstruct spatially varying chromophore concentrations throughout the model (Figs. 4–6 and Table 3). With 5% added noise (Fig. 5), using the full spectrum gives errors in the reconstructed anomalies of between 20% (H2O) and 33% (HbO2). With the windows method the error ranges from 18% (H2O) to 30% (HbO2). With six wavelengths, the range in error increases to between 24% (scattering amplitude) and 35% (HbO2). The crosstalk also varied between methods. In each case the largest error was found in the background of the scattering amplitude at 7.1% using the full spectrum, 6.8% using the windows method, and 9.8% using six wavelengths. Using just six wavelengths was shown to be both quantitatively and qualitatively less accurate for all noise levels modeled, although there could be two reasons for this. First, the six wavelengths are based on a frequency modulated system currently in use for the collection of clinical data due to availability of laser diodes, and the selection is therefore not optimized. Second, the number of wavelengths is far fewer and the amount of information available is therefore limited. However, there are also computational benefits for choosing a smaller wavelength set than the full spectral range. The size of the Hessian matrix (JTJ) depends on the number of wavelengths chosen and has a computational limit dependent on the system. The size of the Hessian also has a direct impact on the computation time of the inverse problem. If the Hessian is of the size N × N, the number of calculations is a function of N3 and the memory of N2.23 The simulated phantom uses 16 sources and 15 detectors to model the data, which gives 240 measurements at each wavelength. Using the full spectrum (71 wavelengths) requires 2.3 Gb to store the Hessian matrix, whereas the windows method (21 wavelengths) requires only 203 Mb. The windows method is computationally more efficient than that of the full spectrum and more desirable due to the reduction in computation time.
Fig. 5.
Same as Fig. 4, but with 5% added noise.
To validate the results, a set of experimentally measured data from a gelatine-based phantom was used and images were reconstructed (Fig. 7). The reconstructed images using five wavelengths show an overestimate in the total amount of Hb by 30%, while the number of artifacts is also high for SO2, H2O, and scattering amplitude. This shows that a lack of information or nonoptimized wavelength sets do not give accurate results. The reconstructed images using the full spectrum have reconstructed the total Hb qualitatively well, while artifacts can be seen in the scattering amplitude. This could be because using the full spectrum in this case overconstrains the problem. The windows method reconstructed the peak in the Hb as well as reduced artifacts in the other images. Importantly, the windows method required 52 sec per iteration, while the full spectrum took 114 sec. Thus the window method is computationally more efficient.
5 Conclusions
The use of large wavelength sets in NIR imaging can help optimize the inverse problem and is especially useful for systems where the magnitude of measurement noise is large. However, a large number of wavelengths also increases the size of the computational problem and thus the memory requirement, which becomes more important for large complicated models. Using an optimized set of a small number of wavelengths is computationally more efficient, and theoretically can provide unique images using continuous wave measurements. An objective method to allow the determination of a set of optimized wavelengths, which is a function of the chromophores being imaged, was presented. Using the criteria that maximizes this residual, while maintaining a low condition for the inverse problem, the number of wavelengths needed to provide adequate information for full spectral imaging can be reduced. Reconstructed images, based on either regional image reconstruction or those with tomographic images, show that by adequate optimization, the total number of required wavelengths can be reduced by more than 50%, without loss to image quality or accuracy, but with the added advantage of reducing both data collection and image reconstruction time. More importantly, using this optimized set of wavelengths, the total error within the reconstructed images, including the crosstalk between parameters, is reduced, as compared to the case where the entire spectrum is used. This conclusion is very important, suggesting that not all wavelengths within the NIR range are beneficial for spectral tomography. Future work will include the use of path-length information to allow the inclusion of scatter power within the wavelength optimization method, which will allow reconstructed images not only of absorption-based chromophores, but also scatter-dependent changes.
Acknowledgments
This work has been sponsored by the National Cancer Institute through grants RO1CA78734 and PO1CA80139, as well as the Engineering and Physical Sciences Research Council, United Kingdom.
Contributor Information
Matthew E. Eames, University of Exeter, School of Physics, Exeter, United Kingdom
Jia Wang, Dartmouth College, School of Engineering, Hanover, New Hampshire 03755.
Brian W. Pogue, Dartmouth College, School of Engineering, Hanover, New Hampshire 03755
Hamid Dehghani, University of Exeter, School of Physics, Exeter, United Kingdom.
References
- 1.Dehghani H, Pogue BW, Poplack SP, Paulsen KD. Multiwavelength three-dimensional near-infrared tomography of the breast: initial simulation phantom and clinical results. Appl. Opt. 2003;42(1):135–145. doi: 10.1364/ao.42.000135. [DOI] [PubMed] [Google Scholar]
- 2.Arridge SR. Optical tomography in medical imaging. Inverse Probl. 1999;15(2):R41–R93. [Google Scholar]
- 3.Srinivasan S, Pogue BW, Brooksby B, Jiang S, Dehghani H, Kogel C, Poplack SP, Paulsen KD. Near-infrared characterization of breast tumors in vivo using spectrally-constrained reconstruction. Technol. Cancer Res. Treat. 2005;5(5):513–526. doi: 10.1177/153303460500400505. [DOI] [PubMed] [Google Scholar]
- 4.Wang X, Pogue BW, Jiang S, Dehghani H, Song X, Srinivasan S, Brooksby BA, Paulsen KD, Kogel C, Poplack SP, Wells WA. Image reconstruction of effective Mie scattering parameters of breast tissue in vivo with near-infrared tomography. J. Biomed. Opt. 2006;11(4):041106. doi: 10.1117/1.2342747. [DOI] [PubMed] [Google Scholar]
- 5.Zeff BW, White BR, Dehghani H, Schlaggar BL, Culver JP. Retinotopic mapping of adult human visual cortex with high-density diffuse optical tomography. Proc. Natl. Acad. Sci. U.S.A. 2007;104:12169–12174. doi: 10.1073/pnas.0611266104. [DOI] [PMC free article] [PubMed] [Google Scholar]
- 6.Gibson AP, Hebden JC, R S. Arridge, Recent advances in diffuse optical imaging. Phys. Med. Biol. 2005;50:R1–R43. doi: 10.1088/0031-9155/50/4/r01. [DOI] [PubMed] [Google Scholar]
- 7.Choe R, Corlu A, Lee K, Durduran T, Konecky SD, Grosicka-Koptyra M, Arridge SR, Czerniecki BJ, Fraker DL, DeMichele A, Chance B, Rosen MA, Yodh AG. Diffuse optical tomography of breast cancer during neoadjuvant chemotherapy: a case study with comparison to MRI. Med. Phys. 2005;32:1128–1139. doi: 10.1118/1.1869612. [DOI] [PubMed] [Google Scholar]
- 8.Srinivasan S, Pogue BW, Jiang S, Dehghani H, Kogel C, Soho S, Gibson JJ, Tosteson TD, Poplack SP, Paulsen KD. Interpreting hemoglobin and water concentration, oxygen saturation and scattering measured in vivo by near-infrared breast tomography. Proc. Natl. Acad. Sci. U.S.A. 2003;100(21):12349–12354. doi: 10.1073/pnas.2032822100. [DOI] [PMC free article] [PubMed] [Google Scholar]
- 9.Corlu A, Choe R, Durduran T, Lee K, Schweiger M, Arridge SR, Hillman EMC, Yodh AG. Diffuse optical tomography with spectral constraints and wavelength optimization. Appl. Opt. 2005;44(11):2082–2093. doi: 10.1364/ao.44.002082. [DOI] [PubMed] [Google Scholar]
- 10.Hebden JC, Arridge SR, Delpy DT. Optical imaging in medicine 1. Experimental techniques. Phys. Med. Biol. 1997;42(5):825–840. doi: 10.1088/0031-9155/42/5/007. [DOI] [PubMed] [Google Scholar]
- 11.Schmidt FEW, Fry ME, Hillman EMC, Hebden JC, Delpy DT. A 32-channel time-resolved instrument for medical optical tomography. Rev. Sci. Instrum. 2000;71(1):256–265. [Google Scholar]
- 12.McBride TO, Pogue BW, Jiang S, Osterberg UL, Paulsen KD. Development and calibration of a parallel modulated near-infrared tomography system for hemoglobin imaging in vivo. Rev. Sci. Instrum. 2001;72(3):1817–1824. [Google Scholar]
- 13.Arridge SR, Lionheart WRB. Nonuniqueness in diffusion-based optical tomography. Opt. Lett. 1998;23(11):882–884. doi: 10.1364/ol.23.000882. [DOI] [PubMed] [Google Scholar]
- 14.Brooksby B, Srinivasan S, Jiang S, Dehghani H, Pogue BW, Paulsen KD, Weaver J, Kogel C, Poplack SP. Spectral-prior information improves near-infrared diffuse tomography more than spatial-prior. Opt. Lett. 2005;30:1968–1970. doi: 10.1364/ol.30.001968. [DOI] [PubMed] [Google Scholar]
- 15.Tromberg BJ, Coquoz O, Fishkin JB, Pham T, Anderson ER, Butler J, Cahn M, Gross JD, Venugopalan V, Pham D. Noninvasive measurements of breast tissue optical properties using frequency-domain photon migration. Philos. Trans. R. Soc. London Ser. B. 1997;352:661–668. doi: 10.1098/rstb.1997.0047. [DOI] [PMC free article] [PubMed] [Google Scholar]
- 16.Hillman EMC, Hebden JC, Schweiger M, et al. Time resolved optical tomography of human forearm. Phys. Med. Biol. 2001;46:1117–1130. doi: 10.1088/0031-9155/46/4/315. [DOI] [PubMed] [Google Scholar]
- 17.Xu H, Springett R, Dehghani H, Pogue BW, Paulsen KD, Dunn JF. MRI coupled broadband near infrared tomography system for small animal brain studies. Appl. Opt. 2005;44(11):2177–2188. doi: 10.1364/ao.44.002177. [DOI] [PubMed] [Google Scholar]
- 18.Nielsen T, Brendel B. Wavelengths optimization in multi spectral diffuse optical tomography considering uncertainties in absorption spectra. Diffuse Optical Imaging of Tissue, Proc. SPIE. 2007;6629:66290A. [Google Scholar]
- 19.Prahl S. see. http://omlc.ogi.edu/spectra.
- 20.Srinivasan S, Pogue BW, Jiang S, Dehghani H, Paulsen KD. Spectrally constrained chromophore and scattering NIR tomography provides quantitative and robust reconstruction. Appl. Opt. 2005;44(10):1858–1869. doi: 10.1364/ao.44.001858. [DOI] [PubMed] [Google Scholar]
- 21.Dehghani H, Pogue BW, Jiang S, Brooksby B, Paulsen KD. Three dimensional optical tomography: Resolution in small object imaging. Appl. Opt. 2003;42(18):3117–3128. doi: 10.1364/ao.42.003117. [DOI] [PubMed] [Google Scholar]
- 22.Wang J, Davis SC, Srinivasan S, Jiang S, W Pogue B, Paulsen KD. Spectral tomography with diffuse near-infrared light: inclusion of broadband frequency-domain spectral data. J. Biomed. Opt. 2008;13(4):041305. doi: 10.1117/1.2952006. [DOI] [PMC free article] [PubMed] [Google Scholar]
- 23.Westlake JR. A Handbook of Numerical Matrix Inversion and Solution of Linear Equations. New York: John Wiley and Sons; 1968. [Google Scholar]


