

Abstract
Shared control is emerging as a likely strategy for controlling neuroprosthetic devices, in which users specify high level goals but the low-level implementation is carried out by the machine. In this context, predicting the discrete goal is necessary. Although grasping various objects is critical in determining independence in daily life of amputees, decoding of different grasp types from noninvasively recorded brain activity has not been investigated. Here we show results suggesting electroencephalography (EEG) is a feasible modality to extract information on grasp types from the user’s brain activity. We found that the information about the intended grasp increases over the grasping movement, and is significantly greater than chance up to 200 ms before movement onset.
I. Introduction
There were an estimated 40,000 upper limb amputees in the US in 2012. Highly articulated anthropomorphic neuroprostheses provide an opportunity to change amputees’ quality of life by allowing them to perform tasks independently. Advances in surgical procedures like targeted muscle reinnervation (TMR) [1] combined with pattern recognition techniques [2] have allowed classifying the electromyographic (EMG) patterns from targeted muscles to control prosthetic functions like moving the arm and basic grasping. Here we evaluate the feasibility of using electroencephalography (EEG), a noninvasive and portable technique to record brain activity at the scalp, as a source signal for controlling grasp types. This technique could potentially complement TMR by allowing TMR to focus on arm movement rather than grasp postures.
Recent studies have shown the possibility of decoding kinematic parameters of movement during individuated finger movements and simple grasping motion from electrocorticographic (ECoG) signals in humans [3], [4]. A two grasp classification was reported recently with ECoG in humans [5]. A highly discriminative feature seen in these studies is the local motor potential (LMP), which is the low-pass filtered ECoG signal. We have demonstrated the feasibility of EEG to decode continuous hand kinematics during grasping by extracting an LMP-like feature by low-pass filtering the EEG [6].
With advances in machine learning algorithms, shared control between prosthetics and the brain has become reality [7], [8]. In a shared control paradigm, we only need to determine the type of grasp intended, and the machine can implement the actual grasp. In this study, we classify five grasp types from EEG during self-initiated reach-to-grasp movements. We present results showing the evolution of classification accuracies during movements, and quantify the information gained by performing the classification.
II. Methods
A. Experiment design and Data Acquisition
Simultaneous EEG and hand kinematics were recorded from five healthy participants while they performed a grasping task. Subjects were seated with five objects (calculator, CD, espresso cup, zipper and a beer mug) arranged in front of them in a semicircle with radius 30 cm. The initial position of the hand before a grasping trial was at the center of the semicircle. An auditory cue (2 kHz tone for 100 ms) was presented at the beginning of each trial, on hearing which subjects were instructed to randomly select, reach and grasp any of the five objects. Subjects held a steady grasp until the presentation of a second auditory cue (1 kHz tone for 200 ms; 5 s after the first cue), on hearing which participants returned their hand to the initial position. One such grasping movement constituted one trial. A baseline of 7 s was allowed between consecutive trials. We chose the five objects in our study so as to sample the ‘grasping workspace’ evenly [9]. On average, subjects performed 210 trials each, over 4 or 5 blocks.
Whole head EEG was recorded using a 64 channel cap (HCGSN, EGI Inc.), amplified and digitized at 50 Hz with a resolution of 0.1 μV (Net Amps 300, EGI Inc.). Trajectories of 23 hand joint angles were recorded with a wireless data glove (CyberGlove, Immersion Inc.) at 35–70 Hz with a resolution of 0.9°.
B. Preprocessing
EEG and kinematics were resampled to 100 Hz and bandpass filtered between 0.1–1 Hz as explained in [6]. Data were further segmented into trials from −0.5 to 2.5 s with respect to movement onset, followed by baseline correction [6]. Principal Component Analysis (PCA) was then applied on the kinematics to reduce the dimension from 23 joint angles to 2 Principal Components (PCs).
Classification of EEG into one of the five object classes was performed for each time t ∈ [0 2.5]s, in two steps: 1) A prediction was made for the continuous values of the kinematic PCs. 2) This prediction was classified into one of the five discrete classes. To predict the PC trajectories, a linear model embedded within a genetic algorithm (GA) to select an optimized EEG sensor set was used [6]. Each PC was modeled as
| (1) |
where Xn[t] is the value predicted for the nth PC at time t, βi are the model parameters, Si are the EEG sensor values for the ith sensor, Δ = 200 ms is a delay parameter from EEG to kinematics to account for the cortico-spinal delay, and Ψ is the optimal set of EEG sensors selected by the GA. Model structure (determination of Ψ) was validated using a leave-one-out cross validation scheme [6], and the median of correlation coefficients across validation folds was used as an optimization metric in the GA [6]. Model parameters (βi) were set to the mean of parameter values across folds. Eq. (1) was then used to obtain PC1 and PC2 predictions for each trial.
C. Classification and Information Analysis
To classify data at each t ∈ [0 2.5]s, we maximized the conditional class probability , where Y is a categorical random variable representing the object being classified, i ∈ {1,2,3,4,5} is the class and represents data till time step tn. This expression can be cast in a recursive form using Bayes’ theorem:
| (2) |
where α is the constant of normalization and is independent of Y. The likelihood function is modeled as a normal distribution, with the parameters μn,i = E[Xn,i] and σn,i = E[(Xn,i − μn,i)2] of the distribution estimated for each time step tn and each class i from training data. A leave-one-out cross-validation scheme was used for classification validation. The prior probability for time step tn is the posterior from time tn−1, which makes the calculation recursive. Initial priors were assigned to be P(Y = i) = 1/5 for each of the five classes i. At each time step tn, the class i which maximizes is assigned as the classifier output. Confusion matrices and classification error rates are thus obtained for each time step, across all validation folds. Logarithms were used to avoid computational errors due to small numeric values of probabilities.
An information theoretic measure to quantify information gained from the classifier is the mutual information between the true class Z and predicted class Y.
| (3) |
where P(Y|Z) is available as the suitably normalized confusion matrix at each time step. Eq. 3 was used to compute mutual information contained in the confusion matrix at all time steps, for all participants. The distribution of trials performed by each subject was bootstrapped 1000 times to obtain bootstrapped confusion matrices, error rates and information scores. 95% confidence bounds on these indices were obtained from the bootstrapped distributions.
III. Results
Fig. 1(a) shows the mean PC1 trajectories of subject S1 for all objects. An example of the recursive Bayesian calculation (Eq. (1)) is shown in Fig. 1(b). Notably, the Bayesian classifier performs accurately 0.8 s into the trial, when the test trajectory is correctly classified as an espresso cup even though it is closer to the mean trajectory of a beer mug (Fig. 1).
Fig. 1.
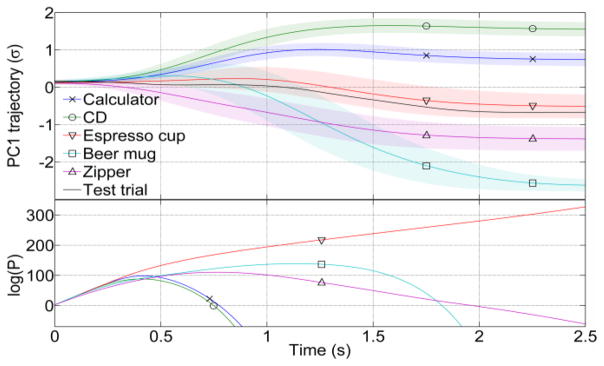
PC1 kinematics and class probability evolution. The top panel shows mean trajectories ± std. deviation (shaded regions) for PC1 trajectories for participant S1. Also shown in black is an example trial for grasping an espresso cup. The bottom panel shows the evolution of class probabilities predicted from EEG for this trial. Class probabilities are close from movement onset (0 s) till 0.5 s, after which the highest class probability is that for the espresso cup. The advantage of using a recursive Bayesian method is seen here: at 0.8 s, the test trajectory is closer to the beer mug, but the Bayesian classifier correctly classifies it an as espresso cup.
Fig. 1(b) suggests that the classification accuracy across folds should increase as the trial progresses. This is confirmed by observing that the confusion matrix becomes diagonal as the trial progresses. We expected that the errors made by the classifier would be distributed such that classes whose grasp kinematics are similar would be confused with each other more often. This was confirmed in the confusion matrices, where errors in predicting an espresso cup were highest for a zipper, as both objects require a pinch-like grasp. Likewise, the level of errors between objects requiring a whole-hand grasp, i.e. the calculator and CD, were highest compared with other objects.
The maximum information that the classifier can provide is the entropy of the prior uniform distribution of objects, which was used to normalize the mutual information and obtain an information score (Fig. 3). Across the five participants in the study, the entropy of the prior was 2.31± 0.01 bits (For a uniform distribution on five classes, the entropy is log2 5 = 2.32 bits). We calculated the information score for classifiers using PC1, PC2 and PC1-2 combined, for both predictions from EEG, and recorded kinematics, for all subjects (Fig. 3). As expected, the information score increases steadily over the trial duration, and 50% of the information is available midway through the movement. Classifier performance using both PC1 and 2 was highest, though not significantly greater than PC1 (p < 0.05). PC2 performance was the lowest. Although classification performance from EEG appeared to be lower than kinematics, we found no significant differences, indicating that the EEG extracts almost all information available about kinematics.
Fig. 3.

Evolution of classifier information. The Bayesian classifier was applied to PC1, PC2 and combined PC 1-2 trajectories, both from EEG predictions and recorded kinematics, for all subjects. The information score, which gives the percentage of maximum possible information gain due to the classifier, was calculated from the confusion matrices at each point in time (Eq. (3)). The first five graphs in the above figure show information scores for all subjects (S1 – S5), with the mean across subjects shown in the last graph. The information score steadily increases over the trial for all subjects (Movement onset at 0s). Classification with PC1 and 2 combined (red traces) results in the highest information transfer, followed by PC1 (blue traces). PC2 (green traces) had a throughput significantly lower than PC1 after the first 0.5 s. Although there was a trend for information from EEG (solid lines) to be lower than from kinematics (broken lines), there was no significant difference at p < 0.05 level. A histogram of movement end times is indicated by the shaded gray region, from which it is noticeable that 50% of the information is already available halfway through the movement (1s). The information available about grasp types is significantly greater than chance up to 200 ms before movement onset. 95% confidence intervals are indicated by shaded regions around trajectories.
To find out the common EEG electrodes being recruited to predict PC1 and PC2 trajectories, we plotted a spatial histogram of the percentage of times an EEG electrode was selected by the genetic algorithm across subjects (Fig. 4). Of interest, the scalp maps showed not only relevant contralateral EEG channels but also ipsilateral sensors. The spatial scalp maps suggest recruitment of brain areas involved in executive decision-making, primary and supplementary motor function as well as visuo-motor transformations, all of which are known to be involved in self-initiated and self-selected grasping tasks.
Fig. 4.
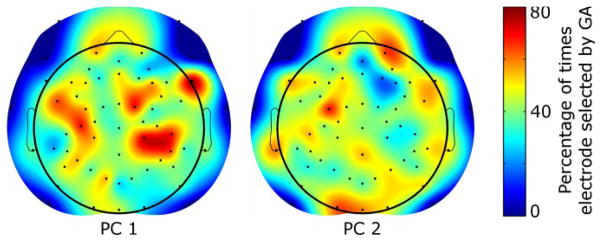
Locations of optimal EEG electrodes. The percentage of times an EEG electrode was selected for the GA to predict trajectories for PC1 (left) and PC2 (right) is shown above as a spatial distribution on the scalp. Recruitment of electrodes suggests a sparse network involving frontal, supplementary motor and motor as well as parietal cortices. Electrodes (black dots) on the periphery are set to zero to eliminate extrapolation artifacts.
IV. Discussion
Quantification of information available from EEG for classification of grasp types is critical in a shared control paradigm for brain-machine interfaces [7], [8]. We show in this study that a computationally efficient recursive Bayesian method with EEG-predicted PC1 and PC2 trajectories is close to optimal when compared with information contained in the hand kinematics (Fig. 3). Moreover, misclassifications occur between objects with similar grasp types. Information available about the intended grasp type was available up to 200 ms before movement onset. On average, 1.16 bits were available 1s into the movement, and 1.51 bits by the end of movement (2s).
Participants performed the movements in a self-selected, self-initiated manner. A large number of brain areas are known to be recruited under such conditions [10], [11]. A spatial histogram of channels recruited by the GA across subjects revealed patterns of EEG electrode selection consistent with earlier studies [5], [11].
A recent study [5] predicted from ECoG between two grasp types (precision and whole-hand) with over 90% classification accuracy. That study found that decoding accuracy peaked around movement onset, while in our study we found that it increases steadily until the end of movement. A possible explanation might be due to our use of a recursive Bayesian method, which takes into account the past information.
The genetic algorithm is computationally intensive and required 10 to15 minutes to complete (tested in MATLAB on a 2.4 GHz quad-core dual processor machine running Windows 7). However, once the decoder model was created, the time required to make predictions on unseen data was less than the time span of the data (recorded at 100 Hz), indicating applicability for real time applications.
In conclusion, we show that classification of grasp types from EEG is feasible. We propose to use the evolving prediction about the intended grasp type to inform a neuroprosthetic which selects and implements a suitable grasp trajectory. The noninvasive nature of EEG allows such an approach to be readily accepted, making the impact broader.
Fig. 2.
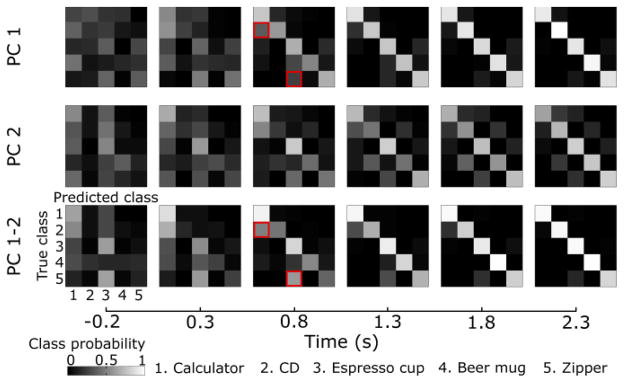
Evolution of confusion matrices. Confusion matrices were generated at each point in time with predictions of PC trajectories from EEG. Snapshots of confusion matrices are shown for classification with PC 1 (top row), PC 2 (middle row) and PC 1-2 combined (bottom row) for data from participant S1. Movement onset is at 0 s. For each matrix, the true class is along rows and the predicted class along columns. The color map represents p(predicted class = j|true class = i) for each element (i, j) of the matrix. As the trial progresses, the matrices becomes diagonal, indicating better classification performance. Moreover, the errors in classification were not random; objects requiring similar grasp types were misclassified more often with each other. A CD was often misclassified as a calculator (both objects require a whole hand grasp) and the zipper for an espresso cup (both requiring a pinch-like grasp), as marked by the red squares.
Acknowledgments
Research supported in part by NSF #IIS-1219321, R01 NS081854 and P01 HD064653-01.
Contributor Information
Harshavardhan A. Agashe, Email: hagashe@uh.edu, Noninvasive Brain-Machine Interface Systems Lab at the Department of Electrical and Computer Engineering, University of Houston (UH), Texas 77004, USA.
Jose L. Contreras-Vidal, Email: JLContreras-Vidal@uh.edu, Noninvasive Brain-Machine Interface Systems Lab at the Department of Electrical and Computer Engineering, University of Houston (UH), Texas 77004, USA. Department of biomedical Engineering at UH.
References
- 1.Kuiken TA, Li G, Lock BA, Lipschutz RD, Miller LA, Stubblefield KA, Englehart KB. Targeted muscle reinnervation for real-time myoelectric control of multifunction artificial arms. JAMA: the journal of the American Medical Association. 2009;301(6):619–628. doi: 10.1001/jama.2009.116. [DOI] [PMC free article] [PubMed] [Google Scholar]
- 2.Li G, Schultz AE, Kuiken TA. Quantifying Pattern Recognition—Based Myoelectric Control of Multifunctional Transradial Prostheses. Neural Systems and Rehabilitation Engineering, IEEE Transactions on. 2010;18(2):185–192. doi: 10.1109/TNSRE.2009.2039619. [DOI] [PMC free article] [PubMed] [Google Scholar]
- 3.Acharya S, Fifer MS, Benz HL, Crone NE, Thakor NV. Electrocorticographic amplitude predicts finger positions during slow grasping motions of the hand. Journal of neural engineering. 2010 May;7(4):046002. doi: 10.1088/1741-2560/7/4/046002. [DOI] [PMC free article] [PubMed] [Google Scholar]
- 4.Kubánek J, Miller KJ, Ojemann JG, Wolpaw JR, Schalk G. Decoding flexion of individual fingers using electrocorticographic signals in humans. Journal of neural engineering. 2009 Dec;6(6):066001. doi: 10.1088/1741-2560/6/6/066001. [DOI] [PMC free article] [PubMed] [Google Scholar]
- 5.Pistohl T, Schulze-Bonhage A, Aertsen A, Mehring C, Ball T. Decoding natural grasp types from human ECoG. NeuroImage. 2012 Jan;59(1):248–60. doi: 10.1016/j.neuroimage.2011.06.084. [DOI] [PubMed] [Google Scholar]
- 6.Agashe HA, Contreras-Vidal JL. Reconstructing hand kinematics during reach to grasp movements from electroencephalographic signals. Conference proceedings: Annual International Conference of the IEEE Engineering in Medicine and Biology Society. 2011 Jan;2011:5444–7. doi: 10.1109/IEMBS.2011.6091389. [DOI] [PubMed] [Google Scholar]
- 7.Kim HK, Biggs SJ, Schloerb DW, Carmena JM, Lebedev Ma, Nicolelis MaL, Srinivasan Ma. Continuous shared control for stabilizing reaching and grasping with brain-machine interfaces. IEEE transactions on bio-medical engineering. 2006 Jun;53(6):1164–73. doi: 10.1109/TBME.2006.870235. [DOI] [PubMed] [Google Scholar]
- 8.Lebedev MA, Nicolelis MAL. Brain-machine interfaces: past, present and future. 2006. [DOI] [PubMed] [Google Scholar]
- 9.Santello M, Flanders M, Soechting JF. Postural hand synergies for tool use. Journal of Neuroscience. 1998;18(23):10105. doi: 10.1523/JNEUROSCI.18-23-10105.1998. [DOI] [PMC free article] [PubMed] [Google Scholar]
- 10.Carmena JM, Lebedev MA, Crist RE, O’Doherty JE, Santucci DM, Dimitrov DF, Patil PG, Henriquez CS, Nicolelis MAL. Learning to control a brain-machine interface for reaching and grasping by primates. PLoS biology. 2003 Nov;1(2):E42. doi: 10.1371/journal.pbio.0000042. [DOI] [PMC free article] [PubMed] [Google Scholar]
- 11.Ball T, Schulze-Bonhage A, Aertsen A, Mehring C. Differential representation of arm movement direction in relation to cortical anatomy and function. Journal of neural engineering. 2009 Feb;6(1):016006. doi: 10.1088/1741-2560/6/1/016006. [DOI] [PubMed] [Google Scholar]