Abstract
How a seizure terminates is still under-studied and, despite its clinical importance, remains an obscure phase of seizure evolution. Recent studies of seizure-related scalp EEGs at frequencies >100 Hz suggest that neural activity, in the form of oscillations and/or neuronal network interactions, may play an important role in preictal/ictal seizure evolution [2, 31]. However, the role of high-frequency activity in seizure termination, is unknown, if it exists at all. Using information theoretic measures of network coordination, this study investigated ictal and immediate postictal neurodynamic interactions encoded in scalp EEGs from a relatively small sample of 8 patients with focal epilepsy and multiple seizures originating in temporal and/or frontal brain regions, at frequencies ≤100 Hz and >100 Hz, respectively. Despite some heterogeneity in the dynamics of these interactions, consistent patterns were also estimated. Specifically, in several seizures, linear or non-linear increase in high-frequency neuronal coordination during ictal intervals, coincided with a corresponding decrease in coordination at frequencies <100 Hz, suggesting a potential interference role of high-frequency activity, to disrupt abnormal ictal synchrony at lower frequencies. These changes in network synchrony started at least 20–30 sec prior to seizure offset, depending on the seizure duration. Opposite patterns were estimated at frequencies ≤100 Hz in several seizures. These results raise the possibility that high-frequency interference may occur in the form of progressive network coordination during the ictal interval, which continues during the postictal interval. This may be one of several possible mechanisms that facilitate seizure termination. In fact, inhibition of pairwise interactions between EEGs by other signals in their spatial neighborhood, quantified by negative interaction information, was estimated at frequencies ≤100 Hz, at least in some seizures.
Keywords: Epileptic seizure termination, High-frequency scalp EEG, Neuronal network coordination, Information theory
1. Introduction
Significant research efforts in the epilepsy community have aimed to improve our understanding of how epileptic seizures start and spread in the brain, from the cellular level to the macroscale network level. In the last several decades, many studies have focused on quantifying the electrophysiological and neurodynamic correlates of seizure initiation, with the ultimate goal to develop approaches for seizure prevention [21]. Also, a large number of studies have investigated seizure propagation, particularly its representation by source models such as the dipole, with the ultimate goal to develop spatially targeted intervention approaches for seizure arrest [24]. Despite its clinical importance, seizure termination has received significantly less attention than initiation and propagation, and remains an obscure phase of seizure evolution. Yet, its study may have a significant impact on the development of efficient interventional approaches, i.e., it may be critical to the design of treatments that induce or reproduce termination mechanisms that are triggered in self-limited seizures. Understanding seizure termination may also provide important insights into the brain’s auto-regulatory processes that allow it to return to a neurodynamic equilibrium, as well as into the postictal epoch. This latter phase is still poorly understood and is often associated with clinical symptoms, such as confusion and amnesia [27, 11]. Ictal events vary from a few seconds to several minutes, but the heterogeneity of seizure duration and distinct self-limiting mechanisms that cause seizures to stop remain elusive. There are relatively few studies that focus on seizure termination [19, 37, 25]. These have shown that once all activated neuronal pools have been synchronized during the ictal phase, neuronal firing progressively decreases and ultimately stops, for reasons not clearly understood. Recent computational studies have shown that seizure termination and decreased neural activity in the postical interval may be mediated by changes in intra-and extra-cellular ion dynamics and synaptic excitability [18, 9]. In addition to local processes, long-range network interactions may be involved in ictus termination. For example, there is experimental evidence that maximum intra-hemispheric synchrony prior to seizure offset may trigger inhibitory processes [36]. Finally, a few more recent studies have proposed algorithms for automatic detection of seizure termination [28, 38]. In order to design efficient treatments that aim to prevent or arrest seizures, we need a better understanding of the neurodynamic correlates of self-limited seizure termination, not only at the micro/mesoscales, i.e., that of individual neurons and neuronal ensembles measured by local field potentials, but also at the macroscale. This is the scale targeted by promising approaches for seizure control, such as non-invasive stimulation, and is thus of significant interest.
The dynamics of seizure evolution are clearly complex, and involve potentially multiple coupled electrophysiological and neurodynamic processes. Several studies have identified seizure-related high-frequency (>100 Hz) oscillations (HFO) and related network interactions in intracranial EEG. HFOs have been specifically associated with seizure evolution and the epileptogenic region, and may potentially represent spatio-temporal electrophysiological markers of this process [14, 39, 15, 26, 43]. In contrast, no measurable HFOs in the immediate postictal period have been detected [43]. Recent studies have also reported seizure-related and spasm-related high-frequency waveforms and aberrant network synchrony in scalp EEG [2, 44, 12, 15, 13, 31]. However, for this activity to be measurable at the scalp, it probably originates from areas of the brain beyond the epileptogenic region, and may represent a more spatially distributed phenomenon. Increased distributed stochastic activity or neural ‘noise’ prior to seizure onset may make these HFOs easier to detect in scalp or intracranial EEG, by increasing signal-to-noise ratio through the mechanism of stochastic resonance [6]. To date the neural generators of scalp-measurable high-frequency activity in the epileptic brain remain unclear. Furthermore, the occurrence and potential role of such activity during the brain’s transition from ictal to postictal periods, and thus in seizure termination, are unknown. We hypothesized that transient high-frequency activity acts as a form of destructive interference in aberrantly coordinated brain networks during the ictal interval, and facilitates the disruption of abnormal neural synchrony. In turn, this allows seizures to stop and the brain to return to a neurodynamic equilibrium in the postictal interval. Using the information theoretic measures previously reported in [31], we examined high-frequency network coordination estimated from scalp EEGs recorded during ictal and immediate postictal intervals in 8 patients with focal epilepsy who had multiple focal seizures. There are several studies on preictal and ictal network synchrony, including some that specifically focus on neurodynamic network changes at ictal onset, estimated from intracerebral recordings, using various measures of correlation, e.g., [3, 4, 41, 23, 17]. However, at frequencies >100 Hz scalp EEG signals may be particularly noisy, and pairwise interactions between these signals may be non-linear. Therefore, information theoretic measures, which are probabilistic, may be more appropriate for quantifying these interactions than other correlation and coherence measures.
2. Methods
2.1. Electrophysiological Data
All scalp EEGs analyzed in this study were recorded in the Clinical Neurophysiology Laboratory of the Comprehensive Epilepsy Center at Beth Israel Deaconess Medical Center (BIDMC), Boston MA. This research was approved by the BIDMC institutional review board, and was thus performed in accordance with ethical standards laid down in the 1964 Declaration of Helsinki. All data were recorded using a standard international 10–20 clinical EEG system. They were sampled at 500 samples/sec and montaged using a referential montage with channel Cz as the reference. The signal quality in this channel was examined prior to re-montaging the raw data, to ensure that it did not spuriously contaminate other signals from other with noise. The maximum acceptable electrode impedance was 5 kΩ.
2.1.1. Subject selection
Eight adult subjects (1 male, 7 female), in the age range 33–91 years (μ=47, σ=18.8), were chosen from adult patients with available scalp EEG data, who met the following inclusion criteria: 1) at least 18 years of age, 2) diagnosis of focal, medically refractory epilepsy, 3) no prior resective brain surgery, 4) availability of at least one complete seizure recorded on scalp EEG with good technical quality for analysis and identifiable ictal onset and offset based on visual inspection by the reviewing electroencephalographer (BSC), 5) availability of corresponding immediate postictal intervals at least 30 sec long. Preictal EEG data from 7 of 8 patients have been previously analyzed in [31]. Not all seizures analyzed in that study were included here, as not all corresponding EEG segments met the additional inclusion criterion of at least 30 sec of postictal activity. All seizures occurred during wakefulness. Identified etiologies included hippocampal or mesial temporal atrophy or sclerosis (n=3), prior parenchymal brain hemorrhage (n=1), gray matter heterotopia (n=1), and unknown cause (n=3). Although it may not always be possible to clearly localize the seizure onset based on the visual interpretation of scalp EEG, the probable seizure foci were located in the temporal lobe (n=5), frontal lobe (n=2) or both (n=1). Table 1 summarizes these data. All patients included in this study had at least 5 nonictal EEG segments i.e., at least 12–24 hr removed from any ictal event, covering long periods of time. These segments were at least 30 sec long, and on average a few min long, and have been analyzed in detail in [31]. Patients were on different antiepileptic medications, which were not controlled for, given the retrospective nature of the study. However, the potential sample heterogeneity in terms of medications did not appear to significantly affect the results of the study, which were consistent across patients.
Table 1.
Patient clinical demographics and EEG intervals.
| Pt | Age | Focus | # Seizures | Ictal (sec) | Postictal (sec) | Etiology |
|---|---|---|---|---|---|---|
| 1 | 47 | temporal | 6 | 60–89 | 35–87 | Mesial Sclerosis (L) |
| 2 | 43 | temporal | 3 | 76–132 | 43–95 | Unknown |
| 3 | 42 | frontal/temporal | 3 | 43–61 | 85–93 | Unknown |
| 4 | 33 | temporal | 2 | 44–114.5 | 30–76 | Bilat. hippocampal atrophy |
| 5 | 50 | temporal | 1 | 115.5 | 30 | Periventricular Heterotopia |
| 6 | 33 | temporal | 3 | 59–97 | 30–61 | Mesial Sclerosis (R) |
| 7 | 91 | frontal | 6 | 73–131 | 69–83 | Frontal Hematoma (R) |
| 8 | 37 | bifrontal | 1 | 23.5 | 98.5 | Unknown |
2.1.2. Scalp EEG selection
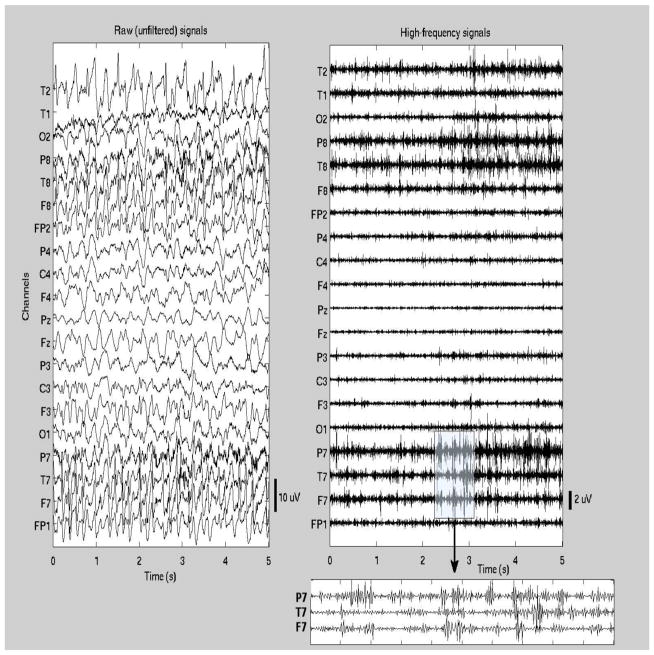
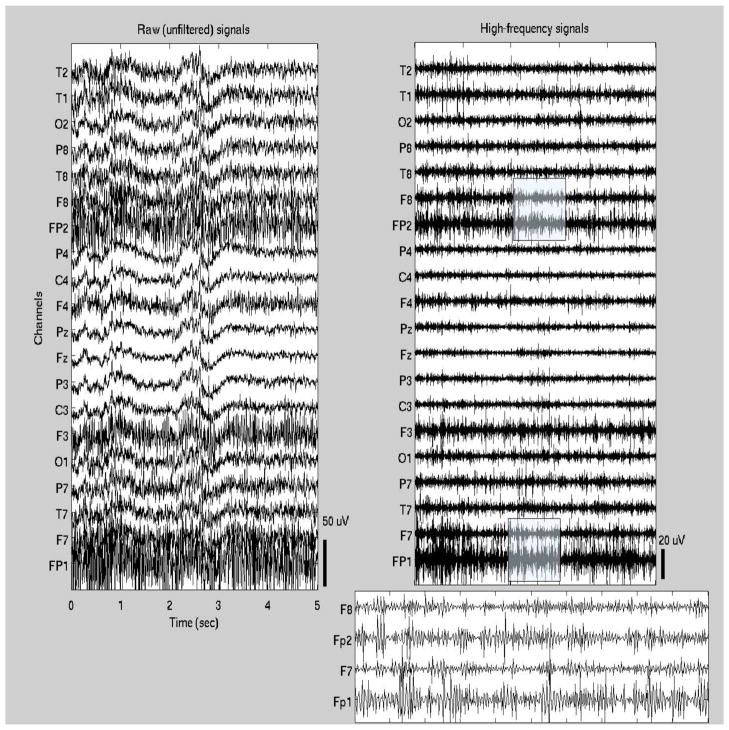
Typically, only relatively short EEG data clips are saved in clinical databases for long periods of time, including 2–3 min prior to ictal onset, the complete seizure, and 2–3 min following ictal offset. All data were selected and reviewed by a board-certified neurologist and clinical neurophysiologist (B.S.C.). Standard clinical methods of visual EEG interpretation were used to identify the ictal onset and offset times to the nearest half-second. The ictal onset was taken to be the point at which a focal pattern of rhythmic waveforms, representing a distinct change in the background activity and consistent with an ictal evolution (usually with higher-frequency lower-amplitude activity initially, progressing to lower frequencies and higher amplitudes over time), was first seen on the recording. Ictal offset was taken to be the point after which rhythmic ictal activity could no longer be seen; activity after this point was often slow and suppressed either focally or in a generalized distribution, suggestive of a postictal state. Given the limited length of postictal EEGs, no return to the interictal baseline was observed, i.e., only the immediate postictal interval was captured in these recordings. Figures 1–2 show examples of ictal EEG traces (the first 5 sec of the ictal interval) from one patient with temporal lobe seizures and one patient with frontal seizures (patients #1 and #8, respectively). Both unfiltered and high-pass filtered signals are shown.
Figure 1.
Ictal EEG segment from one patient with temporal lobe seizures (patient #1 in Table 1). The first 5 sec of the seizure are shown (t=0 corresponds to the seizure onset). Both the unfiltered signals (left panel) and high-pass filtered signals (right panel) are shown. In addition, high-frequency waveforms are shown in more detail in a 1-sec segment from a subset of channels.
Figure 2.
Ictal EEG segment from one patient with frontal seizures (patient #8 in Table 1). The first 5 sec of the seizure are shown (t=0 corresponds to the seizure onset). Both the unfiltered signals (left panel) and high-pass filtered signals (right panel) are shown. In addition, high-frequency waveforms from frontal channels (Fp1, F7, Fp2, F8) are shown in more detail in a 1-sec segment (shaded segment).
2.2. EEG Analysis
2.2.1. Signal Pre-processing
Power-line noise was attenuated with a stopband filterbank of third-order elliptical filters centered at the 60 Hz harmonics of the noise, in the range 60–250 Hz, with a 1 Hz bandwidth, at least 20 dB attenuation in the stopband, and 0.5 dB ripple in the passband. Signals were filtered in both forward and reverse directions to eliminate potential phase distortions due to the non-linear phase of the filter. EEGs were also high-pass filtered with 100 Hz cutoff, for analysis of high-frequency activity, and low-pass filtered with the same cutoff for separate signal analysis at frequencies <100 Hz. Eye-blink and muscle-related artifacts were eliminated using a stopband matched-filterbank [32] as follows: for each patient, nonictal recordings from quiescent periods we used to identify multiple waveforms for eye blinking and muscle movement/twitching. Eye-blinking artifacts are typically low-frequency, narrowband events with stereotypical waveforms. These waveforms were used as templates for the matched-filter. Muscle artifact waveforms are broader-band with more heterogeneous signatures. Their respective waveforms, also estimated from quiescent periods in the EEG, e.g., nonictal intervals during which it is easier to identify specific signatures independently from seizure-related activity, were used as templates in the stopband filterbank. Thus, for matched filtering, both eye blinking and muscle templates were time-reversed and convolved with each EEG signal, to identify intervals of increased signal-to-noise ratio, which in terms reflects matching between the template and the signal of interest. To suppress artifact occurrence in these intervals, the bandwidth of these templates were used as the stopband. This approach is described in more detail in [34].
When continuous signals that include discontinuities, such as ictal/interictal spikes, are filtered, e.g., with a low-pass filter, the presence of spikes may result in what is often referred to as ‘ringing’ artifacts, associated with Gibbs phenomenon [10]. Thus, in filtered signals, artifactual high-frequency waveforms may appear in the vicinity of spikes. We carefully examined all filtered ictal signals to ensure that no artifactual high-frequency waveforms in filtered EEGs were introduced by the filtering process. We also performed simulations, where we varied filter parameters (order, stopband attenuation, bandpass ripple) to ensure that the selected filters performed adequately in that respect. Figure 3 shows an example of an ictal EEG segment (one channel), unfiltered (top), low-pass filtered (middle) and high-pass filtered. The low-pass filter does not appear to introduce any ringing artifacts. The low-amplitude, high-passed signal reflects transient bursts of higher-frequency activity that are often observed riding on top or lower frequency oscillations and have also been reported as riding on top spikes, particularly in intracerebral EEG [39]. Figure 4 shows an segment of simulated data, using a Poisson model for spike generation, corrupted with additive gaussian noise. The raw and high-pass filtered data (using the same filters applied to the real data), and their respective spectra are shown. Again, there is no evidence of significant ringing artifacts.
Figure 3.
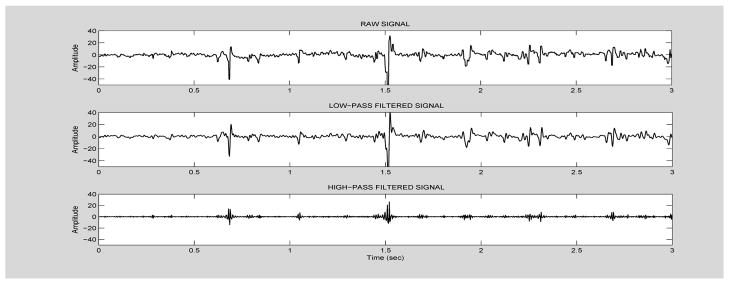
Example of raw ictal EEG segment (channel T7), from patient #4 (top plot), low-pass filtered (middle plot) and high-pass filtered (bottom plot).
Figure 4.
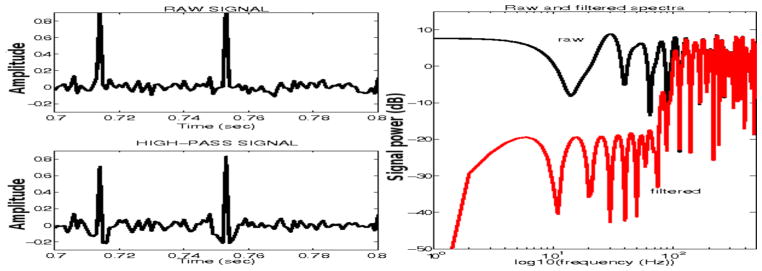
Simulated spike/noise signal (top left panel) and high-pass filtered signal (bottom left panel). Corresponding spectra are superimposed (black: unfiltered, red: filtered).
2.2.2. Estimation of Network Coordination
Mutual information, conditional mutual information and their difference, or interaction information (II), were used to quantify pairwise network coordination. These measures have been proposed in several studies for quantifying neuromodulations encoded in electrophysiological signals [40, 29, 22], and were used to analyze preictal and ictal scalp EEGs in [31], as well. However, in this latter study, we focused on the directionality of network coordination, measured by interaction information and a directionality index, with an emphasis on the preictal interval. Mutual Information (MI) between random variables X and Y measures their mutual dependence or interaction. It is a function of the joint probability distribution function p(x, y) of X and Y, and the marginal probability distribution functions p(x) and p(y) [7]. Given the non-stationarity of EEG signals, probability distribution functions may be estimated from the data non-parametrically, e.g., using kernel methods, by segmenting each signal into bins in which stationarity may be assumed [8]. Here 1-sec bins were selected.
Conditional Mutual Information (CMI)
measures the inter-dependence between two random variables, conditioned on a third variable Z. This latter variable may represent a third EEG signal, either in the neighborhood of the other two, or any other cortical region, e.g., in a distant part of the brain, or even a spatially averaged measure of network synchrony [31]. Thus, CMI can measure any conditional inter-dependences between EEG signals, and is thus more flexible than other pairwise coordination measures, such as cross-correlation and coherence. In this study we only focused on conditional interactions in the immediate neighborhoods of pairs of EEG signals, i.e., one electrode apart from each other. For example, in the standard 10–20 scalp EEG system, the immediate neighborhood of channel Fp1 includes channels F7, F3, Fp2, Fz. CMI was also used to estimate local and long-range cross-frequency coupling, i.e., information between pairs EEGs was conditioned on a third signal Z in the same frequency range as the pair, and outside that range.
Interaction Information, the difference between MI and CMI, quantifies the influence of the conditioning variable Z on the inter-dependence between the pair of variables (X, Y). It can be positive or negative, depending on whether Z enhances or inhibits the pairwise interaction [7]. Note that high-frequency signal amplitudes were at least an order of magnitude lower than amplitudes at frequencies < 100 Hz [31]. Prior to the estimation of all information parameters as well as marginal and joint probability distributions, all signals were normalized by their maximum absolute value.
At each sliding 1-sec data window, an information parameter matrix was constructed, corresponding to the adjacency matrix of a graph. A threshold for relative connectivity was estimated as described below. Three additional network parameters were estimated: 1) the average absolute connectedness of the network, defined as the ratio , with ET the total number of edges in the network and N the total number of nodes, which here is equal to the number of EEG channels (N=20 here). The average relative connectedness of the network, a normalized version of the first parameter, where the normalization corresponds to the average connectedness of the nonictal network, i.e., . 3) The centrality of each node, which quantifies the relative importance of a single node in the network, and is defined as the ratio , where Ei is the number of edges connecting node i to others in the network. All parameters were estimated both for ictal and postictal networks.
Thresholds for information parameters
In studies of preictal seizure dynamics, the comparison between the neurophysiological/network measures of interest and corresponding baseline (nonictal) parameters is necessary to assess their sensitivity and specificity to seizure-related precursory changes in neural activity. Thus, relevant thresholds can be estimated from nonictal parameter values [31]. However, in this study we were interested in dynamic changes in network coordination at high (>100 Hz) and lower (≤100 Hz) frequencies within the ictal interval, and the immediate postictal interval. Thus, a patient-specific range (in case of multiple seizures) or individual threshold was selected. Respective distributions of information parameters were right-skewed exponential. Consequently, for each seizure segmented in multiple 1-sec intervals in which information parameters were estimated, the median of all pairwise mutual or conditional mutual information values (median over all upper or lower-triangular information matrices, which are symmetric) was assumed as a global threshold for network coordination. Thus, given the scope of the study, these thresholds were distinct from those assumed in studies of preictal network synchrony [31]. Separate thresholds were estimated for the two frequency ranges and for each parameter. On average, thresholds for high-frequency parameters were an order of magnitude lower than corresponding thresholds at frequencies <100 Hz. We selected the median rather than the mean, as a less conservative threshold, given the right skewness of the data, which implies that the mean is greater than the median. In addition, nonictal information parameters were estimated for each patient, and their median was used as a threshold for comparison with immediate postictal parameters.
Model fitting to information parameter data
Throughout the analysis, information parameters were estimated spatio-temporally. Polynomial models were fitted to the data, to identify corresponding patterns of variation in time and space. Models were fitted in a least-squares sense. The selected model (polynomial) order was based on the Akaike information criterion (AIC) [1]. All signal analysis and information parameter estimation were performed using the software Matlab (The Mathworks Inc). Statistical analysis was performed using the software R.
3. Results
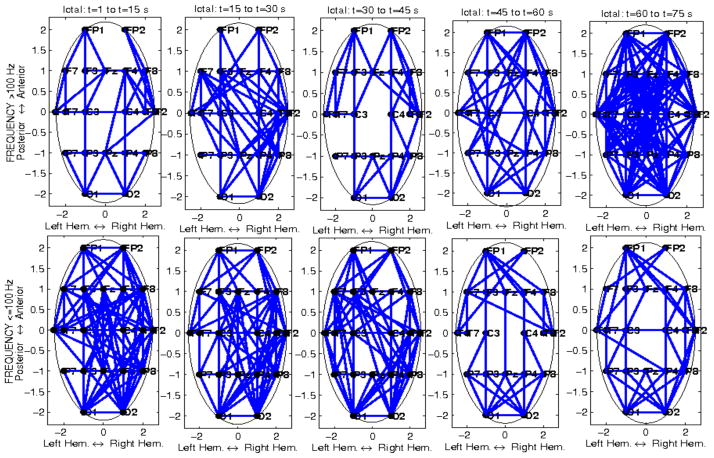
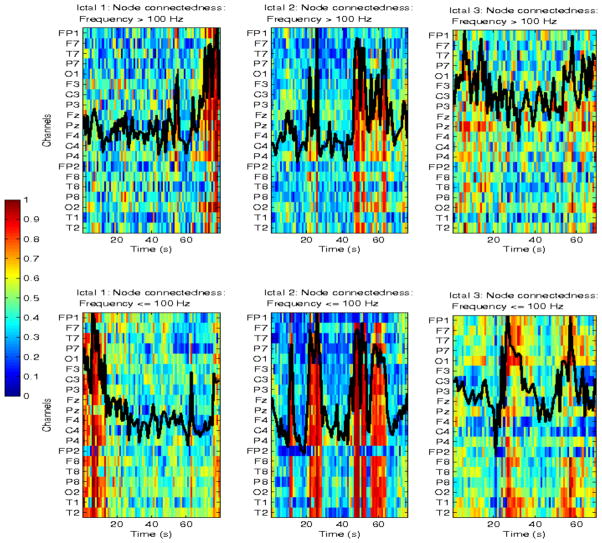
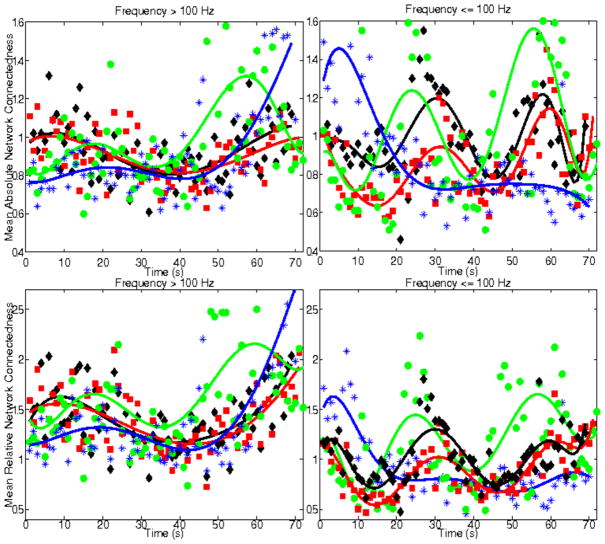
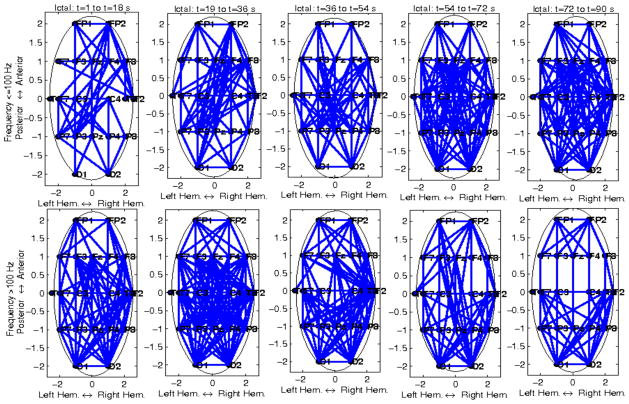
A total of 25 seizures were analyzed. Results are shown at the individual seizure and patient levels, as well as at the cohort level. We first estimated pairwise network interactions measured by mutual information (MI), and consequently mean network connectivity and node centrality, and their respective dynamics in the ictal and postictal intervals. Figures 5–7 show the spatio-temporal ictal dynamics of network connectivity in the two frequency ranges of interest, for one patient with left mesial sclerosis and left temporal seizures (Pt #1 with a total of 6 seizures). Figure 5 corresponds to one seizure, Figures 6 and 7 include several ictal intervals. Results from two shorter seizures and no clear patterns of spatio-temporal MI variability at either frequency range, are not shown. EEG recordings from those two seizures were also noisier. For all other seizures, distinct spatio-temporal patterns of dynamic network interactions were estimated. Specifically, MI, and consequently mean network connectivity followed a non-linear, and in some cases quasi-oscillatory temporal pattern in both frequency ranges, at least during 3 seizures. However, during one seizure, both mean absolute and relative connectedness were maximum at the beginning of the ictal interval (within the first 10 sec), at frequencies <100 Hz, when corresponding high-frequency MI was minimum. For the same seizure, maximum high-frequency MI occurred at the end of the seizure, where the lower-frequency parameter was minimum (Figure 7, blue curves). In general, the polynomial order, and consequently the non-linearity of the temporal pattern of network coordination in the brain during seizures, was higher for MI at frequencies <100 Hz. In turn, this suggests that more rapid fluctuations in network synchrony occur at these frequencies than at higher frequencies, possibly associated with some mechanism of dynamic resetting in the brain. In 3 of 4 displayed ictal events at high frequencies, MI reached a minimum approximately in the middle of the seizure. In a previous study of a subset of these data, we have also reported a change in both the directionality of information of flow and interaction information approximately at the same time. In that study we have shown that directionality of network synchrony decreases significantly in the latter half of seizures [31]. Here, minima in mutual information were consistently estimated across multiple ictal intervals. In turn, this suggests the potential occurrence of some type of dynamic resetting that may play a role in facilitating seizure termination. Furthermore, relative network connectedness, which measures change in neuronal synchrony relative to its nonictal values, was higher at higher frequencies than at frequencies <100 Hz. Finally, distinct spatio-temporal dynamics of node centrality were also estimated. Although, as expected, there was an overall increase in node centrality in periods of high network connectedness, there was also differential spatial variability in this parameter, at least in 3 of 4 seizures. For example, higher node centrality was estimated ipsilaterally to the hemisphere of seizure onset, at the beginning of the seizure at lower frequencies, and at the end of the seizure at higher frequencies (see left panels in Figure 7). Similarly, higher node centrality in the left hemisphere (and bilaterally in temporal regions) was estimated during a second seizure (see right panels in Figure 7). Although these results highlight the intra-patient heterogeneity of seizure dynamics and consequently neuronal network interactions, they also reveal a specific interplay between neural coordinations at different frequency ranges, and a potential interference role of high-frequency interactions during aberrant ictal network synchrony.
Figure 5.
Temporal variability of ictal mutual information (MI) for a patient with left temporal seizures (Pt #1), at frequencies >100 Hz (top plots), and ≤100 Hz (bottom plots), respectively. In each panel, the entire brain network is shown, with nodes corresponding to EEG channels. Only connections (edges) exceeding corresponding thresholds are shown. Each panel corresponds to a 15 sec ictal window, from ictal onset to offset, for a 75 sec long seizure.
Figure 7.
Node centrality, and superimposed mean network connectivity for 3 ictal events from the same patients as in Figures 5 and 6 (Pt #1). Top plots show high-frequency node centrality as a function of time, and superimposed mean absolute network connectivity for the entire brain, for each seizure. Bottom plots show corresponding parameters at frequencies ≤100 Hz. Note that the mean network connectivity trajectory was normalized for plotting purposes, to superimpose to the node centrality heat maps, and does not correspond to a specific channel.
Figure 6.
Temporal variation of mean absolute (top plots) and relative (bottom plots) network connectivity, for 4 ictal events, from the same patient as in Figure 5. Left panels correspond to frequencies > 100 Hz and right panels to frequencies ≤100 Hz. Individual ictal events, with different durations, are shown in different colors. The best fit model (in a least-squares sense), for each ictal pattern, is superimposed to the data.
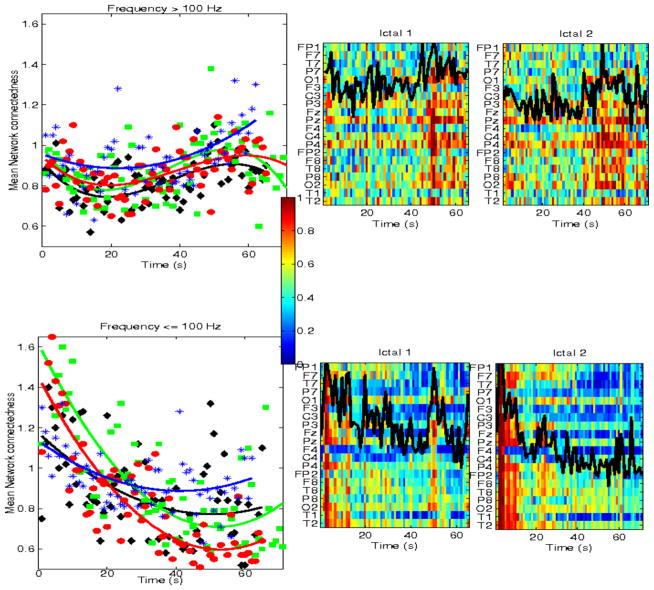
Figures 9 and 10 show corresponding results for a second patient with mesial sclerosis and multiple right temporal seizures (Pt #6) and one patient with multiple right frontal seizures (Pt #7). In both patients network connectedness and node centrality appeared to follow opposite trajectories, with high-frequency parameters increasing during the ictal interval, linearly or non-linearly and lower frequency parameters decreasing, at least in the latter 10–20 sec of the seizure. These results were particularly consistent across ictal events in the patient with frontal seizures. For this patient, low-order polynomial models (order 2 or 3) consistently best fitted the data, suggesting a long time scale of high-frequency network interactions during the ictal interval, possibly leading to rapid decrease in aberrant network synchrony at frequencies ≤100 Hz. This was consistent in all patients (see previous examples).
Figure 9.
Mean absolute network connectedness (left panels), at frequencies ≤100 Hz (bottom), and >100 Hz (top), respectively, for the same patient as in Figure 8 (Pt #6). Results from all 3 ictal events are superimposed, and are shown with different color. The right side panels show the corresponding node centrality, and superimposed mean network connectivity.
Figure 10.
Mean absolute network connectedness (left panels), at frequencies ≤100 Hz (bottom), and >100 Hz (top), respectively, for a patient with right frontal seizures (Pt #7). Results from 4 ictal events are superimposed, and are shown with different color. The right side panels show the corresponding node centrality for two representative seizures (#1 (black curves in right panels) and #2 (green curves)), and superimposed mean network connectivity.
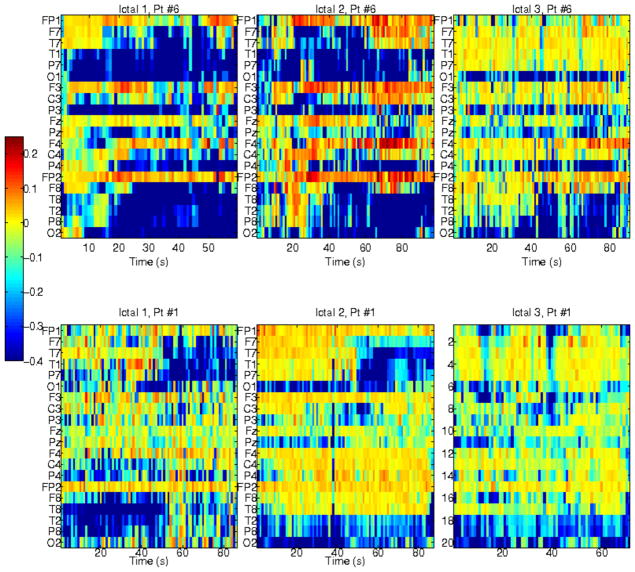
To assess the influence of high-frequency activity on lower-frequency network interactions, we examined the cross-frequency conditional mutual information (CMI), with high-frequency activity as the conditioning variable, i.e., for a pair of EEG signals at frequencies ≤100 Hz, the effect of conditioning their interactions on a third, but high-frequency EEG signal was assessed. Interaction information (II) was used to assess the influence of the conditioning variable pairwise interactions, within or outside the neighborhood of the channel associated with that variable. No significant lower-frequency network modulations by high-frequency activity was observed, with the exception of midline channels Fz and Pz. High-frequency EEGs recorded from these channels inhibited lower-frequency interactions within the respective neighborhoods of Pz and Fz, i.e., II was consistently negative for these channels, irrespective of individual ictal dynamics and seizure types (temporal versus frontal). However, II values were low, ≥−0.2 for a range of [−1,1], suggesting that this inhibition may be insignificant. Scalp EEGs are sparse and the conditioning variable may correspond to a channel at a distance several cm from the pair of EEGs for which mutual information is assessed, and thus the effect of relatively distant high-frequency neural activity may be negligible. When a different conditioning parameter is used, e.g., the global mean cross-correlation of the entire brain in [31], the variation of interaction information may be very different. Furthermore, the effects of all other high-frequency EEGs on lower-frequency interactions within or outside their respective neighborhoods appeared temporally random (based on the runs test to assess randomness), and were also low (positive or negative). In contrast, CMI and II with in-frequency conditioning, i.e., measuring the influence of an EEG signal at frequencies ≤100 Hz, on pairs of EEGs within its neighborhood and also in the same frequency range, were higher and temporally non-random. This suggests that at these frequencies, pairwise interactions are influenced by neural activity beyond the EEG pair of interest, but in its immediate neighborhood. Examples of II variability for six ictal events, from two patients with right and left temporal seizures, respectively, are shown in Figure 11. In all patients with temporal lobe seizures, pairwise interactions appeared to be influenced by the activity of other channels in their neighborhood, some irrespective of ictal evolution, e.g., channels Fp1 and Fp2 in upper panels. However, there were also temporally specific patterns, particularly for channels covering regions of seizure onset. For example, in latter parts of the seizure, activity in channels in the neighborhood of right or left temporal onset, respectively, inhibition of activity in those regions, as suggested by negative interaction information, was observed. This was estimated in many of temporal lobe seizures, but not consistently in seizures of frontal origin.
Figure 11.
Interaction information (II), measuring the influence of an individual EEG signal on pairwise interactions between EEGs in its immediate channel neighborhood, which includes only channels at single-electrode distance from the conditioning EEG, at frequencies ≤100 Hz. Each plot shows mean II between in each EEG (y-axis) and its neighborhood (averaged over channels within the neighborhood), as a function of time (x-axis). Top plots show 3 ictal intervals from patient Pt#6 with right temporal seizures, and bottom plots show 3 ictal events from patient Pt#1 with left temporal seizures.
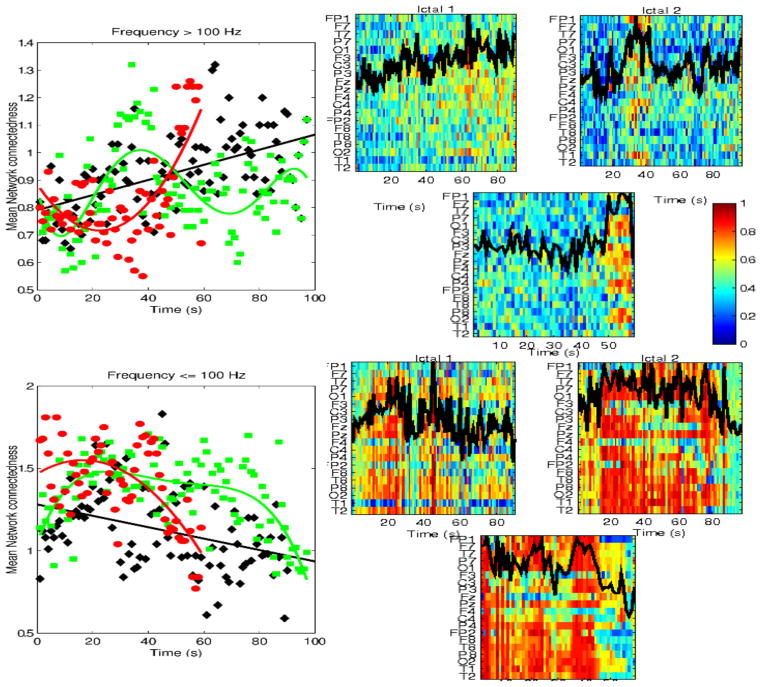
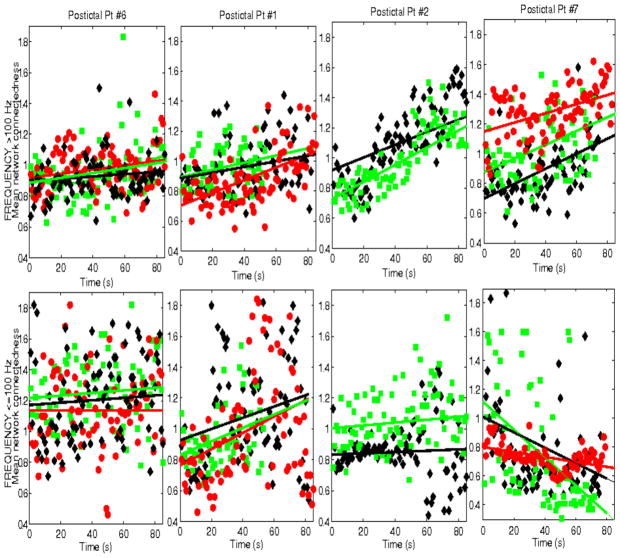
Finally, we also examined network interactions during postictal intervals. These were typically short, 30 sec – ~3 min, and thus only covered the immediate postictal period. Figure 12 shows mean network connectedness, estimated from mutual information, for 4 patients and multiple postictal intervals, 3 with temporal lobe seizures (Pt #1, 2, 6) and one with frontal lobe seizures (Pt#7). Only postictal intervals at least 60 sec long are shown. In general, mean network connectedness at high frequencies increased from ictal offset to the end of available postictal intervals, quasi-linearly (a polynomial of order 1 was consistently selected as the best fitted model, using the AIC criterion). This was observed across seizures and patients, though connectedness patterns had distinct slopes, some slowly increasing through the postictal intervals, e.g., patients Pt#6, Pt#1 and others increasing more rapidly, e.g. Pt #2, Pt#7. Note that in several ictal intervals, network connectedness also increased from seizure onset to offset, though typically non-linearly. Therefore, these postictal dynamics are consistent with a continuation of increased high-frequency coordination that started during the seizure, but have a lower complexity (linear). In contrast, at frequencies <100 Hz postictal network coordination showed no consistent dynamics across seizures and patients. These data were typically scattered in time, with no apparent correlation with the dynamics of ictal network coordination at these frequencies.
Figure 12.
Mean network connectedness during postictal intervals in 4 patients (Pt #1,2,6,7), at frequencies ≤100 Hz (top panels) nd >100 Hz (lower panels). Only data for postictal intervals at least 60 sec long are shown.
4. Discussion
We have investigated ictal and immediate postictal network dynamics in 8 patients with focal epilepsy and multiple seizures originating in temporal and/or frontal brain regions, with the goal to understand macroscale processes that may facilitate self-limited seizure termination. In particular, we have examined potential neuromodulatory effects of high-frequency (>100 Hz) network coordination on ictal evolution. For this purpose, we have used an information theoretic framework, and have estimated parameters of network coordination, including mutual and conditional mutual information, as well as mean network connectedness and node centrality, a measure of network topology. Distinct network dynamics were estimated at frequencies >100 Hz and ≤100 Hz, respectively, across patients and seizures, irrespective of the origin of seizure onset. In general, synchrony at high-frequencies was on average an order of magnitude lower than at frequencies ≤100 Hz. However, its relative increase compared to estimated thresholds was on average significantly higher than the corresponding increase at frequencies ≤100 Hz (p<0.0001). Nevertheless, in both ranges networks were dynamically modulated during both ictal and postictal periods. Specifically, ictal and postictal network coordination at high frequencies increased during ictal and postical intervals, typically non-linearly in the former and linearly in the latter. In contrast, network coordination at lower frequencies decreased or followed complex quasi-periodic patterns during ictal periods, but varied almost randomly in postictal intervals. Furthermore, at least in a subset of seizures, opposite patterns of temporal network coordination were observed in the two frequency ranges, e.g., a minimum in mutual information, node centrality or network connectedness at frequencies ≤100 Hz, occurred at approximately the same time as a maximum of these parameters at frequencies >100 Hz. Despite inter-seizure and inter-patient variability of these parameters, which reflects intra-and inter-patient heterogeneity and/or the quality of scalp EEG signals, these results were consistent in several patients with multiple seizures. In cases of clear non-linear patterns, extrema in network synchrony may reflect some type of dynamic network resetting that facilitates seizure termination. Our results further suggest that this resetting occurs approximately halfway through the seizure, and thus at least 20–30 sec prior to ictal offset, and may be modulated by high-frequency coordination. Our previous work has shown that this network coordination may be non-directional [31], and thus reflect a disruptive role of ictal high-frequency activity in the ictal interval to interrupt aberrant synchrony, which is distinct from a facilitatory role of preictal high-frequency activity. Immediate postictal high-frequency network coordination increased monotonically. Evidently, we only had relatively short postictal EEG segments, and thus were not able to measure the entire postictal phase, which may span much longer periods.
To assess the effect of larger parts of the network on pairwise EEG interactions, and thus on local synchrony, we estimated conditional mutual information, where information between pairs of EEGs was conditioned on a third signal within the neighborhood of the pair. Both in-frequency and cross-frequency conditioning were examined, to assess whether high-frequency activity associated with an individual network node affected local lower-frequency interactions and vice versa. The effects of high-frequency activity on lower-frequency networks appeared temporally random. This may be due to the fact that broadband signals in the range 100–250 Hz and 0.5–100 Hz, were used for conditioning and for computing mutual information, respectively (and vice versa). Thus, multi-scale analysis, where narrower band signals are used for conditioning, may be necessary to assess potential cross-frequency effects [33]. Second, scalp EEGs are spatially sparse recordings and inter-channel distances are of the order of several cm. Therefore, if high-frequency effects are localized, neural activity in a region covered by even a signal scalp electrode may only weakly interact with pairwise interactions between two other EEGs even in their common spatial neighborhood. Third, a different conditioning variable may be more meaningful. For example, in [31] conditioning pairwise interactions on the global correlation of the entire brain, rather than the activity of individual channels, revealed differential and non-random spatio-temporal changes in interaction information [31] during seizures. Nevertheless, measurable and temporally-specific in-frequency effects of distant parts of the network on pairwise EEG coordinations were estimated at frequencies ≤100 Hz. In particular, inhibition of these pairwise interactions by their neighborhood, measured by negative interaction information, was estimated specifically in latter parts of seizures, and in regions of ictal onset. This suggests another potential mechanism that may facilitate seizure termination, namely, mutual neural inhibition within the region of ictal onset, to prevent further aberrant synchrony. Although ictal network coordinations at high frequencies estimated from scalp and intracranial EEG, respectively, are not truly comparable, as the origin of high-frequency activity in the two signals is different, desynchrony in the seizure onset zone at ictal onset has been reported in previous studies of ictal intracerebral recordings[42]. As seizures spread to larger areas of the brain during ictal evolution, scalp EEG measures aggregate high-frequency activity beyond the epileptogenic region. Thus, the estimated high-frequency synchrony originates from a larger brain area. Negative interaction information was also estimated in regions beyond the seizure onset region. Thus, several mechanisms may simultaneously contribute to seizure termination, across the EEG spectrum. Our results raise the possibility that high-frequency network interactions may indeed play a role in this process. A more detailed cross-frequency analysis that investigates the effects of narrowband signals in this frequency range on lower frequency networks, may provide more specific insights into their potential disruptive effects on aberrant ictal synchrony.
Evidently, this analysis, and in general any estimation of the strength of network interactions, is clearly threshold-dependent. Therefore, as information parameter thresholds are varied, different sub-networks are revealed. For example, a more conservative threshold may lead to only parts of the global network to appear connected, in which coordination exceeds that particular threshold. A less conservative threshold will lead to a network with a higher number of connections. Although simulation studies were not performed to optimize thresholds in this study, selected thresholds were data-derived, patient-specific, and were based on the distribution of estimated information parameters. For each patient, we also empirically varied relevant thresholds by ± ≤20% and did not observe significant changes in the spatio-temporal patterns of network connectedness or node centrality.
There are several limitations to this study, due to its retrospective nature. First the sample size is small, and thus the results are clearly preliminary. A larger patient cohort is necessary to validate and generalize our findings. However, despite the etiology, and other potential heterogeneities of the cohort, including antiepileptic medications, some consistent patterns in high-and lower-frequency network dynamics were estimated across patients, and seizures. Given the small patient sample, these may also be thought of as trends. Nevertheless, they appear to be independent of etiology and region of seizure onset. Furthermore, in the absence of continuous recordings, analyzed postictal intervals were limited to the first few minutes following ictal offset. Thus, longer postictal dynamics could not be estimated. An analysis of continuous EEG recordings that include long-postictal intervals may reveal additional network dynamics that explain the eventual return of the brain to its interictal baseline. Finally, there remains the possibility that network interactions at high-frequencies could be artifactual. However, following pre-processing to suppress artifacts, signals were carefully examined to ensure that they did not contain muscle-related or other artifacts. Furthermore, (anti)correlated patterns between high- and lower-frequency network synchrony were estimated, at least for some seizures. This also suggests that they may not be random and/or artifactual.
5. Conclusions
In summary, using an information theoretic computational framework, we have estimated network coordination parameters in ictal and immediate postictal intervals from scalp EEGs at frequencies >100 Hz. Our results provide novel insights into the potential role of high-frequency neural activity for disruption of ictal dynamics and seizure termination. Neuromodulations of both high (>100 Hz) and lower frequency ictal activity, possibly associated with neurodynamic resetting in the brain, to enable seizure termination, begin tens of seconds prior to seizure offset. They often coincide with an increase in high-frequency network coordination and a decrease in corresponding lower frequency synchrony. In turn this suggest a potential role of high-frequency as an interference mechanism, to disrupt aberrant coordination of neuronal networks and seizure cessation. Though preliminary, these findings are clinically important, as they suggest that it may be possible to design therapeutic interventions, e.g., neurostimulation protocols, for seizure prevention that induce high-frequency network coordination, as a mechanisms of destructive interference. For example, increased stochastic activity in neuronal networks may induce such coordination, and in turn disrupt aberrant synchrony at lower frequencies.
Figure 8.
Temporal variability of ictal mutual information (MI) for a patient with right temporal seizures (Pt #6), at frequencies >100 Hz (top plots), and ≤100 Hz (bottom plots), respectively. In each panel, the entire brain network is shown, with nodes corresponding to EEG channels. Only connections (edges) exceeding corresponding thresholds are shown. Each panel corresponds to a 18 sec ictal window, from ictal onset to offset, for a 90 sec long seizure.
Acknowledgments
The authors would like to thank Larry Gruber for his help with the EEG data. This work was supported by NIH grants R01 NS049159 (BC), a Harvard Catalyst pilot grant (CS), the Harvard Clinical and Translational Science Center (NIH Award #UL1 RR 025758) and financial contributions from Harvard University and its affiliated academic health care centers. The content is solely the responsibility of the authors.
Biographies

Catherine Stamoulis, PhD: Dr Stamoulis is Assistant Professor of Radiology at Harvard Medical School and Boston Children’s Hospital. She holds the BS, MS and PhD degrees all from the Massachusetts Institute of Technology. Her research focuses on computational Neuroscience and in particular the study of neurodynamics in the healthy and diseased brain. In the last four years, her work has focused on epilepsy. She develops novel computational approaches for the analysis of electrophysiological signals, and mathematical models that aim to improve our understanding of the neurodynamic mechanisms underlying seizures initiation, propagation and termination, in the epileptic brain.

Donald L. Schomer, MD: Dr Schomer is Professor of Neurology at Harvard Medical School and Beth Israel Deaconess Medical Center (BIDMC). He is the Director of the Comprehensive Epilepsy Program and the Chief of the Laboratory of Clinical Neurophysiology at BIDMC. He holds the MD degree of the University of Michigan, Ann Arbor. Dr. Schomer is the author of more than 150 publications, including several books in encephalography and epilepsy. He serves on the editorial board and/or as a reviewer for several scientific journals including the New England Journal of Medicine, Epilepsia, Neurology, and the Journal of Clinical Neurophysiology. Dr Schomer oversees the largest clinical epilepsy program for adults in New England.

Bernard S. Chang, MD: Dr Chang is Associate Professor of Neurology at Harvard Medical School and Beth Israel Deaconess Medical Center, and a member of the Comprehensive Epilepsy Center at BIDMC. He received the AB (1993) and MMSc (2005) degrees from Harvard University, Cambridge, MA, and MD (1997) degree from New York University, New York, NY. In his research, he uses imaging, neurophysiological, and brain stimulation techniques to explore the mechanisms of epilepsy and cognitive problems in patients who are born with developmental malformations of the cerebral cortex.
Footnotes
7. Disclosure of Conflicts of Interest
None of the authors has any conflict of interest to disclose. We confirm that we have read the Journal’s position on issues involved in ethical publication and afirm that this report is consistent with those guidelines.
Publisher's Disclaimer: This is a PDF file of an unedited manuscript that has been accepted for publication. As a service to our customers we are providing this early version of the manuscript. The manuscript will undergo copyediting, typesetting, and review of the resulting proof before it is published in its final citable form. Please note that during the production process errors may be discovered which could affect the content, and all legal disclaimers that apply to the journal pertain.
References
- 1.Akaike H. A new look at the statistical model identification. IEEE Trans on Autom Control. 1974;19(6):716723. [Google Scholar]
- 2.Andrade-Valenca LP, Dubeau F, Mari F, Zelmann R, Gotman J. Interictal scalp fast oscillations as a marker of the seizure onset zone. Neurology. 2011;77:524–531. doi: 10.1212/WNL.0b013e318228bee2. [DOI] [PMC free article] [PubMed] [Google Scholar]
- 3.Bartolomei F, Wendling F, Regis J, Gavaret M, Guye M, Chauvel P. Preictal synchrony in limbic networks of mesial temporal epilepsy. Epilepsy Res. 2004;61(1–3):89–104. doi: 10.1016/j.eplepsyres.2004.06.006. [DOI] [PubMed] [Google Scholar]
- 4.Bartolomei F, Gavaret M, Hewett R, Valton L, Aubert S, Rgis J, Wendling F, Chauvel P. Neural networks underlying parietal lobe seizures: a quantified study using intracerebral recordings. Epilepsy Res. 2011;93(2–3):164–176. doi: 10.1016/j.eplepsyres.2010.12.005. [DOI] [PubMed] [Google Scholar]
- 5.Brekelmans GJ, Velis DN, Van Veelen CW, Van Rijen PC, da Silva FH, Van Emde Boas W. Intracranial EEG seizure-offset termination patterns: relation to outcome of epilepsy surgery in temporal lobe epilepsy. Epilepsia. 1998;39(3):259–266. doi: 10.1111/j.1528-1157.1998.tb01370.x. [DOI] [PubMed] [Google Scholar]
- 6.Bulsara AR, Zador A. Threshold detection of wideband signals: a noise-induced maximum in the mutual information. Phys Rev E. 1996;54(3):R2185–R2188. doi: 10.1103/physreve.54.r2185. [DOI] [PubMed] [Google Scholar]
- 7.Cover TM, Thomas JA. Elements of information theory. 2. Willey; 2006. [Google Scholar]
- 8.Chapeau-Blondeau F, Rousseau D. The minimum description length principle for probability density estimation by regular histograms. Physica A. 2009;388:3969–3984. [Google Scholar]
- 9.Frohlich F, Bazhenov M, Timofeev I, Sejnowski TJ. Maintenance and termination of neocortical oscillations by dynamic modulation of intrinsic and synaptic excitability. Thalamus Relat Syst. 2005;3(2):147–156. doi: 10.1017/S147292880700015. [DOI] [PMC free article] [PubMed] [Google Scholar]
- 10.Gibbs JW. Nature. 1899;59:606. Fourier series. [Google Scholar]
- 11.Helmstaedter C, Elger CE, Lendt M. Postictal courses of cognitive deficits in focal epilepsies. Epilepsia. 1994;35:1073–1078. doi: 10.1111/j.1528-1157.1994.tb02557.x. [DOI] [PubMed] [Google Scholar]
- 12.Inoue T, Kobayashi J, Oka M, Yoshinaga H, Ohtsuka Y. Spectral characteristics of EEG gamma rhythms associated with epileptic spasms. Brain Dev. 2008;30:321–328. doi: 10.1016/j.braindev.2007.10.003. [DOI] [PubMed] [Google Scholar]
- 13.Iwatania Y, Kagitani-Shimono K, Tominaga K, Okinaga TO, Kishima H, Katow A, Nagai T, Ozono K. Ictal high-frequency oscillations on scalp EEG recordings in symptomatic West syndrome. Epilepsy Res. 2012 doi: 10.1016/j.eplepsyres.2012.04.020. in press. [DOI] [PubMed] [Google Scholar]
- 14.Jacobs J, et al. High frequency oscillations (80–500 Hz) in the preictal period in patients with focal seizures. Epilepsia. 2009;50(7):1780–1792. doi: 10.1111/j.1528-1167.2009.02067.x. [DOI] [PMC free article] [PubMed] [Google Scholar]
- 15.Kobayashi K, et al. Detection of seizure-associated high-frequency oscillations above 500 Hz. Epilepsy Res. 2010;88(2–3):139–144. doi: 10.1016/j.eplepsyres.2009.10.008. [DOI] [PMC free article] [PubMed] [Google Scholar]
- 16.Kobayashi K, et al. Very fast rhythmic activity on scalp EEG associated with epileptic spasms. Epilepsia. 2004;45(5):488–496. doi: 10.1111/j.0013-9580.2004.45703.x. [DOI] [PubMed] [Google Scholar]
- 17.Kramer MA, Eden UT, Kolaczyk ED, Zepeda R, Eskandar EN, Cash SS. Coalescence and fragmentation of cortical networks during focal seizures. J Neurosci. 2010;30(30):10076–10085. doi: 10.1523/JNEUROSCI.6309-09.2010. [DOI] [PMC free article] [PubMed] [Google Scholar]
- 18.Krishna GP, Bazhenov M. Ionic dynamics mediate spontaneous termination of seizures and postictal depression state. J Neurosci. 2011;31(24):8870–8882. doi: 10.1523/JNEUROSCI.6200-10.2011. [DOI] [PMC free article] [PubMed] [Google Scholar]
- 19.Lado FA, Moshe SL. How do seizure stop? Epilepsia. 2008;49(10):1651–1664. doi: 10.1111/j.1528-1167.2008.01669.x. [DOI] [PMC free article] [PubMed] [Google Scholar]
- 20.Loscher E, Kohling R. Functional, metabolic and synaptic changes after seizures as potential targets for antiepileptic therapy. Epilepsy Behav. 2010;19(2):105–113. doi: 10.1016/j.yebeh.2010.06.035. [DOI] [PubMed] [Google Scholar]
- 21.Mormann F, Andrzejak RG, Elger CE, Lehnertz K. Seizure prediction: the long and winding road. Brain. 2007;130:314–333. doi: 10.1093/brain/awl241. [DOI] [PubMed] [Google Scholar]
- 22.Palus M, et al. Synchronization and information flow in EEGs of epileptic patients. IEEE Eng Med BiolMag. 2001;20(5):65–71. doi: 10.1109/51.956821. [DOI] [PubMed] [Google Scholar]
- 23.Ponten SC, Bartolomei F, Stam CJ. Small-world networks and epilepsy: graph theoretical analysis of intracerebrally recorded mesial temporal lobe seizures. Clin Neurophysiol. 118(4):918–27. doi: 10.1016/j.clinph.2006.12.002. [DOI] [PubMed] [Google Scholar]
- 24.Plummer C, Harvey AS, Cook M. EEG Source Localization in Focal Epilepsy: Where are we now? Epilepsia. 2008;49(2):201–218. doi: 10.1111/j.1528-1167.2007.01381.x. [DOI] [PubMed] [Google Scholar]
- 25.Schindler K, Leung H, Elger CE, Lehnertz K. Assessing seizure dynamics by analyzing the correlation structure of multichannel intracranial EEG. Brain. 2007;130(Pt 1):65–77. doi: 10.1093/brain/awl304. [DOI] [PubMed] [Google Scholar]
- 26.Schindler R, Amos F, Gast H, Muller M, Stibal A, Mariani L, Rummel C. Peri-ictal correlation dynamics of high-frequency (80–200 Hz) intracranial EEG. Epilepsy Res. 2010;89:72–81. doi: 10.1016/j.eplepsyres.2009.11.006. [DOI] [PubMed] [Google Scholar]
- 27.Schmidt D, Noachtar S. Outlook: the postictal state - future directions for research. Epilepsy Behav. 2010;19(2):191–192. doi: 10.1016/j.yebeh.2010.06.015. [DOI] [PubMed] [Google Scholar]
- 28.Shoeb A, Kharbouch A, Soegaard J, Schachter SS, Guttag J. A machine-learning algorithm for detecting seizure termination in scalp EEG. Epilepsy Behav. 2011;22(Suppl 1):S36–43. doi: 10.1016/j.yebeh.2011.08.040. [DOI] [PubMed] [Google Scholar]
- 29.Schreiber T. Measuring information transfer. Phys Rev Lett. 2000;85(2):461–464. doi: 10.1103/PhysRevLett.85.461. [DOI] [PubMed] [Google Scholar]
- 30.Spencer SS, Spencer DD. Implications of seizure termination location in temporal lobe epilepsy. Epilepsia. 1996;37(5):455–458. doi: 10.1111/j.1528-1157.1996.tb00591.x. [DOI] [PubMed] [Google Scholar]
- 31.Stamoulis C, Gruber LJ, Schomer DL, Chang BS. High-frequency neuronal network modulations encoded in scalp EEG precede the onset of focal seizures. Epilepsy Behav. 2012;23(4):471–480. doi: 10.1016/j.yebeh.2012.01.001. [DOI] [PMC free article] [PubMed] [Google Scholar]
- 32.Stamoulis C, Chang BS. Detection of high-frequency waveform anomalies in scalp EEG signals, using a matched-filterbank approach. (unpublished) [Google Scholar]
- 33.Stamoulis C, Chang BS. Multiscale information for network characterization in epilepsy. Conf Proc IEEE Eng Med Biol Soc. 2011;2011:5908–5011. doi: 10.1109/IEMBS.2011.6091461. [DOI] [PMC free article] [PubMed] [Google Scholar]
- 34.Stamoulis C, Chang BS. Application of matched-filtering to extract EEG features and decouple signal contributions from multiple seizure foci in brain malformations. IEEE Proc. 4th International IEEE/EBMS Conf. on Neural Eng; 2009. pp. 514–517. [DOI] [PMC free article] [PubMed] [Google Scholar]
- 35.Suffczynski P, Lopes da Silva FH, Parra J, Velis DN, Bouwman BM, Van Rijn CM, Van Hese P, Boon P, Khosravani H, Derchansky M, Carlen P, Kalitzin S. Dynamics of epileptic phenomena determined from statistics of ictal transitions. IEEE Trans Biomed Eng. 2006;53(3):524–532. doi: 10.1109/TBME.2005.869800. [DOI] [PubMed] [Google Scholar]
- 36.Timofeev I, Steriade M. Neocortical seizures: initiation, development and cessation. Neuroscience. 2004;123(2):299–336. doi: 10.1016/j.neuroscience.2003.08.051. [DOI] [PubMed] [Google Scholar]
- 37.Topolnik L, Steriade M, Timofeev I. Partial cortical deafferentation promotes development of paroxysmal activity. Cereb Cortex. 2003;13:883–893. doi: 10.1093/cercor/13.8.883. [DOI] [PubMed] [Google Scholar]
- 38.Yoo CS, Jung DC, Ahn YM, Kim YS, Kim SG, Yoon H, Lim YJ, Yi SH. Automatic detection of seizure termination during electroconvulsive therapy using sample entropy of the electroencephalogram. Phychiatry Res. 2012;195(1–2):76–82. doi: 10.1016/j.psychres.2011.06.020. [DOI] [PubMed] [Google Scholar]
- 39.Urrestarazu E, Chandler R, Dubeau F, Gotman J. Interictal high-frequency oscillations in the intracerebral EEG of epileptic patients. Brain. 2007;130:2354–2366. doi: 10.1093/brain/awm149. [DOI] [PubMed] [Google Scholar]
- 40.Vejmelka M, Palus M. Inferring the directionality of coupling with conditional mutual information. Phys Rev E. 2008;77:026214. doi: 10.1103/PhysRevE.77.026214. [DOI] [PubMed] [Google Scholar]
- 41.Wendling F, Bartolomei F. Modeling EEG signals and interpreting measures of relationship during temporal-lobe seizures: an approach to the study of epileptogenic networks. Epileptic Disord. 2001;(Special issue):67–78. [PubMed] [Google Scholar]
- 42.Wendling F, Bartolomei F, Bellanger JJ, Bourien J, Chauvel P. Epileptic fast intracerebral EEG activity: evidence for spatial decorrelation at seizure onset. Brain. 2003;126 (Pt6):1149–1459. doi: 10.1093/brain/awg144. [DOI] [PMC free article] [PubMed] [Google Scholar]
- 43.Worrell GA, Parish L, Cranstoun SD, Jonas R, Baltuch G, Litt B. High-frequency oscillations and seizure generation in neocortical epilepsy. Brain. 2004;127:1496–1506. doi: 10.1093/brain/awh149. [DOI] [PubMed] [Google Scholar]
- 44.Wu JY, Koh S, Sankar R, Mathern GW. Paroxysmal fast activity: an interictal scalp EEG marker of epileptogenesis in children. Epilepsy Res. 2008;82:99–106. doi: 10.1016/j.eplepsyres.2008.07.010. [DOI] [PMC free article] [PubMed] [Google Scholar]


