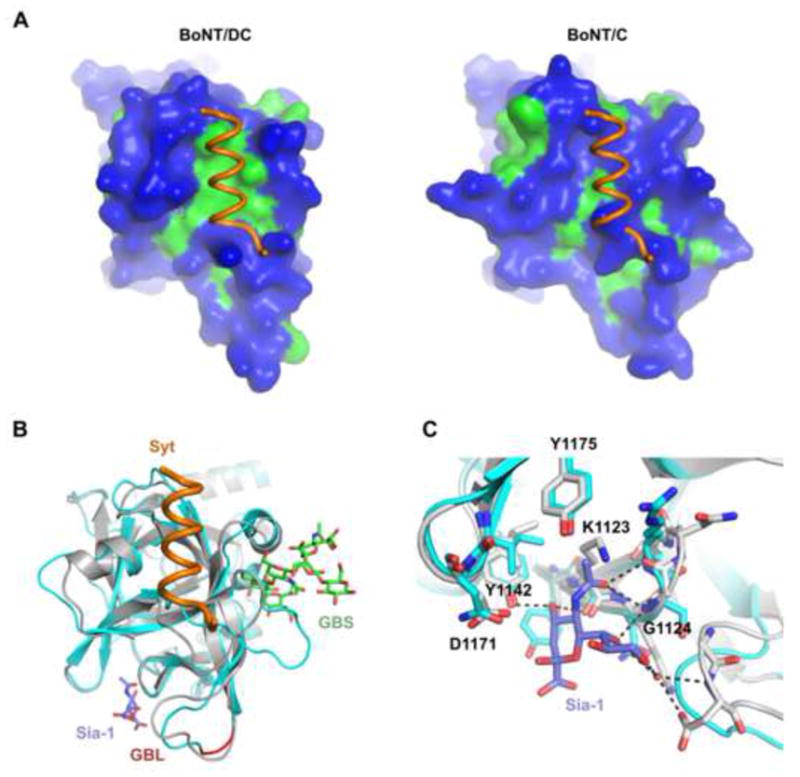
Figure 4. BoNT/DC comparison with BoNT/C.

(a) Surface representation of BoNT/DC (left panel) and BoNT/C (right panel), with hydrophilic surface in blue and hydrophobic in green. The Syt-II recognition sequence bound to BoNT/DC is shown in both figures. It is clear that Syt-II cannot bind to BoNT/C, due to a lack of the important hydrophobic patch found in BoNT/DC, as well as steric clashes. (b) Superimposing BoNT/C-HC (cyan)•Sialic acid complex with BoNT/DC-HC(gray)•Syt-II(orange) complex. The ganglioside GT1b (green) was also modeled onto established ganglioside binding site (GBS) based on the previously determined BoNT/A-GT1b structure (PDB code: 2VU9). The biologically relevant sialic acid moiety, co-crystallized together with BoNT/C, is shown in blue. The ganglioside binding loop (GBL) is shown in red. (c) Close up of the Sia-1 sites in BoNT/C (cyan) and BoNT/DC (gray). Conserved residues in BoNT/DC are marked in the figure, and possible hydrogen bonds between the sialic acid and BoNT/DC are shown as dashed lines. The Sia-1 site is highly conserved between BoNT/C and BoNT/DC. See also Figure S3 for a structure based sequence alignment of BoNT/DC-HC and BoNT/C-HC.
