

Abstract
We developed and applied high throughput liquid and gas chromatography-tandem mass spectrometry (LC-MS/MS and GC-MS/MS) methods for the cigarette smoking-associated biomarkers 4-(methylnitrosamino)-1-(3-pyridyl)-1-butanol (NNAL) and r-1,t-2,3,c-4-tetrahydroxy-1,2,3,4-tetrahydrophenanthrene (PheT), which are urinary metabolites of the carcinogenic tobacco-specific nitrosamine 4-(methylnitrosamino)-1-(3-pyridyl)-1-butanone (NNK) and the polycyclic aromatic hydrocarbon phenanthrene. NNAL and PheT levels have been linked to lung cancer in previous studies of smokers. Confirmation of these relationships will require further molecular epidemiology studies, necessitating improved methodology applicable to large numbers of small urine samples. Furthermore, NNAL is excreted in urine either unconjugated or as an N- or O-glucuronide, but little data are available on the amounts of each in urine. For the high throughput analysis of NNAL, 3 aliquots were processed from each urine sample, one for the analysis of free NNAL, one for free NNAL plus NNAL-N-Gluc, and one for total NNAL (the sum of free NNAL, NNAL-N-Gluc, and NNAL-O-Gluc). Ninety-six well plate technology was used for sample enrichment by supported liquid extraction plates, mixed mode reverse-phase/cation exchange solid-phase extraction, and LC-MS/MS analysis. For the analysis of PheT, the urine samples were cleaned up by solid-phase extraction on styrene-divinylbenzene sorbent, silylated, and analyzed by GC-MS/MS, both in 96-well format. The methods were validated analytically with respect to accuracy and precision, and applied in an ongoing molecular epidemiology study of smokers. The amount of total NNAL in smokers’ urine was (mean ± S.D.) 1.65 ± 2.13 pmol/mL (N = 2641). Free NNAL, NNAL-N-Gluc, and NNAL-O-Gluc represented (mean ± S.D.) 31 ± 11%, 22 ± 14%, and 48 ± 15% of total NNAL, respectively. The amount of PheT in smokers’ urine was (mean ± S.D.) 1.43 ± 2.16 pmol/mL (N = 2613). The methodology described here should be widely applicable in future studies of tobacco use and cancer.
Keywords: 4-(methylnitrosamino)-1-(3-pyridyl)-1-butanol (NNAL); r-1,t-2,3,c-4-tetrahydroxy-1,2,3,4-tetrahydrophenanthrene (PheT) LC-MS/MS; GC-MS/MS human urine
Introduction
Cigarette smoking is the cause of approximately 90% of lung cancer in populations with prolonged use.1 This generally fatal disease, with an average survival time of less than one year after diagnosis, killed approximately 1.37 million people in the world in 2008 (http://www.who.int/mediacentre/factsheets/fs297/en/index.html). Lung cancer is almost completely preventable by abstention from tobacco use, but that is an unfulfilled dream at the present time. While most smokers want to quit, few are successful owing to the addictive properties of nicotine and perhaps other tobacco smoke constituents.2 The most successful smoking cessation programs, combining counseling and nicotine replacement therapy, report six month cessation rates of only about 25%.3
There are still about 1.3 billion smokers in the world.4 Between 11% and 25% of lifelong smokers will get lung cancer, but presently we do not know how to determine which smokers are at highest risk.1 If methods could be developed to identify these high risk individuals, they could be targeted for intensive cessation, prevention, and surveillance activities which might prevent the generally fatal consequences of lung cancer.
Cigarette smoke delivers over 70 compounds with sufficient evidence for carcinogenicity in either laboratory animals or humans, according to evaluations by working groups of the International Agency for Research on Cancer.1,5 Among these, there is strong evidence from studies in laboratory animals and from epidemiologic investigations that the tobacco-specific nitrosamine 4-(methylnitrosamino)-1-(3-pyridyl)-1-butanone (NNK, 1, Figure 1) and polycyclic aromatic hydrocarbons (PAH) are important causes of lung cancer in smokers.6,7
Figure 1.
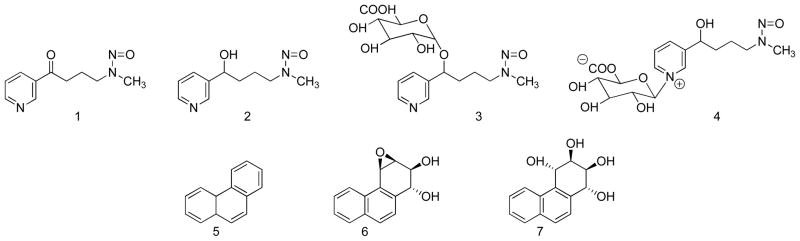
Structures of the compounds discussed in this paper. NNK (1), NNAL (2), NNAL-O-Gluc (3), NNAL-N-Gluc (4), phenanthrene (5), anti-phenanthrene-1,2-diol-3,4-epoxide (6), and PheT (7).
NNK is metabolized in smokers to 4-(methylnitrosamino)-1-(3-pyridyl)-1-butanol (NNAL, 2) and its O- and N-glucuronides, NNAL-O-Gluc (3) and NNAL-N-Gluc (4), which are excreted in urine.8 The sum of 2, 3, and 4, termed total NNAL, has been quantified as a carcinogen uptake biomarker in many studies of smokers,9–23 but we are aware of only one report in the literature in which free NNAL(2) and the individual glucuronides 3 and 4 have been measured.8 Quantitation of the individual glucuronides of NNAL is potentially very important as there are multiple forms of UGT enzymes that catalyze the formation of 3 and 4; differences among these forms in smokers could affect the carcinogenic outcome of NNK exposure.24–33
PAH are metabolized by multiple pathways including the formation of angular ring bay region diol epoxides which are widely considered to be major ultimate carcinogens of these compounds.34,35 Phenanthrene (5, Figure 1), generally regarded as a non-carcinogenic PAH, is the simplest member of this class of compounds which can form an angular ring bay region diol epoxide, exemplified by 6. This diol epoxide reacts with H2O to give phenanthrene tetraols, such as r-1,t-2,3,c-4-tetrahydroxy-1,2,3,4-tetrahydrophenanthrene (PheT, 7).36 Quantitation of PheT in smokers’ urine provides a biomarker of PAH exposure plus metabolic activation.37–42
In nested case-control studies within prospective epidemiologic investigations, both total NNAL and PheT have emerged as biomarkers of lung cancer risk, after controlling for other factors such as number of years of smoking and number of cigarettes smoked per day.7,43–45 These encouraging developments suggest that NNAL and its glucuronides as well as PheT might be useful as biomarkers to predict which smoker is at high risk for lung cancer. Establishing this would be a major step toward the development of a simple biomarker assay to identify high risk individuals, thus leading to improved approaches to lung cancer prevention. Large studies will be necessary to validate such potential biomarkers. Therefore, sensitive and accurate high throughput methods for quantitation of these metabolites are required.
In this paper, we describe high throughput liquid and gas chromatography-tandem mass spectrometry (LC-MS/MS and GC-MS/MS) methods for the analysis of 2, 3, 4 and 7 in human urine.
Experimental Procedures
Urine Samples
This study was approved by the University of Minnesota Institutional Review Board. The samples originated from the Multi-Ethnic Cohort Study, an epidemiologic investigation into differences in cancer risk among U.S. racial/ethnic groups, carried out by investigators at the University of Southern California and the University of Hawaii. All of the urine samples analyzed here were from smokers. The samples were collected from 2001 – 2006, stored at −80 °C, and aliquots shipped frozen to the University of Minnesota, where they were stored at −20 °C until analysis.
Analysis of NNAL and Its Glucuronides
Materials
NNAL, [13C6]NNAL, and [pyridine-D4]NNAL were obtained from Toronto Research Chemicals. Dulbecco’s PBS was procured from Invitrogen. β-Glucuronidase (recombinant, expressed in E. coli overproducing strain, catalogue # G8295) was obtained from Sigma-Aldrich. Glass vials (2 ml silane-treated), with or without fused inserts, were obtained from Chromtech. True Taper 96-well plates for sample hydrolysis and collection were from Analytical Sales & Service. Silicone cap mats to cover the 96-well plates during sample preparation and hydrolysis steps were procured from Phenomenex. Isolute SLE+ diatomaceous earth solid-phase extraction 96-well plates, 400 μL, were purchased from Biotage and used as received. A Cerex 96 well positive pressure processor and an 8 channel Eppendorf multipipetter were used to process the 96-well plates. Oasis MCX 10 mg 30 μm mixed mode cation exchange solid-phase extraction 96-well plates were obtained from Waters. Luna C18(2) 50 or 150 × 0.5 mm LC columns were purchased from Phenomenex. All other materials were obtained from UStores, University of Minnesota.
Analysis of NNAL, NNAL-N-Gluc, and NNAL-O-Gluc in smokers’ urine
Three sets of True Taper 96-well plates were prepared for each analysis (Scheme 1). The “free NNAL” plate (fraction 1) was charged with 80 μL urine and 0.1 pmol [13C6]NNAL in 250 μL PBS. To the “free NNAL plus NNAL-N-Gluc” plate (fraction 2) were added 60 μL urine and 0.1 pmol [13C6]NNAL in 50 μL 0.5N NaOH (0.27N final concentration). The “total NNAL” plate (fraction 3) was charged with 40 μL urine, 50 μL β-glucuronidase (1000 units) in PBS, and 0.1 pmol [13C6]NNAL in 250 μL PBS. Plates were capped with silicone cap mats for mixing steps. Some wells were used for positive control and blank samples.
Scheme 1.

Outline of the high throughput LC-MS/MS method for analysis of NNAL, NNAL-N-Gluc, and NNAL-O-Gluc in human urine. SLE, solid liquid extraction; SPE, solid-phase extraction.
The “free NNAL plus NNAL-N-Gluc” plate was incubated at 80 °C for 30 min, then adjusted to pH 7.0 with 250 μL 0.1N HCl in PBS. The “total NNAL” plate was incubated overnight with shaking at 37 °C. Plates were capped with silicone cap mats for these operations.
Subsequent steps, all involving analysis of NNAL, were identical for all plates. The first solid-phase extraction purification was carried out on the Isolute SLE+ plates. The contents of the True Taper plates were transferred by pipette to the Isolute SLE+ plates. The True Taper plates were then rinsed with 50 μL PBS, and the rinses were added to the Isolute SLE+ plates. A gentle pulse of N2 was applied to initiate flow of the aqueous sample past the hydrophobic frits. The plates were allowed to equilibrate for 5 min, then eluted by gravity successively with three 0.6 mL portions of CH2Cl2, and the eluants were collected in 96-well plates. The Isolute SLE+ plate was placed under a low N2 pressure to assist in the removal of the last CH2Cl2 eluant. The combined CH2Cl2 eluants in 96-well plates were concentrated to dryness on a Speedvac concentrator.
To the samples in their 96-well plates were added 0.2 mL 1N HCl, followed by sonication for 15 min. The second solid-phase extraction step was carried out on the Oasis MCX 96-well plates. All washes and elutions were accomplished by gravity supplemented with gentle N2 pressure when required. Conditioning of the plates was accomplished by successive addition of 1 mL MeOH followed by 2 mL H2O. The samples were then added and the plates were washed with an additional 50 μL 1N HCl. The plates were then washed successively with 250 μL 1N HCl, 250 μL MeOH, and 250 μL 90:5:5 H2O:MeOH:NH4OH (v/v/v). All of these washings were discarded. The final elution with 250 μL 35:60:5 H2O:MeOH:NH4OH (v/v/v) was collected in 96-well plates and concentrated to dryness overnight on a Speedvac. The samples were covered with a Silicone Cap Mat and stored at −20 °C until LC-MS/MS analysis.
LC-MS/MS analyses were carried out by positive ESI on Discovery 2 or Ultra triple quadrupole instruments (Thermo Scientific) equipped with Waters Nano Acquity or Agilent Capillary 1100 HPLC systems. For the analysis, 20 μL of 5 mM NH4OAc was added to each sample well. The samples were sonicated for 15 min and the plates were spun in a Speedvac to precipitate any particulates. Eight μL from each well was injected on the 50 × 0.5 mm Luna C18(2) column with a needle offset of 2 mm, a column temperature of 40 °C, and a flow rate of 15 μL/min of 30% MeOH. The column was washed with 90% MeOH for 9.5 min and 30% MeOH for 5 min after every 24th sample. The quadrupole resolution values were: Q1, m/z 0.2 and Q3, m/z 0.7, the ion transfer tube temperature was 250 °C, the scan width was m/z 0.2, the scan time was 0.2 sec, the spray voltage was 3000 V, and selected reaction monitoring was carried out at m/z 210.12 → m/z 93.14 for NNAL quantitation and m/z 216.14 → m/z 98.14 for [13C6]NNAL quantitation. Qualifier transitions were m/z 210.12 → m/z 180.16 for NNAL and m/z 216.14 → m/z 186.16 for [13C6]NNAL. Infusions of [pyridine-D4]NNAL were used for tuning. Some analysis were carried out on a 150 × 0.5 mm Luna C18(2) column using the same conditions. This longer column provided partial separation of (E)- and (Z)-rotamers, thus providing additional support for analyte identity.
NNAL in the samples was quantified from linear calibration curves relating the ratio of 6 varying amounts of NNAL (0.38 fmol/−0.19 pmol in 5 mM NH4OAc) and a constant amount of [13C6]NNAL (19 fmol) to the area ratio of the appropriate NNAL:[13C6]NNAL MS/MS transitions. Calibration curves were established before each set of LC-MS/MS analyses. The same sample of [13C6]NNAL used for constructing the calibration curve was also added to each sample as internal standard. The amount of free NNAL in each sample was the amount measured in fraction 1 (Scheme 1). The amount of NNAL-N-Gluc in each sample was the amount in fraction 2 minus the amount in fraction 1. The amount of NNAL-O-Gluc in each sample was the amount in fraction 3 minus the amount in fraction 2.
Analysis of PheT
Materials
PheT,41 [13C6]PheT,41,46 and [D10]PheT47 were prepared as described previously. β-Glucuronidase and arylsulfatase from Helix pomatia (100,000U β-glucuronidase/mL) was obtained from Roche Applied Science. Strata SDB-L (styrene-divinylbenzene) 50 mg/well, 100 μm, 260Å solid-phase extraction 96-well plates were purchased from Phenomenex. Square top V-bottom 96-well collection plates, polypropylene, 2mL, were procured from Analytical Sales and Services. Pierceable sealing mats, 96-square well, were from Phenomenex. Round bottom plates with 1.0 mL glass silanized inserts installed and Cap Mats with T/S septa were obtained from Microliter Analytical Supplies. GC vials (2 mL), with fused silanized 300 μL inserts and Teflon-lined screw caps as well as 4 mL silanized GC vials were purchased from Chromtech. bis-Trimethylsilyltrifluoroacetamide plus 1% trimethylchlorosilane (BSTFA-TMCS) was procured from Regis Technologies. All other supplies were obtained from UStores, University of Minnesota.
Analysis of PheT in Smokers’ Urine
A solution of β-glucuronidase and arylsulfatase (400 units) and [13C6]PheT (100 fmol) in 155 μL of 0.5M NaOAc buffer, pH 5, was prepared, and added to each well of a V-bottom 96-well collection plate, together with 100 μL of urine. Some wells were used for positive control and blank samples. The plate was covered with a sealing mat and incubated overnight with shaking at 37 °C.
Solid-phase extraction was carried out with the Strata SDB-L plates. The plates were conditioned and equilibrated with successive treatments by MeOH and H2O, 1 mL each. Then the contents of the 96-well plates from above were added to the Strata SDB-L plates, along with 100 μL H2O washings of each well. The plates were then successively washed with 1 mL of each of the following: 1% NH4OH:10% MeOH in H2O (v/v); H2O; 1% HCOOH:10% MeOH in H2O (v/v); and H2O. The analyte was eluted with 0.7 mL 50% MeOH in H2O (v/v), collected in the round bottom plate with glass inserts, and concentrated to dryness on a Speedvac.
The derivatization reagent was prepared by mixing BSTFA-TMCS (1.9 mL) and the derivatization and injection standard [D10]PheT (1.5 ng in 0.1 mL CH3CN) in a 4 mL silanized GC vial. The derivatization was carried out under anhydrous conditions to avoid crystallization of the by-products from reaction of BSTFA with H2O, which could interfere with subsequent injections of the analyte on the GC column. The collection plate containing the analyte was dried on a Speedvac for 5 min, followed by venting with dry N2. Each glass insert was purged with Ar for 10 sec, and the plate was covered tightly with Dura Seal polyethylene plastic wrap to form a good seal. The derivatization reagent (20 μL) was injected through the wrap into each glass insert. When addition was complete, the Dura Seal plastic was carefully removed, a Cap Mat was quickly applied and the vials were heated to 60 °C for 60 min, with mixing every 20 min. After the derivatization was complete, the vials, still attached to the Cap Mat, were placed in a custom drilled aluminum block and kept at 19 °C in the auto-sampler compartment. The custom block was used because the Triplus Auto Sampler could not be programmed to make the injection needle reach deeply enough into the vials.
GC-MS/MS was carried out with a Thermo Scientific TSQ Quantum GC triple quadrupole instrument in the negative ion chemical ionization (NICI) mode, with selected reaction monitoring at m/z 372.130 → m/z 210.70 for PheT-TMS, m/z 378.016 → m/z 216.070 for [13C6]PheT-TMS, and m/z 382.160 → m/z 220.070 for [D10]PheT-TMS. The instrument was equipped with a Triplus Auto Sampler, a Trace GC Ultra gas chromatograph fitted with a 30 m × 0.25 mm, 15 μm film thickness, DB-17MS column (Agilent Technologies) connected to a 0.53 mm × 3 m deactivated fused silica pre-column with a Press Tight fused silica union (Agilent Technologies). A Restek Sky inlet liner, splitless, 5 mm (i.d.) × 8 mm (o.d.) × 105 mm was used in the inection port. The transfer line temperature was 280 °C. A Merlin septum (Thermo) was used. Two μL of each derivatized sample was injected. The injection port temperature was 250 °C and the splitless injection mode was used. The injection technique consisted of taking up 0.5 μL acetonitrile in the syringe followed by 2 μL of the sample. The temperature program was 80 °C for 1 min, then 35 °C/min to 200 °C, then immediately 3°C/min to 215 °C, then immediately 35 °C/min to 280 °C, then hold for 2 min. The carrier gas was He at a constant flow of 1.2 mL/min. The NICI-MS/MS conditions were as follows: CI gas, Ar at 1.1 mL/min; source temperature, 200 °C; emission current 200 μA. Selected reaction monitoring was carried out with a collision energy of 12 eV, electron energy of 100 eV, scan width of 0.03 m/z, Q1 peak width of 0.7 units and Ar collision gas at 1.0 mTorr. The MS filament was turned on at 9.75 min and off at 11.25 min.
PheT and [13C6]PheT were quantified as their TMS derivatives from linear calibration curves relating the ratio of 6 varying amounts of PheT (0.2 – 80 fmol) and a constant amount of [13C6]PheT (20 fmol) to the area ratio of the appropriate PheT-TMS:[13C6]PheT-TMS MS/MS transitions. The standards were made up in isopropyl alcohol, which was subsequently removed on a SpeedVac. The standards were then silylated with BSTFA. Calibration curves were established before each set of GC-MS/MS analyses. The same sample of [13C6]PheT used for constructing the calibration curve was also added to each sample as internal standard. [D10]PheT-TMS peaks were quantified to monitor derivatization efficiency and GC-MS/MS performance.
Results
The method for analysis of free NNAL (2), NNAL-O-Gluc (3) and NNAL-N-Gluc (4) is summarized in Scheme 1. This method was developed for application to small urine samples. In the study reported here, 180 μL was available for analysis of the three compounds. The sample was divided into three fractions: 80 μL for analysis of free NNAL (fraction 1), 60 μL for analysis of free NNAL plus NNAL-N-Gluc (fraction 2), and 40 μL for analysis of total NNAL (fraction 3). These volume distributions were determined based on the expected amount of analyte in each fraction. We have previously shown that NNAL-N-Gluc is quantitatively converted to free NNAL by treatment with NaOH, but NNAL-O-Gluc is unaffected by this treatment. 8 Both NNAL-N-Gluc and NNAL-O-Gluc are completely converted to free NNAL by treatment with β-glucuronidase.8 Therefore, base and enzyme treatments were incorporated into the method with each of the three fractions ultimately producing free NNAL, which was quantified with reference to the internal standard [13C6]NNAL. Amounts of free NNAL, NNAL-N-Gluc, and NNAL-O-Gluc were then calculated as shown in Scheme 1. The base and enzyme treatments were carried out in 96-well plates, each of which contained 2 – 4 positive control samples and 2–3 H2O blanks for assessment of assay performance.
Two 96-well format purification steps were used for each of the three fractions. The first was performed with supported liquid extraction plates and the second with mixed mode reverse-phase/cation exchange solid-phase extraction plates. The eluants were collected and analyzed by LC-MS/MS, using a 96-well auto-injection system and a 50 mm LC column. Typical LC-MS/MS traces for NNAL and [13C6]NNAL in each fraction are illustrated in Figure 2. Clean, quantifiable peaks were observed at the correct retention times. For analysis of certain samples, we also used a 150 mm column which partially separated the (E)- and (Z)-rotamers of NNAL and [13C6]NNAL, as illustrated in Figure 3. The results obtained with the 150 mm column agreed with those using the 50 mm column. Therefore, the 50 mm column was used for analysis of most of the samples reported here.
Figure 2.

LC-ESI-MS/MS chromatograms obtained upon analysis of Fraction 1 (Scheme 1) of a human urine sample for free NNAL(2), using the 50 mm column. A and B, monitoring of m/z 210 → m/z 93 for quantitation of NNAL and m/z 216 → m/z 98 for the internal standard [13C6]NNAL. C and D, qualifier ions for NNAL, m/z 210 → m/z 180 and [13C6]NNAL, m/z 216 → m/z 186.
Figure 3.

LC-ESI-MS/MS chromatograms obtained upon analysis of Fraction 1 (Scheme 1) of a human urine sample for free NNAL(2), using the 150 mm column. A and B, monitoring of m/z 210 → m/z 93 for quantitation of NNAL and m/z 216 → m/z 98 for the internal standard [13C6]NNAL. C and D, qualifier ions for NNAL, m/z 210 → m/z 180 and [13C6]NNAL, m/z 216 → m/z 186. The E- (retention time 7.86 min) and Z- (retention time 8.07 min) rotamers of NNAL are partially separated.
Calibration curves for NNAL were linear in the range measured (R2 = 0.99). The on-column detection limits were 0.4 fmol for NNAL and the lower limit of quantitation was 100 fmol/mL for NNAL in urine samples. Accuracy was determined by adding 6 increasing amounts of NNAL to a non-smokers’ urine and carrying out the analysis. The correlation coefficient of the expected NNAL concentration vs. the measured value was R2 = 1.00 and the accuracy was 94.1% (Figure 4). Precision was evaluated from positive control samples included with each 96-well plate. The precision data are summarized in Table 1. The relatively large inter-day value for NNAL-N-Gluc results from subtraction of Fraction 1 from Fraction 2, each of which had intermediate inter-day precision values.
Figure 4.

Determination of the accuracy of the NNAL analysis. A non-smokers’ urine, containing no detectable NNAL, was spiked with 6 increasing amounts of NNAL and the analysis was carried out as described in Materials and Methods. The added and determined amounts correlated, R2 = 1.00 and the accuracy was 94.1%.
Table 1.
Inter-day and intra-day precision (CV, %)
| Fraction 1 Free NNAL | Fraction 2 free NNAL plus NNAL-N-Gluc | Fraction 3 total NNAL | NNAL-N-Gluc | NNAL-O-Gluc | |
|---|---|---|---|---|---|
| Inter-daya,b | 6.4 | 5.7 | 2.7 | 14 | 5.5 |
| Intra-dayc | 2.1 | 3.0 | 1.2 | 8.7 | 3.8 |
Based on positive control values (N = 83 for inter-day and 57 for intra-day).
Average levels of NNAL in Fractions 1, 2, and 3 were 0.441, 0.737, and 1.45 pmol/mL, respectively
Based on 18 plates containing at least 3 or 4 positive controls; each plate was analyzed on the same day.
The amount of total NNAL in the urine of our smokers was (mean ± S.D.) 1.65 ± 2.13 pmol/ml (N = 2641). Free NNAL, NNAL-N-Gluc, and NNAL-O-Gluc represented 31 ± 11%, 22 ± 14%, and 48 ± 15% of total NNAL, respectively.
The analysis of PheT described here was also designed for processing of large numbers of urine samples, in this case starting with 100 μL of urine. [13C6]PheT was used as the internal standard and [D10]PheT as a standard to monitor derivatization efficiency and GC-NICI-MS/MS performance. The urine sample was partially purified by solid-phase extraction with styrene-divinylbenzene plates in a 96 well format. The relatively non-polar PheT analyte was retained on the plates during washes with base, acid and H2O, then eluted with 50% aqueous MeOH. This simple enrichment step was adequate for the analysis. We also evaluated Strata X N-vinylpyrrolidone polymer plates for this procedure, but the styrene-divinylbenzene sorbent produced better results.
For quantitation, PheT and internal standards were converted to their TMS derivatives by reaction with BSTFA-TMCS. Clean chromatograms were consistently produced in the analysis of the 96-well plates by GC-NICI-MS/MS. Typical chromatograms illustrating analyte, internal standard, and injection/derivatization standard are presented in Figure 5.
Figure 5.

GC-NICI-MS/MS chromatograms obtained upon analysis of a human urine sample for tetra-TMS derivatives of: (A) PheT (7), m/z 372.130 → m/z 210.07; (B) internal standard [13C6]PheT, m/z 378.016 → m/z 216.070; and (C) injection and derivatization standard [D10]PheT-TMS, m/z 382.160 → m/z 220.070.
Calibration curves for PheT-TMS and [13C6]PheT-TMS were linear in the range measured (R2 = 0.99). The on column detection limit for PheT-TMS was 0.02 fmol of standard injected and the lower limit of quantitation was 100 fmol/mL for PheT in urine samples.
The accuracy of the method was determined by adding 6 increasing amounts of PheT to a pooled smokers’ urine sample. The correlation coefficient of the expected PheT concentration vs. the measured value was R2 = 1.00 and the accuracy was 95% (Figure 6). Precision was evaluated from the positive control samples included with each 96-well plate, containing 2.16 pmol/mL PheT. Intra-day precision was 2.9% (N = 30) while inter-day precision was 3.7% (N = 30). The amount of PheT in the smokers’ urine samples analyzed here was (mean ± S.D.) 1.43 ± 2.16 pmol/mL urine (N = 2613).
Figure 6.
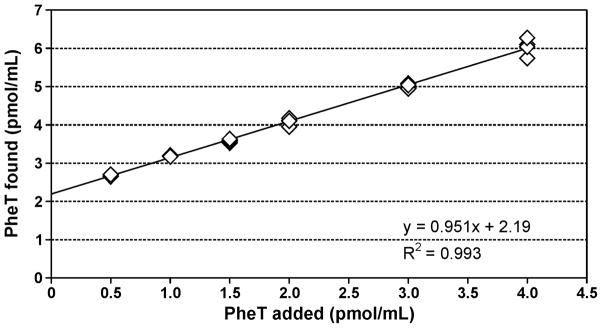
Determination of the accuracy of the PheT analysis. A pooled smokers’ urine sample containing 2199 fmol/mL PheT was spiked with 6 increasing amounts of PheT and the analysis was carried out as described in Materials and Methods. Each point is the mean of 4 determinations. The added and determined amounts correlated, R2 = 1.00, and the accuracy was 95%. The y-intercept agrees with the amount of PheT in the pooled smokers’ urine sample.
Discussion
In this paper, we report new high throughput mass spectrometric methods for the analysis of free NNAL (2), NNAL-O-Gluc (3), NNAL-N-Gluc (4) and PheT (7) in small urine samples from smokers. We have demonstrated that these methods are accurate and precise and that they can be applied to large numbers of samples, more than 2600 for each analyte. These results are important because they ensure the practicality of further large scale molecular epidemiology studies which can be designed to confirm the relationship of these analytes to lung cancer susceptibility in smokers, thus potentially providing a new pathway to prevention of this disease. Our study is the first to report the design and application of high throughput methods for analysis of these metabolites. Further, only one previous study reported human urinary free NNAL, NNAL-N-Gluc, and NNAL-O-Gluc separately, using gas chromatography-nitrosamine selective detection (GC-TEA), and starting with 10 mL of urine.
Multiple approaches to the analysis of NNAL and its glucuronides in human urine have been reported and reviewed.10–12 Two main methods have been used. Our original GC-TEA method, first reported two decades ago, then by stages modified and improved, has served well but would not be applicable to a study of this size with small urine samples.9,48 In the meantime, a variety of different LC-MS/MS methods have appeared using different strategies for sample enrichment and purification and NNAL detection including mixed mode cation exchange solid-phase extraction, molecular imprinted polymer columns, and derivatization approaches of various types.12–23 The LC-MS/MS methods have far greater sensitivity for detection of NNAL than does GC-TEA and are therefore applicable to smaller urine volumes. Some of the LC-MS/MS methods have been applied in large studies, including the NHANES study of 6599 participants23,49 and the “Total Exposure Study” of 3585 smokers and 1077 non-smokers.50 None of these studies described the use of a 96-well format approach for processing large numbers of samples.
In previous large studies, levels of total NNAL were 1.43 pmol/mL (geometric mean) in the NHANES study of 1373 smokers,49 2.10 nmol/24 hr (weighted mean) in the “Total Exposure Study” of 3585 smokers,50 and 1.12 pmol/mL (geometric mean) in our combined studies of 1088 smokers.51 These results are quite comparable to the amount of total NNAL observed in the current study, which was 1.65 ± 2.13 pmol/ml (arithmetic mean).
In our previous study of only 10 smokers, carried out by GC-TEA, the percentages of free NNAL, NNAL-N-Gluc, and NNAL-O-Gluc were 41 ± 17%, 27 ± 6.2%, and 32 ± 18%, respectively.8 That method was analytically validated and can be considered reliable, although the approach was somewhat different from that described here, and would certainly not be applicable on this scale. The amount of free NNAL in that study was considerably higher than observed here (41 vs. 31% of total NNAL) and the amount of NNAL-O-Gluc was lower (32 vs 48%) whereas the percentages of NNAL-N-Gluc were similar (27 vs. 22%). The differences in free NNAL and NNAL-O-Gluc between the two studies are probably due to the small number of samples analyzed in the earlier study. It is unlikely that the relatively large inter-day variation in NNAL-N-Gluc observed here contributed to these differences, as the NNAL-N-Gluc percentages were similar in the two studies.
Only small volumes of urine were available to us for the NNAL analyses described here and this challenged our ability to obtain acceptable values of accuracy and precision. This was particularly true for NNAL-N-Gluc as it was present in the smallest amounts and its levels were calculated by subtraction of free NNAL from the base-treated fraction 2, thus introducing additional potential sources of error. Where possible, we recommend the use of larger volumes of urine for the analyses described here. We have applied the 96-well total NNAL assay to 250 μL samples of human urine in other ongoing studies. With reagents scaled accordingly, the assay produces results with predictably larger peaks for total NNAL, greater signal to noise ratios, and better detection limits.
The method for PheT, which we describe here, has exceptional sensitivity and is readily applicable to large numbers of samples. It is worth noting however that a number of technical problems had to be solved before this method could be applied in a study such as the one described here. Our original approach used boronate solid-phase extraction in a 96-well format, based on our earlier success with conventional boronate cartridges as a purification step in analysis of urinary PheT.42 The 96-well boronate solid-phase extraction strategy worked well and was validated by accuracy and precision experiments (data not shown). However, for unexplained reasons, the commercially obtained boronate solid-phase extraction plates, even on first use, became ineffective for sample purification, and the method had to be abandoned. The boronate 96-well plate method, similar to the one described here in most other respects, and validated before the problem presented itself, was applied to 900 samples. A set of those samples was also analyzed by the present method and the results agreed well, R2 = 0.9. Therefore, we have included those data in the overall average of PheT in 2613 smokers.
A second problem, which arose during the processing of the PheT samples, was crystallization of material in the samples following derivatization with BSTFA-TMCS. These crystals are presumably BSTFA – H2O reaction products due to the presence of humid air in the reaction vials. The crystals interfered with sample injection. This problem was solved by excluding moisture during the derivatization process. A third problem involved the injection technique. When the hot needle technique was used, a pyrolysate residue built up on the needle, leading in some cases to analyte carryover. This problem was solved by switching to a rapid solvent flush method of injection.
The amount of PheT in the urine of our smokers, 1.43 ± 2.16 pmol/mL, is somewhat lower than observed in our previous studies. In one study of 363 smokers, the amount of PheT was 5.58 ± 6.48 pmol/mL urine (mean ± S.D.), while in another investigation of 31 smokers, we observed 4.58 ± 2.95 pmol/mg creatinine.36,40 The subjects in the current study were fairly light smokers, smoking less than 15 cigarettes per day, which could contribute to the lower amount of PheT observed here. However, the amount of total NNAL in these urine samples appears to be quite consistent with previous studies. There are important sources of phenanthrene exposure other than smoking, such as diet and polluted air, but these sources do not contribute to total NNAL. There may be differences in dietary patterns or environmental exposures between the subjects in this study and the previous one. These aspects require further investigation.
The samples analyzed here are part of a large phenotyping and genotyping study being conducted within the Multi-Ethnic Cohort Study, an epidemiologic investigation which has demonstrated major differences among U.S. racial/ethnic groups in the risk of lung cancer associated with cigarette smoking.52 The hypothesis to be tested is that these differences are related to common genetic variants that affect internal dose and metabolism of nicotine and tobacco carcinogens. Statistical analysis of the data reported here, together with appropriate genetic data from a genome-wide association study, is in progress and will be reported separately.
In summary, we describe robust new methods for the rapid analysis of large numbers of small human urine samples for NNAL (2), NNAL-O-Gluc (3), NNAL-N-Gluc (4) and PheT (7). We expect that these methods will be applicable in large scale studies of smokers to further define the potential utility of these metabolites of NNK and PAH as potential biomarkers of lung cancer susceptibility in smokers.
Acknowledgments
Funding. CA-138338, CA-81301 and CA-92025 from the National Cancer Institute. Mass spectrometry was carried out in the Analytical Biochemistry Shared Resource of the Masonic Cancer Center, University of Minnesota, funded in part by Cancer Center Support Grant CA-77598.
We thank Peter Villalta and Brock Matter for help with mass spectrometry, and Bob Carlson for editorial assistance.
Abbreviations
- NNAL
4-(methylnitrosamino)-1-(3-pyridyl)-1-butanone
- PheT
r-1,t-2,3,c-4-tetrahydroxy-1,2,3,4-tetrahydrophenanthrene
- BSTFA-TMCS
bis-trimethylsilyltrifuoroacetamide plus 1% trimethylchlorosilane
- GC-TEA
gas chromatography-thermal energy analyzer nitrosamine-specific detection
Reference List
- 1.International Agency for Research on Cancer. Tobacco Smoke and Involuntary Smoking. IARC Monographs on the Evaluation of Carcinogenic Risks to Humans. 2004;83:33–1187. [PMC free article] [PubMed] [Google Scholar]
- 2.Gilpin EA, Pierce JP. Demographic differences in patterns in the incidence of smoking cessation: United States 1950–1990. Ann Epidemiol. 2002;12:141–150. doi: 10.1016/s1047-2797(01)00266-6. [DOI] [PubMed] [Google Scholar]
- 3.Fiore MC, Jaen CR, Baker TB, Bailey WC, Benowitz NL, Curry SJ, Dorfman SF, Froehlicher ES, Goldstein MG, Healton C, Henderson PN, Heyman RB, Koh HK, Kottke TE, Lando HA, Mecklenburg RE, Mermelstein R, Mullen PD, Orleans CT, Robinson L, Stitzer ML, Tommasello AC, Villejo L, Wewers ME. Clinical Practice Guideline. U.S. Department of Health and Human Services, Public Health Service; Rockville, MD: 2008. Treating Tobacco Use and Dependence: 2008 Update. [Google Scholar]
- 4.Shafey O, Eriksen MP, Ross H, Mackay J. The Tobacco Atlas. 3. American Cancer Society and World Lung Foundation; Atlanta, GA: 2009. [Google Scholar]
- 5.Hecht SS. Research opportunities related to establishing standards for tobacco products under the Family Smoking Prevention and Tobacco Control Act. Nicotine Tob Res. 2012;14:18–28. doi: 10.1093/ntr/ntq216. [DOI] [PMC free article] [PubMed] [Google Scholar]
- 6.Hecht SS. Tobacco smoke carcinogens and lung cancer. J Natl Cancer Inst. 1999;91:1194–1210. doi: 10.1093/jnci/91.14.1194. [DOI] [PubMed] [Google Scholar]
- 7.Hecht SS, Murphy SE, Stepanov I, Nelson HH, Yuan JM. Tobacco smoke biomarkers and cancer risk among male smokers in the Shanghai Cohort Study. Cancer Lett. 2012;334:34–38. doi: 10.1016/j.canlet.2012.07.016. [DOI] [PMC free article] [PubMed] [Google Scholar]
- 8.Carmella SG, Le K, Upadhyaya P, Hecht SS. Analysis of N- and O-glucuronides of 4-(methylnitrosamino)-1-(3- pyridyl)-1-butanol (NNAL) in human urine. Chem Res Toxicol. 2002;15:545–550. doi: 10.1021/tx015584c. [DOI] [PubMed] [Google Scholar]
- 9.Carmella SG, Akerkar S, Hecht SS. Metabolites of the tobacco-specific nitrosamine 4-(methylnitrosamino)-1-(3-pyridyl)-1-butanone in smokers’ urine. Cancer Res. 1993;53:721–724. [PubMed] [Google Scholar]
- 10.Hecht SS. Human urinary carcinogen metabolites: biomarkers for investigating tobacco and cancer. Carcinogenesis. 2002;23:907–922. doi: 10.1093/carcin/23.6.907. [DOI] [PubMed] [Google Scholar]
- 11.International Agency for Research on Cancer. IARC Monographs on the Evaluation of Carcinogenic Risks to Humans. Vol. 89. IARC; Lyon, FR: 2007. Smokeless tobacco and tobacco-specific nitrosamines; pp. 41–583. [PMC free article] [PubMed] [Google Scholar]
- 12.Shah KA, Karnes HT. A review of the analysis of tobacco-specific nitrosamines in biological matrices. Crit Rev Toxicol. 2010;40:305–327. doi: 10.3109/10408440903394435. [DOI] [PubMed] [Google Scholar]
- 13.Bhat SH, Gelhaus SL, Mesaros C, Vachani A, Blair IA. A new liquid chromatography/mass spectrometry method for 4-(methylnitrosamino)-1-(3-pyridyl)-1-butanol (NNAL) in urine. Rapid Commun Mass Spectrom. 2011;25:115–121. doi: 10.1002/rcm.4824. [DOI] [PMC free article] [PubMed] [Google Scholar]
- 14.Kavvadias D, Scherer G, Urban M, Cheung F, Errington G, Shepperd J, McEwan M. Simultaneous determination of four tobacco-specific N-nitrosamines (TSNA) in human urine. J Chromatogr B Analyt Technol Biomed Life Sci. 2009;877:1185–1192. doi: 10.1016/j.jchromb.2009.03.009. [DOI] [PubMed] [Google Scholar]
- 15.Florek E, Piekoszewski W, Basior A, Merritt AT, Mazela J, Lechowicz W, Kornacka MK, Kramer L. Effect of maternal tobacco smoking or exposure to second-hand smoke on the levels of 4-(methylnitrosamino)-1-(3-pyridyl)-1-butanol (NNAL) in urine of mother and the first urine of newborn. J Physiol Pharmacol. 2011;62:377–383. [PubMed] [Google Scholar]
- 16.Hou H, Zhang X, Tian Y, Tang G, Liu Y, Hu Q. Development of a method for the determination of 4-(methylnitrosamino)-1-(3-pyridyl)-1-butanol in urine of nonsmokers and smokers using liquid chromatography/tandem mass spectrometry. J Pharm Biomed Anal. 2012;63:17–22. doi: 10.1016/j.jpba.2012.01.028. [DOI] [PubMed] [Google Scholar]
- 17.Byrd GD, Ogden MW. Liquid chromatographic/tandem mass spectrometric method for the determination of the tobacco-specific nitrosamine metabolite NNAL in smokers’ urine. J Mass Spectrom. 2003;38:98–107. doi: 10.1002/jms.406. [DOI] [PubMed] [Google Scholar]
- 18.Xia Y, McGuffey JE, Bhattacharyya S, Sellergren B, Yilmaz E, Wang L, Bernert JT. Analysis of the tobacco-specific nitrosamine 4-(methylnitrosamino)-1-(3-pyridyl)-1-butanol in urine by extraction on a molecularly imprinted polymer column and liquid chromatography/atmospheric pressure ionization tandem mass spectrometry. Anal Chem. 2005;77:7639–7645. doi: 10.1021/ac058027u. [DOI] [PubMed] [Google Scholar]
- 19.Stepanov I, Upadhyaya P, Feuer R, Jensen J, Hatsukami DK, Hecht SS. Extensive metabolic activation of the tobacco-specific carcinogen 4-(methylnitrosamino)-1-(3-pyridyl)-1-butanone in smokers. Cancer Epidemiol Biomarkers Prev. 2008;17:1764–1773. doi: 10.1158/1055-9965.EPI-07-2844. [DOI] [PMC free article] [PubMed] [Google Scholar]
- 20.Xia Y, Bernert JT. Stability of the tobacco-specific nitrosamine 4-(methylnitrosamino)-1-(3-pyridyl)-1-butanol in urine samples stored at various temperatures. J Anal Toxicol. 2010;34:411–415. doi: 10.1093/jat/34.7.411. [DOI] [PubMed] [Google Scholar]
- 21.Roethig HJ, Zedler BK, Kinser RD, Feng S, Nelson BL, Liang Q. Short-term clinical exposure evaluation of a second-generation electrically heated cigarette smoking system. J Clin Pharmacol. 2007;47:518–530. doi: 10.1177/0091270006297686. [DOI] [PubMed] [Google Scholar]
- 22.Shepperd CJ, Eldridge AC, Mariner DC, McEwan M, Errington G, Dixon M. A study to estimate and correlate cigarette smoke exposure in smokers in Germany as determined by filter analysis and biomarkers of exposure. Regul Toxicol Pharmacol. 2009;55:97–109. doi: 10.1016/j.yrtph.2009.06.006. [DOI] [PubMed] [Google Scholar]
- 23.Bernert JT, Pirkle JL, Xia Y, Jain RB, Ashley DL, Sampson EJ. Urine concentrations of a tobacco-specific nitrosamine carcinogen in the U.S. population from secondhand smoke exposure. Cancer Epidemiol Biomarkers Prev. 2010;19:2969–2977. doi: 10.1158/1055-9965.EPI-10-0711. [DOI] [PubMed] [Google Scholar]
- 24.Ren Q, Murphy SE, Dannenberg AJ, Park JY, Tephyl TR, Lazarus P. Glucuronidation of the lung carcinogen 4-(methylnitrosamino)-1-(3-pyridyl)-1-butanol (NNK) and its dose-dependent excretion in the urine of mice and rats. Drug Metab Dispos. 1999;27:1010–1016. [PubMed] [Google Scholar]
- 25.Ren Q, Murphy SE, Zheng Z, Lazarus P. O-Glucuronidation of the lung carcinogen 4-(methylnitrosamino)-1-(3-pyridyl)-1-butanol (NNAL) by human UDP-glucuronosyltransferases 2B7 and 1A9. Drug Metab Dispos. 2000;28:1352–1360. [PubMed] [Google Scholar]
- 26.Wiener D, Fang JL, Dossett N, Lazarus P. Correlation between UDP-glucuronosyltransferase genotypes and 4-(methylnitrosamino)-1-(3-pyridyl)-1-butanone glucuronidation phenotype in human liver microsomes. Cancer Res. 2004;64:1190–1196. doi: 10.1158/0008-5472.can-03-3219. [DOI] [PubMed] [Google Scholar]
- 27.Wiener D, Doerge DR, Fang JL, Upadhyaya P, Lazarus P. Characterization of N-glucuronidation of the lung carcinogen 4-(methylnitrosamino)-1-(3-pyridyl)-1-butanol (NNAL) in human liver: importance of UDP-glucuronosyltransferase 1A4. Drug Metab Dispos. 2004;32:72–79. doi: 10.1124/dmd.32.1.72. [DOI] [PubMed] [Google Scholar]
- 28.Lazarus P, Zheng Y, Aaron RE, Muscat JE, Wiener D. Genotype-phenotype correlation between the polymorphic UGT2B17 gene deletion and NNAL glucuronidation activities in human liver microsomes. Pharmacogenet Genomics. 2005;15:769–778. doi: 10.1097/01.fpc.0000175596.52443.ef. [DOI] [PubMed] [Google Scholar]
- 29.Gallagher CJ, Muscat JE, Hicks AN, Zheng Y, Dyer AM, Chase GA, Richie J, Lazarus P. The UDP-glucuronosyltransferase 2B17 gene deletion polymorphism: sex-specific association with urinary 4-(methylnitrosamino)-1-(3-pyridyl)-1-butanol glucuronidation phenotype and risk for lung cancer. Cancer Epidemiol Biomarkers Prev. 2007;16:823–828. doi: 10.1158/1055-9965.EPI-06-0823. [DOI] [PubMed] [Google Scholar]
- 30.Chen G, Dellinger RW, Sun D, Spratt TE, Lazarus P. Glucuronidation of tobacco-specific nitrosamines by UGT2B10. Drug Metab Dispos. 2008;36:824–830. doi: 10.1124/dmd.107.019406. [DOI] [PMC free article] [PubMed] [Google Scholar]
- 31.Chen G, Dellinger RW, Gallagher CJ, Sun D, Lazarus P. Identification of a prevalent functional missense polymorphism in the UGT2B10 gene and its association with UGT2B10 inactivation against tobacco-specific nitrosamines. Pharmacogenet Genomics. 2008;18:181–191. doi: 10.1097/FPC.0b013e3282f4dbdd. [DOI] [PubMed] [Google Scholar]
- 32.Balliet RM, Chen G, Dellinger RW, Lazarus P. UDP-glucuronosyltransferase 1A10: activity against the tobacco-specific nitrosamine, 4-(methylnitrosamino)-1-(3-pyridyl)-1-butanol, and a potential role for a novel UGT1A10 promoter deletion polymorphism in cancer susceptibility. Drug Metab Dispos. 2010;38:484–490. doi: 10.1124/dmd.109.030569. [DOI] [PMC free article] [PubMed] [Google Scholar]
- 33.Bushey RT, Chen G, Blevins-Primeau AS, Krzeminski J, Amin S, Lazarus P. Characterization of UDP-glucuronosyltransferase 2A1 (UGT2A1) variants and their potential role in tobacco carcinogenesis. Pharmacogenet Genomics. 2011;21:55–65. doi: 10.1097/FPC.0b013e328341db05. [DOI] [PMC free article] [PubMed] [Google Scholar]
- 34.Luch A, Baird WM. Metabolic activation and detoxification of polycyclic aromatic hydrocarbons. In: Luch A, editor. The carcinogenic effects of polycyclic aromatic hydrocarbons. Imperial College Press; London: 2005. pp. 19–96. [Google Scholar]
- 35.International Agency for Research on Cancer. IARC Monographs on the Evaluation of Carcinogenic Risks to Humans. Vol. 92. IARC; Lyon, FR: 2010. Some Non-Heterocyclic Polycyclic Aromatic Hydrocarbons and Some Related Exposures; pp. 35–818. [PMC free article] [PubMed] [Google Scholar]
- 36.Hecht SS, Chen M, Yagi H, Jerina DM, Carmella SG. r-1,t-2,3,c-4-Tetrahydroxy-1,2,3,4-tetrahydrophenanthrene in human urine: a potential biomarker for assessing polycyclic aromatic hydrocarbon metabolic activation. Cancer Epidemiol Biomarkers Prev. 2003;12:1501–1508. [PubMed] [Google Scholar]
- 37.Zhong Y, Carmella SG, Upadhyaya P, Hochalter JB, Rauch D, Oliver A, Jensen J, Hatsukami D, Wang J, Zimmerman C, Hecht SS. Immediate consequences of cigarette smoking: rapid formation of polycyclic aromatic hydrocarbon diol epoxides. Chem Res Toxicol. 2011;24:246–252. doi: 10.1021/tx100345x. [DOI] [PMC free article] [PubMed] [Google Scholar]
- 38.Zhong Y, Wang J, Carmella SG, Hochalter JB, Rauch D, Oliver A, Jensen J, Hatsukami DK, Upadhyaya P, Zimmerman C, Hecht SS. Metabolism of [D10]phenanthrene to tetraols in smokers for potential lung cancer susceptibility assessment: comparison of oral and inhalation routes of administration. J Pharmacol Exp Ther. 2011;338:353–361. doi: 10.1124/jpet.111.181719. [DOI] [PMC free article] [PubMed] [Google Scholar]
- 39.Hecht SS, Chen M, Yoder A, Jensen J, Hatsukami D, Le C, Carmella SG. Longitudinal study of urinary phenanthrene metabolite ratios: effect of smoking on the diol epoxide pathway. Cancer Epidemiol Biomarkers Prev. 2005;14:2969–2974. doi: 10.1158/1055-9965.EPI-05-0396. [DOI] [PubMed] [Google Scholar]
- 40.Hecht SS, Carmella SG, Yoder A, Chen M, Li Z, Le C, Jensen J, Hatsukami DK. Comparison of polymorphisms in genes involved in polycyclic aromatic hydrocarbon metabolism with urinary phenanthrene metabolite ratios in smokers. Cancer Epidemiol Biomarkers Prev. 2006;15:1805–1811. doi: 10.1158/1055-9965.EPI-06-0173. [DOI] [PubMed] [Google Scholar]
- 41.Hochalter JB, Zhong Y, Han S, Carmella SG, Hecht SS. Quantitation of a minor enantiomer of phenanthrene tetraol in human urine: correlations with levels of overall phenanthrene tetraol, benzo[a]pyrene tetraol, and 1-hydroxypyrene. Chem Res Toxicol. 2011;24:262–268. doi: 10.1021/tx100391z. [DOI] [PMC free article] [PubMed] [Google Scholar]
- 42.Hecht SS, Carmella SG, Villalta PW, Hochalter JB. Analysis of phenanthrene and benzo[a]pyrene tetraol enantiomers in human urine: relevance to the bay region diol epoxide hypothesis of benzo[a]pyrene carcinogenesis and to biomarker studies. Chem Res Toxicol. 2010;23:900–908. doi: 10.1021/tx9004538. [DOI] [PMC free article] [PubMed] [Google Scholar]
- 43.Church TR, Anderson KE, Caporaso NE, Geisser MS, Le C, Zhang Y, Benoit AR, Carmella SG, Hecht SS. A prospectively measured serum biomarker for a tobacco-specific carcinogen and lung cancer in smokers. Cancer Epidemiol Biomarkers Prev. 2009;18:260–266. doi: 10.1158/1055-9965.EPI-08-0718. [DOI] [PMC free article] [PubMed] [Google Scholar]
- 44.Yuan JM, Koh WP, Murphy SE, Fan Y, Wang R, Carmella SG, Han S, Wickham K, Gao YT, Yu MC, Hecht SS. Urinary levels of tobacco-specific nitrosamine metabolites in relation to lung cancer development in two prospective cohorts of cigarette smokers. Cancer Res. 2009;69:2990–2995. doi: 10.1158/0008-5472.CAN-08-4330. [DOI] [PMC free article] [PubMed] [Google Scholar]
- 45.Yuan JM, Gao YT, Murphy SE, Carmella SG, Wang R, Zhong Y, Moy KA, Davis AB, Tao L, Chen M, Han S, Nelson HH, Yu MC, Hecht SS. Urinary levels of cigarette smoke constituent metabolites are prospectively associated with lung cancer development in smokers. Cancer Res. 2011;71:6749–6757. doi: 10.1158/0008-5472.CAN-11-0209. [DOI] [PMC free article] [PubMed] [Google Scholar]
- 46.Hecht SS, Villalta PW, Hochalter JB. Analysis of phenanthrene diol epoxide mercapturic acid detoxification products in human urine: relevance to molecular epidemiology studies of glutathione-S-transferase polymorphisms. Carcinogenesis. 2008;29:937–943. doi: 10.1093/carcin/bgn015. [DOI] [PMC free article] [PubMed] [Google Scholar]
- 47.Carmella SG, Yoder A, Hecht SS. Combined analysis of r-1,t-2,3,c-4-tetrahydroxy-1,2,3,4-tetrahydrophenanthrene and 4-(methylnitrosamino)-1-(3-pyridyl)-1-butanol in smokers’ plasma. Cancer Epidemiol Biomarkers Prev. 2006;15:1490–1494. doi: 10.1158/1055-9965.EPI-06-0199. [DOI] [PubMed] [Google Scholar]
- 48.Church TR, Anderson KE, Le C, Zhang Y, Kampa DM, Benoit AR, Yoder AR, Carmella SG, Hecht SS. Temporal stability of urinary and plasma biomarkers of tobacco smoke exposure among cigarette smokers. Biomarkers. 2010;15:345–352. doi: 10.3109/13547501003753881. [DOI] [PMC free article] [PubMed] [Google Scholar]
- 49.Xia Y, Bernert JT, Jain RB, Ashley DL, Pirkle JL. Tobacco-specific nitrosamine 4-(methylnitrosamino)-1-(3-pyridyl)-1-butanol (NNAL) in smokers in the United States: NHANES 2007–2008. Biomarkers. 2011;16:112–119. doi: 10.3109/1354750X.2010.533288. [DOI] [PubMed] [Google Scholar]
- 50.Roethig HJ, Munjal S, Feng S, Liang Q, Sarkar M, Walk RA, Mendes PE. Population estimates for biomarkers of exposure to cigarette smoke in adult U.S. cigarette smokers. Nicotine Tob Res. 2009;11:1216–1225. doi: 10.1093/ntr/ntp126. [DOI] [PubMed] [Google Scholar]
- 51.Vogel RI, Carmella SG, Stepanov I, Hatsukami DK, Hecht SS. The ratio of a urinary tobacco-specific lung carcinogen metabolite to cotinine is significantly higher in passive than in active smokers. Biomarkers. 2011;16:491–497. doi: 10.3109/1354750X.2011.598565. [DOI] [PMC free article] [PubMed] [Google Scholar]
- 52.Haiman CA, Stram DO, Wilkens LR, Pike MC, Kolonel LN, Henderson BE, Le Marchand L. Ethnic and racial differences in the smoking-related risk of lung cancer. N Engl J Med. 2006;354:333–342. doi: 10.1056/NEJMoa033250. [DOI] [PubMed] [Google Scholar]