Abstract
Cochlear implant surgery is a procedure performed to treat profound hearing loss. Clinical results suggest that implanting the electrode in the scala tympani, one of the two principal cavities inside the cochlea, may result in better hearing restoration. Segmentation of intra-cochlear cavities could thus aid the surgeon to choose the point of entry and angle of approach that maximize the likelihood of successful implant insertion, which may lead to more substantial hearing restoration. However, because the membrane that separates the intra-cochlear cavities is too thin to be seen in conventional in vivo imaging, traditional segmentation techniques are inadequate. In this work, we circumvent this problem by creating an active shape model with micro CT (μCT) scans of the cochlea acquired ex-vivo. We then use this model to segment conventional CT scans. The model is fitted to the partial information available in the conventional scans and used to estimate the position of structures not visible in these images. Quantitative evaluation of our method, made possible by the set of μCTs, results in dice similarity coefficients averaging 0.75. Mean and maximum surface errors average 0.21 and 0.80 mm.
Index Terms: Intra-cochlear anatomy, scala tympani, cochlear implant, active shape model segmentation
I. INTRODUCTION
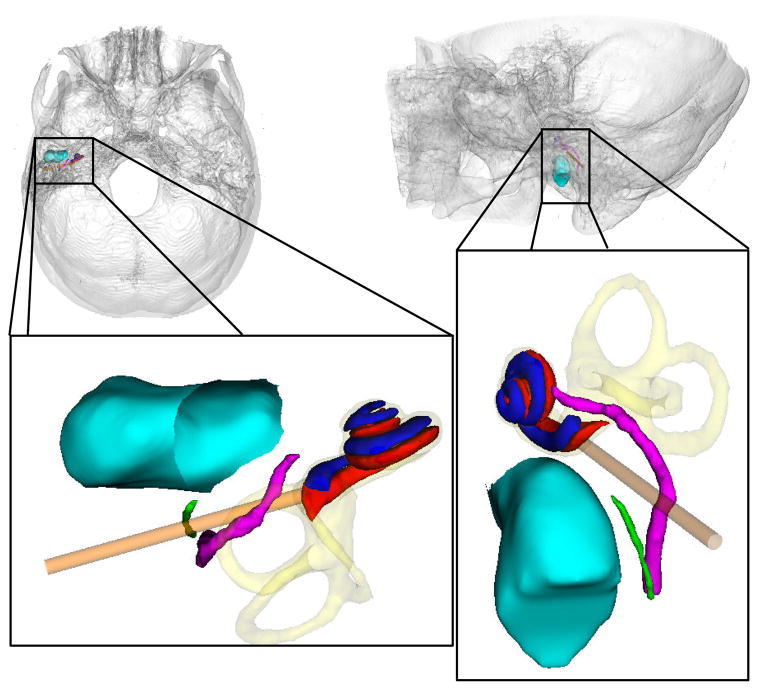
Cochlear implant surgery is a procedure performed to treat profound hearing loss. In a typical surgery, a mastoidectomy is performed, excavating bone posterior to the auditory canal to gain access to the cochlea while avoiding damage to vital structures. The sensitive structures along the traditional surgical approach are shown in Figure 1. The physician drills an approximately 1.0 mm hole through the bone surrounding the cochlea through which the electrode is inserted; this process is referred to as the cochleostomy in the remainder of this article. The electrode stimulates the spiral ganglion cells to induce the sensation of hearing.
Figure 1.
Superior-to-inferior view (left) and lateral-to-medial view (right) of ear anatomy. Shown are the cochlear labyrinth (yellow), facial nerve (purple), chorda tympani (green), auditory canal (blue-green), scala tympani (red), scala vestibuli (blue), and the traditional surgical approach (orange tube).
The cochlea is partitioned into several cavities: the scala tympani; scala vestibuli; and the scala media, which, for all practical purposes, can be ignored as it occupies only a small portion of the cochlear volume. Research has suggested that implanting the electrode into the scala tympani results in better hearing restoration [1]. But, it has also been reported that at most about 73% of cochlear implant procedures result in full insertion into the scala tympani [2]. The remaining 27% of implants are either fully inserted into the scala vestibuli or are initially inserted into scala tympani and then cross through the thin membranes (basilar and Reissner’s membranes) separating the scala tympani from the scala vestibuli (see Figure 2). Recent research has also suggested that the likelihood of scala tympani insertion is maximized using “soft” technique [3,4]. In this approach, the implant is threaded at a tangential angle into the scala tympani, attempting to inflict as little stress as possible on the soft tissue within the cochlea.
Figure 2.
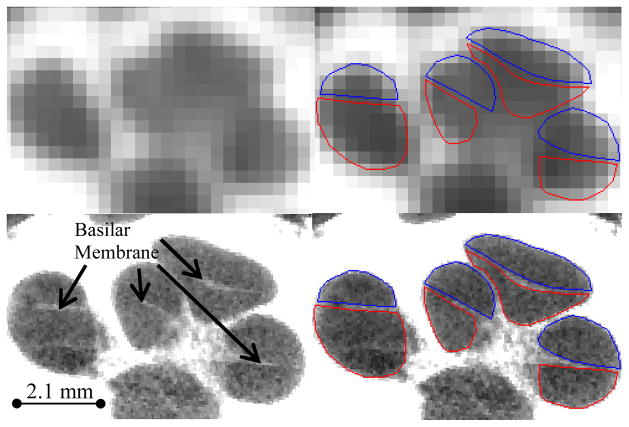
CT (top) and μCT (bottom) of a cochlea specimen. Delineated in the right panels are the scala tympani (red) and scala vestibuli (blue).
The success of the soft technique is largely dependent on the angle of electrode insertion and the position of the cochleostomy, i.e., the angle should be tangential to the scala tympani and the cochleostomy should be centered on the scala tympani in the basal turn region (first turn of the spiral–see Figure 1). Because the scala tympani is not visible in surgery, the surgeon must use other landmarks as a guide to estimate scala tympani position and orientation, a process requiring a great deal of expertise. Errors can occur here due to the imprecise nature of landmark-based, manual navigation as well as to inter-patient variations in the spatial relationship between the scala tympani and surgical landmarks [5–9].
A method that could localize the scala tympani in clinical images could thus be part of a system that would help surgeons in determining the proper cochleostomy position and insertion angle relative to visible surgical landmarks. Using such a system could potentially result in more effective hearing restoration. For typical cochlear implant procedures, a conventional CT is acquired so that the surgeon can identify abnormalities along the surgical approach. But, the basilar membrane is invisible in these images, which makes automatic identification impossible using only the information available in these scans (see Figure 2). To address this issue, we propose a method that complements the information available in these images. This technique permits the fully automatic and accurate segmentation of both scalae.
The method we propose is based on a deformable model of the cochlea and its components. To create such a model, we have used ex-vivo μCTs of the cochlea. In these scans, which have a spatial resolution that is much higher than the spatial resolution of clinical scans, intra-cochlear structures are visible (see Figure 2). Thus, these structures can be segmented manually in a series of scans. The set of segmented structures can be used subsequently to create an active shape model, as proposed by Cootes et al. [10]. Once the model is created, it can be used to segment the structures of interest, which are only partially visible in the conventional CT images, using the limited information these images provide. In the following section, we describe the method we have used to create our models and how we use these models to segment intra-cochlear structures in clinical CTs. In Section III, we present the results we have obtained. Our conclusions are presented in Section IV.
II. METHODS
A. Data
The data set we have used to build our model consists of image sets of six (one right and five left) cadaveric cochlea specimens received from the Vanderbilt School of Medicine’s Anatomical Gifts Program. For each specimen, we have acquired one μCT image volume with a Scanco μCT. The voxel dimensions in these images are 36 μm isotropic. For five of these specimens, we have also acquired one conventional CT image volume with a Xoran XCAT fpVCT scanner. In these volumes, voxels are 0.3 mm isotropic. In each of the μCT volumes, the scala vestibuli and scala tympani were manually segmented. Figure 2 shows an example of a conventional CT image and its corresponding μCT image.
B. Model Creation
The approach we use to model intra-cochlear anatomy is summarized in Figure 3. It requires (1) establishing a point correspondence between the structures’ surfaces, (2) using these points to register the surfaces to each other with a 7 degrees of freedom similarity transformation (rigid plus isotropic scaling), and (3) computing the eigenvectors of the registered points’ covariance matrix.
Figure 3.
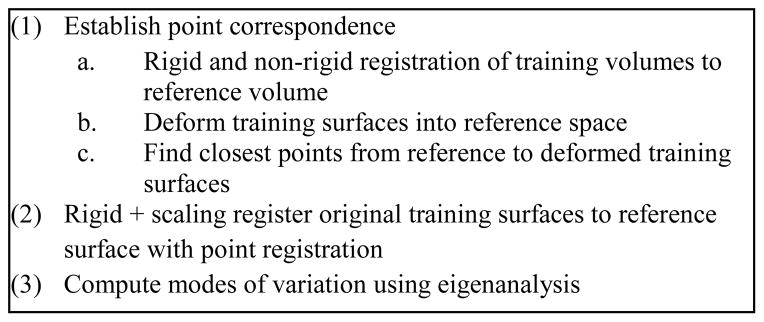
Constructing a point distribution model from a set of surfaces.
B.1. Image Registration Methods
As discussed in the next subsection, image registration is used in the process to establish correspondence between point sets. The registration scheme we use is an affine, followed by a non-rigid registration process. Affine transformations are computed by optimizing 12 parameters (translation, rotation, scaling, and skew) using Powell’s direction set method and Brent’s line search algorithm [11] to maximize the mutual information [12] between the two images, where the mutual information between image A and B is computed as
| (1) |
where H(.) is the Shannon entropy in one image, and H(. , .) is the joint entropy between the images. The entropy in the images is estimated as
| (2) |
in which p(k) is the intensity probability density function, which is estimated using intensity histograms with 64 bins.
Non-rigid image registration is performed using the adaptive bases algorithm [13]. This algorithm models the deformation field that registers the two images as a linear combination of radial basis functions with finite support
| (3) |
where x⃗ is a coordinate vector in ℝd, with d being the dimensionality of the images. Φ is one of Wu’s compactly supported positive radial basis functions [14], and the c⃗l’s are the coefficients of these basis functions. The c⃗l’s that maximize the normalized mutual information [15] between the images are computed through an optimization process that combines steepest gradient descent and line minimization. The steepest gradient descent algorithm determines the direction of the optimization. The line minimization calculates the optimal step in this direction. The algorithm is applied using a multi-scale and multi-resolution approach. The resolution is related to the spatial resolution of the images. The scale is related to the region of support and the number of basis functions. Typically, the algorithm is started on a low-resolution image with few basis functions with large support. The image resolution is then increased and the support of the basis function decreased. This leads to transformations that become more and more local as the algorithm progresses.
B.2. Establishing Correspondence
To establish correspondence between surfaces, one μCT volume was arbitrarily chosen as a reference volume, I0, and the remaining training volumes, {Ij}j=1:N−1, were registered to the reference using the methods discussed in the previous section, creating the set of non-rigid transformations {Ψj}j=1:N−1 such that Ij ≈ Ψj(I0). The affine registration step required manual initialization since there was no standard orientation for the samples in the scans. The manually segmented reference surface S0 was then deformed through each set of registration transformations into each target image space, creating the set {Ψj(S0)}. Residual registration errors were corrected by manually adjusting the surfaces using a tool developed for this purpose. These additional transformations were combined with the transformations computed automatically to produce the set of compound transformations . Finally, for each ith vertex on each jth deformed reference surface , the closest point on the respective training surface p⃗ ∈ Sj was found. A correspondence between this point p⃗ and the reference surface vertex S⃗0,i was established. Equivalently,
| (4) |
such that
| (5) |
This results in one corresponding point on each jth training surface for every ith reference point. Using image registration to establish a correspondence between point sets was inspired by the work of Frangi et. al. [16].
Once correspondence is established, each training surface is registered to the reference surface with a similarity transformation (rigid plus isotropic scaling), computed using standard point registration techniques [17]. Correspondence is established separately for the scala tympani and scala vestibuli, however, point registration is performed taking both structures into account simultaneously. This is done to maintain accurate inter-structure spatial relationships so that the shape model can be constructed with both structures simultaneously.
B.3. Computing the Shape Model
To build the model, the principal modes of shape variation are extracted from the registered training shapes. This is computed according to the procedure described by Cootes et. al. [10]: First, the covariance matrix of the point sets’ deviation from the mean shape is computed as
| (6) |
where the w⃗j’s are the individual shape vectors and w̄ is the mean shape vector defined by
| (7) |
The shape vectors are constructed by stacking the 3D coordinates of all the points composing each structure into a vector. The modes of variation in the training set are then computed as the eigenvectors {u⃗j} of the covariance matrix,
| (8) |
There are at most N−1 non-trivial eigenvalues, {λj}, because the rank of a covariance matrix of N linearly independent samples is N−1. The range of shapes within the training set can then be described by adding a linear combination of the eigenvectors, to w̄, the mean shape. The eigenvalue associated with each eigenvector is equal to the variance explained by the jth mode of variation in the training set. Typical structures can be closely approximated by using a linear combination of the eigenvectors within two standard deviations of the mean. These modes of variation are extracted for the combined shape of both the scalae for all the samples in the training set.
C. Segmentation Using the Active Shape Model
The procedure we use for segmentation with an active shape model is outlined in Figure 4. As can be seen in the figure, the overall process follows the traditional active shape model approach, i.e., (1) the model is placed in the image to initialize the segmentation; (2) better solutions are found while deforming the shape only in ways that are described by the precomputed modes of variation; and (3) eventually, after iterative shape adjustments, the shape converges, and the segmentation is complete. The following sections detail this approach.
Figure 4.
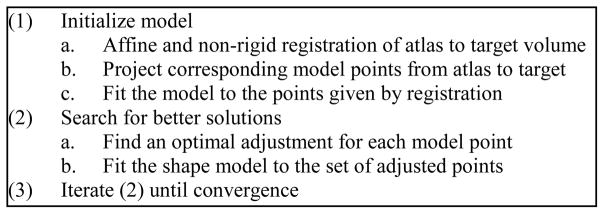
Performing segmentation with the active shape model.
C.1 Initialization
The first step to perform segmentation is to provide an initial position for the model in the target image. We choose to automate the initialization process by using an image registration-based initialization approach, in which an “atlas” is registered to the volume to be segmented, the “target.” This atlas is a conventional CT volume in which the position of the scalae is known. To create this atlas, a full head clinical CT was selected (in plane voxel size of 0.218 × 0.218 mm2, and slice thickness of 0.8 mm with 0.4 mm overlap). Next, a non-rigid transformation between the atlas volume and I0, the μCT of the cochlea specimen used to create the model, was computed using image registration (see Section II.B.1). Because the atlas volume and I0 have very different fields of view, it was necessary to manually initialize this registration. Next, the scalae model points were projected from I0 to the atlas volume. Finally, visually identifiable errors in the resulting surfaces were manually corrected. This process results in a full head volume in which the position of the scalae and of the basilar membrane are known.
The atlas is used at segmentation time to initialize the model using the steps summarized in Figure 4: (a) First, an automatic non-rigid registration (see Section II.B.1) is computed between the atlas and the target CTs. (b) Next, the scalae model points, which have known positions in the atlas, are transferred to the target image using the registration transformation. (c) Finally, to initialize the search, the shape model is simply fitted (the fitting procedure is described in the following section) to this set of points. The fitting procedure constrains the shape of the point-set to be similar to that of typical scalae, removing any unnatural shape changes that may have occurred due to the non-rigid registration transformation.
C.2 Searching Scheme
Once initialized, the optimal solution is found using an iterative searching procedure. At each search iteration, (a) an adjustment is found for each model point, and (b) the model is fitted to this set of candidate adjustment points (see Figure 4). To find the candidate points, two approaches are used, one for “external” and another for “internal” model points. When the model was created, model points corresponding to the exterior of the cochlea were labeled as external points. All other model points, which are positioned inside the cochlea were labeled as internal points. For the internal points, it is impossible to determine the best adjustment using local image features alone, because there are no contrasting features inside the cochlea in CT. Therefore, the original initialization positions for these points, which were provided by image registration, are used as the candidate positions. The registration transformation, as our results will show, is sufficiently accurate to provide this useful information to the segmentation process. External points lie in regions with contrasting features in CT. Therefore, candidates for external points are found using line searches to locate strong edges. At each external point y⃗i, a search is performed along the vector normal to the surface at that point. The new candidate point is chosen to be the point with the largest intensity gradient over the range of −1 to 1 mm from y⃗i along this vector.
The algorithm uses the approach just described to find a new candidate position for each point in the model. The next step is to fitted the shape model to these candidate points. We do this in the conventional manner described by Cootes. A standard 7 degree of freedom point registration is performed, creating similarity transformation T, between the set of candidate points {y⃗i′}and the mean shape{w̄i}, where w̄i are the 3D coordinates of the ith point in the mean shape. Then, the residuals
| (9) |
are computed. The modes of variation that were previously extracted are fitted to the residuals by taking the inner product between each eigenvector with the full residual vector,
| (10) |
where d⃗ is composed of {d⃗i} stacked into a single vector. Eq. (9) results in a scalar bj corresponding to each eigenvector u⃗j that quantifies how much of the deviation of this shape from the mean shape is explained by u⃗j. The final approximation to the shape is computed by passing the sum of the scaled eigenvectors plus the mean shape through the inverse transformation, equivalently,
| (11) |
where u⃗j,i is the ith 3D coordinate of the jth eigenvector. As suggested by Cootes, the magnitude of the bj’s are constrained such that
| (12) |
which enforces the Mahalanobis distance between the fitted shape and the mean shape to be no greater than 3. This constrains the shape such that its deviation from the mean is reasonable relative to the shape variations described by the training set.
At each iteration, new candidate positions are found and the model is re-fitted to those candidates. The active shape model converges when re-fitting the model results in no change to the surface.
D. Validation
Segmentation was performed on CT’s of five of these cochlea specimens using a leave-one-out approach, i.e., the volume being segmented is left out of the model. Thus, only four modes of variations were available for each segmentation validation. Because these samples were excised specimens, rather than whole heads, the initial registration with the full head CT used as the atlas required manual initialization—however, in practice the approach is fully automatic. To validate the results, we again exploit the set of corresponding μCT volumes. Each μCT was rigidly registered to the corresponding CT of the same specimen. The manually delineated scalae segmentations were then projected from the μCT to CT space. Finally, Dice similarity coefficient (DSC) [18] and surface errors were computed between automatic segmentations and the registered manual segmentations to validate the accuracy of our results. DSC measures volumetric overlap between two surfaces S1 and S2 using the equation
| (13) |
where N(S1 ∩ S2) is the number of overlapping voxels within the surfaces, and N(S1) + N(S2) is the sum of the number of voxels within each surface. DSC ranges from 0, corresponding to no volumetric overlap, to 1, which corresponds to perfect volumetric overlap. A larger DSC between the automatic and manual segmentations indicates higher accuracy.
Surface errors are computed by measuring mean and maximum distances between automatic and manually segmented surfaces. The distance from a vertex p⃗ on surface S1 to surface S2 can be computed using the equation
| (14) |
Then, the mean and maximum distances between the two surfaces can be computed as
| (15) |
In general, d(·)(S1, S2) ≠ d(·)(S2, S1), i.e., the distance measures are not symmetric. Thus, to accurately characterize the surface error, we compute surface distances in the forward (automatic-to-manual) direction as well as the reverse (manual-to-automatic) direction and include both measurements in the results. A smaller distance between the automatic and manually segmented surfaces indicates higher accuracy.
III. RESULTS
The model was constructed with a total of approximately 15000 unique sets of corresponding surface points. The eigenvalues of the 5 independent modes of variation for the model are given in Table 1. At a range of two standard deviations, the maximum displacement of any point on the scala tympani or scala vestibuli surfaces are approximately 1.0 mm, and mean displacements are approximately 0.15 mm. Points on the basal turn (the first turn of the spiral) vary by approximately 0.35 mm. In the basal turn, the basilar membrane varies by approximately 0.15 mm. The first two modes of variation can be visually appreciated in Figure 5. It appears that the first mode of variation is capturing changes in the length of the basal turn, the second mode of variation is capturing changes in the width of the basal turn, and both are capturing changes in the width and angle of the second and third turns of the cochlea.
Table 1.
Eigenvalues of the modes of variation for the model.
| Mode of variation | 1 | 2 | 3 | 4 | 5 |
|---|---|---|---|---|---|
| eigenvalues | 555.10 | 330.39 | 183.06 | 108.97 | 72.04 |
| % of total variance | 44.60 | 26.54 | 14.71 | 8.76 | 4.36 |
Figure 5.
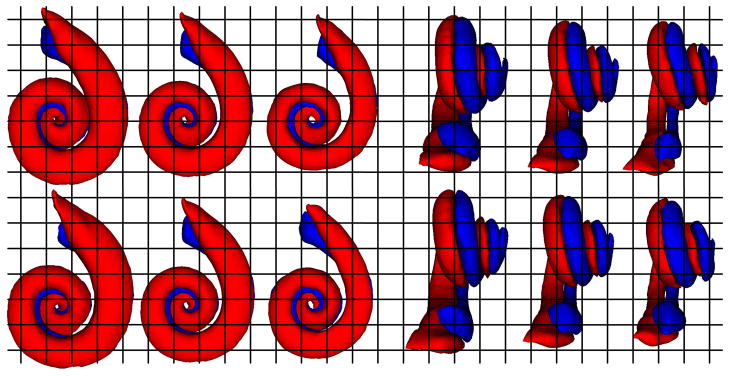
First (top row) and second (bottom row) modes of variation of the scala tympani (red) and vestibuli (blue) in the point distribution model. On the left are (from left to right) −2, 0, and +2 standard deviations from the mean in Posterior-to-Anterior view. The same modes are shown on the right in Medial-to-Lateral view.
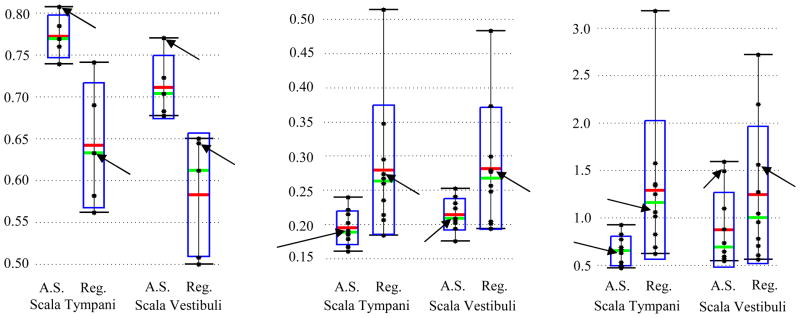
Quantitative comparisons between the manual segmentations of the scalae, transformed from μCT to the respective conventional CT, and the automatic segmentations are shown in Figure 6. DSC for measuring volumetric overlap and bidirectional mean/max surface distances are computed between each pair of automatic and manual segmentations. Figure 6 shows the overall distributions of these recorded values. The green bars, red bars, blue rectangles, black dots, and black I-bars denote the median, mean, one standard deviation from the mean, individual data points, and the overall range of the data set, respectively. Results for segmentation with the active shape model are shown side by side with results achieved using non-rigid registration alone. Arrows indicate the results from the experiment shown in Figure 7. The active shape model achieves mean DSC of approximately 0.77 for the scala tympani and 0.72 for the scala vestibuli. For most structures, a DSC of 0.8 is typically considered good [19]. However, this measure can be unforgiving for very thin, complicated structures, such as the scalae, which range from about 1 to 4 voxels thick along their length. In general, for structures with a relatively large surface area-to-volume ratio, 0.7 is typically considered a high DSC. The active shape model effectively improves the volumetric overlap from the results achieved by registration alone in every experiment. A consistent decrease in mean surface errors from an average 0.28 mm with registration to 0.20 mm (< 1 voxel) with the active shape model approach can also be seen. Maximum surface errors are on average decreased from 1.3 mm using registration to 0.8 mm by using the active shape model approach. In fact, with the active shape model, all surface errors for scala tympani segmentation are sub-millimetric. The improvements when using the active shape model are all statistically significant for each metric.
Figure 6.
Quantitative segmentation results. Shown are the distributions of the DSC (left), mean surface distance in mm (middle), and max surface distance in mm (right) for the results of the active shape model (A.S.) and registration alone (Reg.). Arrows indicate the results for the experiment shown in Figure 7.
Figure 7.
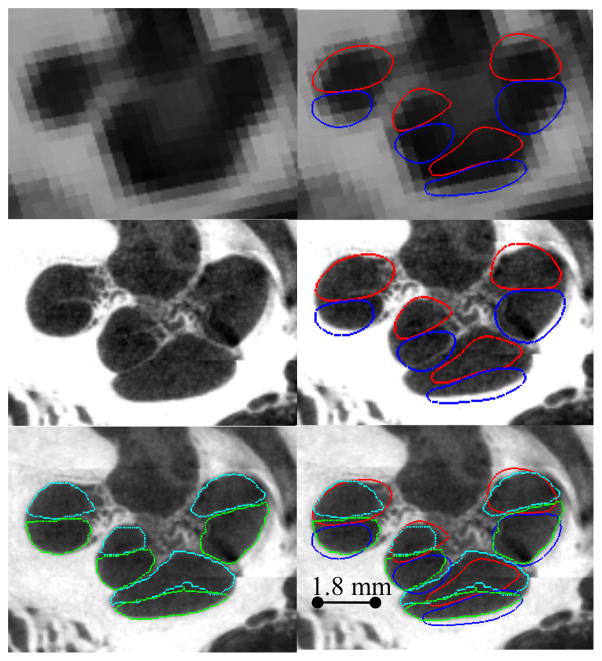
Contours of representative segmentation results. Automatic segmentation results for the scala tympani (red) and scala vestibuli (blue) are shown overlaid with the conventional CT (top row), and registered μCT (middle and bottom rows), and are compared to manually delineated contours of the scala tympani (light blue) and scala vestibuli (green).
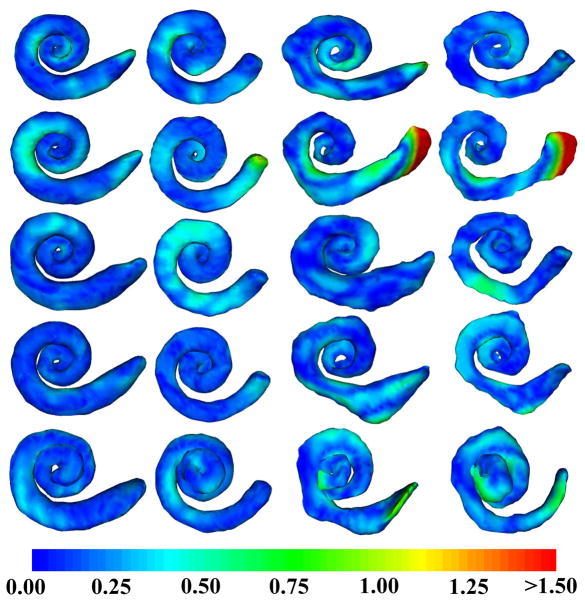
Our results can be visually confirmed in Figures 7 and 8. Shown in Figure 7 are contours of a representative automatic segmentation overlaid with the CT (the volume on which segmentation was performed) and the corresponding registered μCT. In the figure, the contours achieved by automatic segmentation of the CT can be compared to the contours manually delineated in the high resolution μCT. Local surface error maxima that are apparent in the μCT are less than 2 voxels width in the CT. Shown in Figure 8 are the automatic segmentations for all 5 experiments, where the surfaces are color encoded with the distance to the manually segmented surface. It can be seen that the active shape model results in mean surface errors under 0.3 mm (< 1 voxel) for the majority of the structure with typical average maximum errors of about 0.8 mm (<3 voxels). The active shape model converges to a surface that looks anatomically correct, whereas registration-based segmentation alone converges to unnatural, irregular surfaces.
Figure 8.
Segmentations color encoded with error in mm for the experiments 1–5 (Up to Down). (Left to Right) Active shape model segmentation of the scala tympani, scala vestibuli, atlas-based segmentation of the scala tympani, scala vestibuli.
IV. DISCUSSION AND CONCLUSIONS
In this work, we have presented an active shape model-based approach for identifying structures that are partially visible in conventional imaging. In this approach, we rely on high resolution images of cadaveric specimens to serve two functions. First, they provide information necessary to construct a shape model of the structure, permitting segmentation of the structure in conventional imaging by coupling information from the image and non-rigid image registration to drive an active shape model to an accurate solution. Second, the high resolution images are used to validate the results. This is performed by projecting manually segmented structures from high resolution to conventional images using image registration, and comparing those structures to automatic segmentations. We have applied this approach to identify intra-cochlear anatomy in CT and validate the results; however, the approach is generic, and could theoretically be applied to other structures that are fully visible only in high resolution imaging.
While the number of samples used to build the model is relatively small, the leave-one-out study presented here suggests that there are enough samples for the active shape model to approximate the range of typical, non-malformed cochleae. This technology has, in fact, already been integrated into a system to assess post-operative electrode position [20,21], which has successfully been used to identify scalae and electrode position in 16 patients [22]. The methods presented in this paper are able to automatically capture the non-rigid variations of the scalae for accurately assessing electrode position, which differs from the conventional approach where a rigid model of the anatomy is manually align with the image to identify electrode position [1,23]. The scalae segmentation method has also been used for pre-operative planning of minimally invasive methods in 18 ears [24]. These studies and the results presented in this paper suggest that the model is powerful enough to capture the typical variations of the cochlea.
This work has shown that it is possible to accurately identify the location of the scala tympani and scala vestibuli using conventional CT. This is possible because the position of the intra-cochlear membrane separating the scalae varies predictably with respect to the rest of the cochlea. The approach we present accurately locates the basilar membrane in conventional CT by attracting the exterior walls of the models of intra-cochlear anatomy towards the edges of the cochlea. This approach achieves DSC of approximately 0.75, sub-millimetric maximum error distance for the scala tympani, and produces solutions that appear qualitatively reasonable. These results suggest that our approach can provide the surgeon with explicit knowledge of the location of surgical targets.
For these segmentations of the scalae to be useful, their position must be assessed relative to adjacent, visible surgical landmarks. We have previously presented approaches to identify such anatomy in CT, e.g., the ossicles [25] and the promontory [5]. Thus, a system that integrates visualization of all of the relevant visible and hidden anatomy could prove to be useful as a surgical aid. In future work, we will perform experiments to confirm that providing this information to the surgeon improves implantation results.
Acknowledgments
This work was supported by NIH grants R01EB006193 from the National Institute of Biomedical Imaging and Bioengineering, and F31DC009791 and R01DC008408 from the National Institute of Deafness and Other Communication Disorders. The content is solely the responsibility of the authors and does not necessarily represent the official views of these institutes. An earlier version of this paper was printed in the Proceedings of the SPIE Conf. on Medical Imaging 2010: Image Processing, pp. 762302.
The authors would like to thank Robert Rutherford for helping with initial manual delineation of the μCT volumes.
Biographies
Jack H. Noble (S’07-M’11) received the B.E., M.S., and Ph.D. degrees in electrical engineering from Vanderbilt University, Nashville, in 2007, 2008, and 2011, respectively. He is currently a Research Assistant Professor in the Department of Electrical Engineering and Computer Science at Vanderbilt.
His primary research areas include medical image processing, image segmentation, registration, statistical modeling, and image-guided surgery techniques.

Omid Majdani completed the Medical School degree, and the Ph.D. degree in pathology from the Charité Universitätsmedizin, Berlin, Germany, in 1999 and 2002, respectively, and the Residency degree in otolaryngology from the Hannover Medical School, Hannover, Germany (MHH) in 2004.
Since 2004, he has been a Senior Surgeon in the Department of Otolaryngology, MHH, Hannover,. He was an Assistant Professor in the Department of Otolaryngology, Vanderbilt University Medical Center, Nashville, TN, from 2007–2008. Since 2010 he has been Associate Professor at MHH. His current research interests include computer-assisted surgery and medical robotics as well as development of new cochlear implant devices. His primary research areas include medical image processing, image segmentation, registration, statistical modeling, and image-guided surgery techniques.

Robert F. Labadie earned a B.S. in Mechanical Engineering from the University of Notre Dame, Notre Dame, IN, in 1988; a Ph.D. in Bioengineering and a M.D. from the University of Pittsburgh, Pittsburgh, PA in 1995 and 1996, respectively.
He is currently an Associate Professor in the Department of Otolaryngology/Head and Neck Surgery, Vanderbilt University Medical Center, Nashville, TN. He has a joint appointment in the Department of Biomedical Engineering, Vanderbilt University. His clinical specialty is otology, with emphasis on surgical rehabilitation of the hearing impaired, including cochlear implantation. He is the author of more than 80 peer-reviewed papers, has presented his research nationally and internationally, and has ongoing National Institutes of Health grant support to study image-guided otologic surgery, including cochlear implantation.
Dr. Labadie is a Member of the American Academy of Otolarynogology-Head and Neck Surgery, the American Otological Society, American Neurotology Society, and the Triological Society.

Benoit M. Dawant (M’88-SM’03-F’10) received the M.S.E.E. degree from the University of Louvain, Leuven, Belgium, in 1983, and the Ph.D. degree from the University of Houston, Houston, TX, in 1988.
Since 1988, he has been on the faculty of the Electrical Engineering and Computer Science Department, Vanderbilt University, Nashville, TN, where he is a Professor. His main research interests include medical image processing and analysis. His current areas of interest include the development of algorithms and systems to assist in the placement of deep brain stimulators used for the treatment of Parkinson’s disease and other movement disorders, the placement of cochlear implants used to treat hearing disorders, or the creation of radiation therapy plans for the treatment of cancer.
Contributor Information
Jack H. Noble, Email: jack.h.noble@vanderbilt.edu, Dept. of Electrical Engineering and Computer Science, Vanderbilt University, Nashville, TN 37235 USA.
Robert F. Labadie, Email: robert.labadie@vanderbilt.edu, Dept. of Otolaryngology, Vanderbilt University Medical Center, Nashville, TN 37235 USA
Omid Majdani, Email: omid.majdani@gmx.de, Dept. of Otolaryngology, University of Hannover, Hannover, Germany.
Benoit M. Dawant, Email: benoit.dawant@vanderbilt.edu, Dept. of Electrical Engineering and Computer Science, Vanderbilt University, Nashville, TN 37235 USA.
References
- 1.Skinner MW, Holden TA, Whiting BR, et al. In vivo estimates of the position of advanced bionics electrode arrays in the human cochlea. Ann Otol Rhinol Laryngol Suppl. 2007 Apr;197:2–24. [PubMed] [Google Scholar]
- 2.Aschendorff A, Kromeier J, Klenzner T, Laszig R. Quality Control After Insertion of the Nucleus Contour and Contour Advance Electrode in Adults. Ear & Hearing. 2007 Apr;28:75S–79S. doi: 10.1097/AUD.0b013e318031542e. [DOI] [PubMed] [Google Scholar]
- 3.Lehnhardt E, Laszig R. Specific surgical aspects of cochlear implant-soft surgery. Adv in coch Imp. 1994:228–9. [Google Scholar]
- 4.James C, Albegger K, Battmer R, et al. Preservation of residual hearing with cochlear implantation: How and why. Acta Oto-Laryngologica. 2005;125(5):481–91. doi: 10.1080/00016480510026197. [DOI] [PubMed] [Google Scholar]
- 5.Noble JH, Rutherford R, Labadie RF, Majdani O, Dawant BM. Modeling and segmentation of intra-cochlear anatomy in conventional CT. Proc of the SPIE conf on Med Imag. 2010;7623:762302. [Google Scholar]
- 6.Erixon E, Hogstorp H, Wadin K, Rask-Anderson H. Variational anatomy of the human cochlea: implications for cochlear implantation. Otology & Neurotology. 2008;30:14–22. doi: 10.1097/MAO.0b013e31818a08e8. [DOI] [PubMed] [Google Scholar]
- 7.Dimopoulos P, Muren C. Anatomic variations of the cochlea and relations to other temporal bone structures. Acta Radiologica. 1990;31:439–44. [PubMed] [Google Scholar]
- 8.Ketten DR, Skinner MW, Wang G, et al. In vivo measure of cochlear length and insertion depth of nucleus cochlear implant electrode arrays. Ann Otol Rhinol Laryngol Suppl. 1998;175:1–16. [PubMed] [Google Scholar]
- 9.Escude B, James C, Dequine O, Cochard N, Eter E, Fraysse B. The size of the cochlea and predictions of insertion depth angles for cochlear implant electrodes. Audiol Neurootol. 2006;11(Suppl 1):27–33. doi: 10.1159/000095611. [DOI] [PubMed] [Google Scholar]
- 10.Cootes TF, Taylor CJ, Cooper DH, Graham J. Active Shape Models—Their Training and Application. Comp Vis And Image Unders. 1995;61(1):39–59. [Google Scholar]
- 11.Press WH, Flannery BP, Teukolsky SA, Vetterling WT. Numerical Recipes in C. 2. ch 10. Cambridge, U. K: Cambridge Univ. Press; 1992. pp. 412–419. [Google Scholar]
- 12.Maes F, Collignon A, Vandermeulen D, Marchal G, Suetens P. Multimodality image registration by maximization of mutual information. IEEE Trans Med Imag. 1997;16:187–198. doi: 10.1109/42.563664. [DOI] [PubMed] [Google Scholar]
- 13.Rohde GK, Aldroubi A, Dawant BM. The adaptive bases algorithm for intensity-based nonrigid image registration. IEEE Trans Med Imag. 2003;22:1470–1479. doi: 10.1109/TMI.2003.819299. [DOI] [PubMed] [Google Scholar]
- 14.Wu Z. Multivariate compactly supported positive definite radial functions. Adv Comput Math. 1995;4:283–292. [Google Scholar]
- 15.Studholme C, Hill DLG, Hawkes DJ. An overlap invariant entropy measure of 3D medical image alignment. Pattern Recognition. 1999;32(1):71–86. [Google Scholar]
- 16.Frangi AF, Rueckert D, Schnabel JA, Niessen WJ. Automatic construction of multiple-object three-dimensional statistical shape models: Application to cardiac modeling. IEEE Trans on Med Imag. 2002;21(9):1151–66. doi: 10.1109/TMI.2002.804426. [DOI] [PubMed] [Google Scholar]
- 17.Arun KS, Huang TS, Blostein SD. Least square fitting of two 3-D point sets. IEEE Trans Patt Anal Machine Intell. 1987;9(5):698–700. doi: 10.1109/tpami.1987.4767965. [DOI] [PubMed] [Google Scholar]
- 18.Dice LR. Measures of the amount of ecologic association between species. Ecology. 1945;26:297–302. [Google Scholar]
- 19.Zijdenbos AP, Dawant BM, Margolin R. Morphometric Analysis of White Matter Lesions in MR Images: Method and Validation. IEEE Transactions on Medical Imaging. 1994;13(4):716–724. doi: 10.1109/42.363096. [DOI] [PubMed] [Google Scholar]
- 20.Noble JH, Schuman TA, Wright CG, Labadie RF, Dawant BM. Automatic identification of cochlear implant electrode arrays for postoperative assessment. Proc Of the SPIE Conf on Med Imag. 2011;7962:796217-1–796217-10. doi: 10.1117/12.878490. [DOI] [PMC free article] [PubMed] [Google Scholar]
- 21.Schuman TA, Noble JH, Wright CG, Wanna GB, Dawant B, Labadie RF. Anatomic Verification of a Novel, Non-rigid Registration Method for Precise Intrascalar Localization of Cochlear Implant Electrodes in Adult Human Temporal Bones Using Clinically-available Computerized Tomography. Laryngoscope. 2010;120(11):2277–2283. doi: 10.1002/lary.21104. [DOI] [PMC free article] [PubMed] [Google Scholar]
- 22.Wanna G, Noble JH, Mcrackan T, Dawant BM, Dietrich M, Watkins L, Rivas A, Schuman T, Labadie R. Assessment of electrode positions and hearing outcome in bilateral cochlear implant patients. Otology & Neurotology. 2011;32(3):428–432. doi: 10.1097/MAO.0b013e3182096dc2. [DOI] [PMC free article] [PubMed] [Google Scholar]
- 23.Finley CC, Holden TA, Holden LK, Whiting BR, Chole RA, Neely GJ, Hullar TE, Skinner MW. Role of electrode placement as a contributor to variability in cochlear implant outcomes. Otology & Neurotology. 2008;29(7):920–928. doi: 10.1097/MAO.0b013e318184f492. [DOI] [PMC free article] [PubMed] [Google Scholar]
- 24.Labadie RF, Balachandran R, Mitchell J, Noble JH, Majdani O, Haynes DS, Bennett M, Dawant BM, Fitzpatrick JM. Clinical Validation Study of Percutaneous Cochlear Access Using Patient Customized Micro-Stereotactic Frames. Otology & Neurotology. 2010;31(1):94–99. doi: 10.1097/MAO.0b013e3181c2f81a. [DOI] [PMC free article] [PubMed] [Google Scholar]
- 25.Noble JH, Dawant BM, Warren FM, Labadie RF. Automatic Identification and 3D Rendering of Temporal Bone Anatomy. Otology & Neurotology. 2009;30(4):436–42. doi: 10.1097/MAO.0b013e31819e61ed. [DOI] [PMC free article] [PubMed] [Google Scholar]


