

Abstract
Huntington's disease (HD) is an inherited neurodegenerative disorder caused by an expanded stretch of CAG trinucleotide repeats that results in neuronal dysfunction and death. Here, the HD consortium reports the generation and characterization of 14 induced pluripotent stem cell (iPSC) lines from HD patients and controls. Microarray profiling revealed CAG expansion-associated gene expression patterns that distinguish patient lines from controls, and early onset versus late onset HD. Differentiated HD neural cells showed disease associated changes in electrophysiology, metabolism, cell adhesion, and ultimately cell death for lines with both medium and longer CAG repeat expansions. The longer repeat lines were however the most vulnerable to cellular stressors and BDNF withdrawal using a range of assays across consortium laboratories. The HD iPSC collection represents a unique and well-characterized resource to elucidate disease mechanisms in HD and provides a novel human stem cell platform for screening new candidate therapeutics.
INTRODUCTION
HD is an autosomal-dominant progressive neurodegenerative disease, characterized by movement, cognitive and emotional disorders (Ross and Tabrizi, 2011; Walker, 2007). It is caused by an expanded CAG repeat in exon 1 of the HTT gene, which encodes an expanded polyglutamine stretch near the N-terminus of the 350-kDa huntingtin (HTT) protein (Consortium, 1993). The presence of more than 40 CAGs invariably causes disease within a normal lifespan, and longer repeats predict younger disease onset (Langbehn et al., 2010). Cell death occurs in many brain regions, but striatal medium spiny neurons expressing DARPP-32 (dopamine- and cAMP-regulated phosphoprotein) undergo the greatest degeneration (Vonsattel et al., 2008). Although the mutation causing HD is known, understanding of pathogenesis is incomplete, and there is no treatment to delay the onset or slow the progression of HD.
Mutant HTT is widely expressed, and believed to induce neurodegeneration through abnormal interactions with other proteins. This leads to many cellular alterations, including abnormal vesicle recycling, loss of signaling by brain-derived neurotrophic factor (BDNF), excitotoxicity, perturbation of Ca2+ signaling, decreases in intracellular ATP, alterations of gene transcription, inhibition of protein clearance pathways, mitochondrial and metabolic disturbances, and ultimately cell death (Zuccato et al., 2010). Many of these observations were based on transfection of cDNAs encoding mutant HTT into primary non-human cells or rodent and human cell lines (reviewed in Ross and Tabrizi, 2011). In other studies, fibroblasts and lymphoblasts from HD patients show abnormal Ca2+ responses, enhanced toxicity in response to cellular stress and CAG-length-dependent altered ATP/ADP ratios (Seong et al, 2005). However, significant differences between rodent and human cells and between non-neuronal cells and neurons limit the utility of these models for accurately representing human disease. Ideally, in vitro mechanisms of neuronal death should be established in human neurons carrying the mutation.
Human embryonic stem cells (hESCs) can generate highly specified human cell populations, including DARPP32-positive MSNs of the striatum (Aubry et al., 2008), and thus could provide a method for modeling HD. In fact, hESCs have been derived from embryos carrying HD mutations during pre-implantation genetic diagnosis (Bradley et al., 2011). However, the limited access to HD embryos, inability to assess the ultimate phenotype of the never-developed embryo, and rare derivation of very long CAG expansions, all restrict the utility of this approach. Many of these shortcomings could be overcome using cells from HD patients with known patterns of disease onset and duration that are reprogrammed to generate induced pluripotent stem cells (iPSCs; Takahashi et al., 2007; Yu et al., 2007). iPSCs, like hESCs, can be expanded indefinitely, and retain the potential to differentiate into neurons, and thus may hold great promise for modeling neurological diseases (for review see Mattis and Svendsen, 2011). Indeed, human iPSC lines have been generated from a variety of individuals, including HD patients (Park et al., 2008). However, just two studies have looked for phenotypic changes after differentiation using lines with lower repeat lengths and single assay techniques (Zhang et al., 2010; Camnasio et al, 2012).
Here, we report the generation of a panel of iPSC lines derived from a range of HD patient and control fibroblasts. Through an international consortium effort involving eight research groups, we show these iPSC lines have novel gene expression patterns and clear reproducible CAG expansion–associated phenotypes upon differentiation. This report represents a unique stem cell resource for the research and industrial community that may be used to both gain further mechanistic insights into HD and explore novel drug targets for this devastating disorder.
RESULTS
Neural Stem Cells Generated from HD iPSCs Express Mutant HTT and Show Specific Gene and Protein Expression Patterns
Fourteen HD and control iPSC lines were generated by the consortium (Tables S1,S2), eight of which were used in the various experiments within this paper (summarized in Table S3). The HD iPSC lines expressed the appropriate pluripotency markers (Figures 1A and S1A,B) and normal karyotypes (Figures 1B and S1C). They also down-regulated the exogenously expressed genes (except Klf4, which was turned off at later stages of differentiation; Figure S1A), and formed teratomas with all three lineages upon transplantation into immune-compromised mice (Figure S1D).
Figure 1. HD Fibroblasts are Reprogrammed into Karyotypically Normal iPSCs that Generate NSCs.

(A) All reprogrammed lines form colonies (brightfield) and express the pluripotency markers Oct4, Tra-1-60 and SSEA4 by immunocytochemistry (ICC). (B) G-banding showed that the HD180i.5 line had a normal karyotype, which was representative of all lines at the colony and NSC stages. (C) Schematic of the different differentiation protocols used. (D) CAG repeat analysis in HD109i.1 fibroblasts and NSCs over 26 passages showed a small increase in repeat length over time. (E) Western blots of HTT expression in iPSC-derived NSCs with the HTT antibody 2166 demonstrate normal (bottom arrow) and mutant (top arrow) HTT (epitope: amino acids 441–455). (F) Western blots of polyglutamine expressionin iPSC-derived NSCs using the IC2 antibody demonstrates mutant HTT with expanded repeats in the HD-derived lines. (G) Representative image of a NSC sphere demonstrating the section sampled for (H). (H) HD iPSC-derived NSCs can be expanded as spherical aggregates in a self-renewing condition. ICC on cryosections of NSC aggregates demonstrated a consistent expression of the neural progenitor markers PAX6 and nestin in the three lines. (I) Hierarchical clustering of top 1601 genes from NSCs is represented by the vertical bars (yellow for HD and green for control). The dataset shows that HD and control NSC lines are separated into two clusters, confirming the differential expression of these genes into the two categories.
Neural stem cells (NSCs) were generated from the HD and control iPSC lines by lifting cells into a defined medium with epidermal growth factor (EGF) and fibroblast growth factor-2 (FGF-2) both at 100 ng/ml, as described previously (Ebert et al., 2009). These NSCs grew as spherical aggregates that were expandable for up to 50 passages and could be frozen/ thawed with high efficiency, providing all consortium members with a reliable source of NSCs that could be differentiated into neurons and glia (via short protocol) and DARPP-32-expressing striatal neurons (via long protocol) (Figure 1C).
All NSC lines grew at similar rates and displayed genomic integrity by array comparative genomic hybridization (Agilent 244K arrays; data not shown). For most lines, the normal and expanded CAG repeat alleles exhibited only mild instability, with passage or upon differentiation (data not shown). However, for one HD line (HD109i.1) we found complete stability of the short 19 CAG repeat and a minor increase (<10%) with passage of the long CAG repeat from 110 in the original fibroblast line to 118 after 26 passages of the NSCs (Figure 1D). Immunoblots of protein extracts with an antibody that recognizes normal and mutant HTT revealed that HD NSCs expressed both proteins, with the large CAG expansion in the HD180i.5 line showing slower migration on the gel (Figure 1E). Mutant HTT was also present in the HD60i.4 NSCs, but its similar size to normal HTT precluded its separation with the Western blot parameters. An antibody that selectively detects expanded polyglutamine demonstrated the presence of mutated protein in the HD NSC lines (Figure 1F). Sections through growing NSC aggregates (Figure 1G) showed no expression of the pluripotentcy markers Oct4, SSEA4 or Tra-1-60 (data not shown) and robust expression of NSC markers nestin and PAX6 (Figure 1H).
Gene expression in three HD NSC lines (HD180i.5, HD109i.1 and HD60i.4) was compared to that in two control lines (HD33i.8 and HD21i.5) by whole-transcript expression profiling and analysis. Analysis of Variance (ANOVA) found 1601 genes that were significantly differentially expressed with an absolute value of fold-change >2. Hierarchical clustering showed a clear separation of HD and control NSC datasets (Figure 1I), with all HD datasets in one cluster and controls in another. Of the 1601 genes, key pathways were identified using Ingenuity Pathway Tools (IPA), including those involved in signaling, cell cycle, axonal guidance and neuronal development (Table 1). Many of these changes are consistent with known transcriptional changes in HD, while others represent novel pathways. Some changes associated with specific categories were only present in lines with longer repeats, whereas others such as calcium signaling showed effects specific to the 60 repeat range. Finally, there existed subtle differences between differentially expressed genes from highly expanded (HD180i.5, HD109i.1) lines versus the HD60i.4 line, which would be expected based on our subsequent observations that there are differences in phenotypes between the lines (Table 1 and subsequent figures). Changes were validated by qPCR for 16 selected genes significantly altered in the HD NSCs (Table S5), supporting HD-related transcriptional deregulation even at this early stage of development. We also conducted protein profiling of the HD180i.5 NSCs relative to the control line using mass spectrometry and the iTRAQ method. IPA identified 356 up-regulated and 191 down-regulated proteins. Among the pathways enriched in up-regulated proteins were those involving IGF-1 (Figure S2A; Zuccato et al., 2010). Gene expression and proteomics data were then compared by IPA, and several of the pathways modulated in the HD versus control lines were found to be in common. For example, a portion of the axonal guidance pathway involved in growth cone and extracellular matrix formation had altered protein expression, including BDNF and Trk receptors altered in HD (Figure S2B).
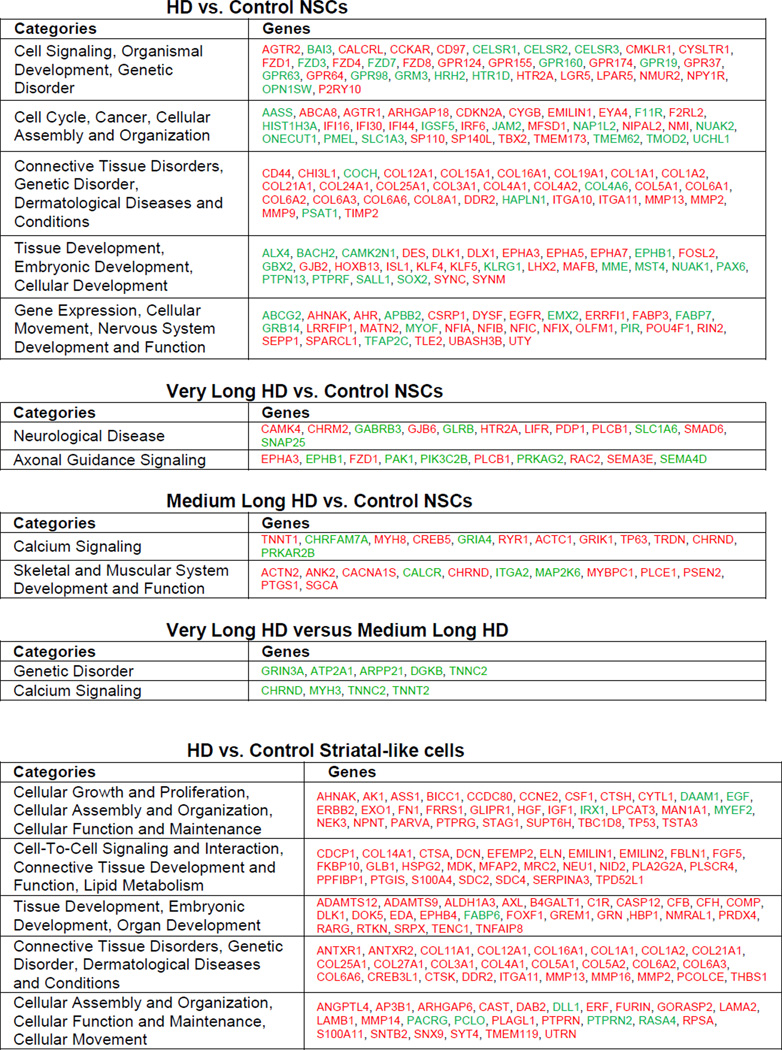
Table 1. Categorization of significantly differentially expressed genes by Ingenuity IPA.
HD vs. control NSC samples or HD vs. control striatal-like samples were analyzed and organized by IPA into networks. Categories from these networks are shown. Red represents a significant increase and green represents a significant decrease in expression of gene. Only the most highly ranked categories were selected. The top table shows the top ranked categories for all 1601 differentially expressed genes in HD versus control NSCs. Three sub-tables are shown below corresponding to various subsets of the HD NSC lines versus all Control NSC lines. Very long HD versus controls are representative genes from top two categories that change only in the HD180 and HD109 lines compared to controls but not in HD60. Medium long versus control are representative genes from top two categories that change only in HD60 compared to control. The final sub-table labeled Differentially expressed Very Long HD versus Medium Long HD are genes from an analysis of HD180 and HD109 versus HD60 intersected with All HD versus Control NSCs. This corresponds to the subtle differences that can be seen in the Hierarchical-Clustering/Heat-Map between these lines (Figure 1l). The bottom table shows the top five IPA categories for differentially expressed HD vs. Control Striatal-like cells.
 |
Neural Progenitor Cells Exhibit CAG Repeat-Associated Changes in Cytoskeleton, Adhesion and Energetics
Previously a number of dominant changes in cell adhesion have been observed using immortalized and primary Hdh CAG knock-in mouse striatal cells grown as monolayers on laminin (Reis et al, 2011). We first attempted to reproduce this phenotype by dissociating and acutely plating HD and control NSCs from spheres (short differentiation; Figure 1C) but found no difference in aggregation rates (data not shown). We then moved to identical neural progenitor cell (NPC) growth conditions as used in the mouse studies by plating HD and control NSCs onto laminin-coated coverslips with EGF and FGF-2 at 20ng/ml (see supplemental methods). Cells from all the HD lines grew well as a NPC monolayer under these conditions and were positive for nestin, Sox1, Sox2, Musashi and Pax6 (Figure S3A) and were capable of differentiating into neurons and astrocytes upon mitogen removal (Figure S3B). However, HD NPCs had significantly less binding of phalloidin-peptide than control NPCs, suggesting changes in the actin cytoskeleton (Figure S3C). Furthermore, in a cell-cluster formation assay where cells are dissociated, plated and allowed to form aggregates over time, all the HD NPCs showed significantly decreased cell-cell adhesion properties (Figure 2A,B). Previous studies using an allelic series of CAG knock-in mouse embryonic stem cell lines have shown dominant CAG length-dependent reductions in energy metabolism (Jacobsen et al, 2011). Here, all human-derived HD NPCs showed significantly decreased intracellular [ATP] (Figure 2C) and decreased [ATP/ADP] ratios (Figure 2D), suggesting that energy metabolism is compromised in both the HD60 and HD180 lines.
Figure 2. NPCs with Expanded CAG Alleles Exhibit Altered Energetic and Cell-Cell Adhesion.

(A) Representative micrographs demonstrating similar dispersion of NPCs at time 0, for all genotypes, and cell-cell clusters formed at 12 hours, which were larger with shorter CAG alleles, compared to NPCs with longer CAG alleles. (B) Quantitative analysis of average NPC cluster size at time 0 and 12 hours, showing a significant difference at the 12 hour time point between the shorter CAG (HD33i.8 and HD28i.2) versus the longer CAG (HD60i.4, HD60i.3, HD180i.5 and HD180i.7) alleles, consistent with decreased cell adhesion. (C) The relative intracellular [ATP] values were decreased in NPCs with longer CAG alleles (HD60i.4, HD60i.3, HD180i.5 and HD180i.7) compared to those with shorter CAG alleles (HD33i.8 and HD28i.2). (D) The relative intracellular [ATP/ADP] ratio for the longer CAG alleles (HD60i.3, HD60i.4, HD180i.5 and HD180i.7) was significantly decreased compared to NPCs with shorter CAG alleles (HD33i.8 and HD28i.2). All graphs show plotted cell values normalized to the low CAG allele controls. Error bars indicate S.D., p values are indicated as less than * 0.05, ** 0.01 and *** 0.001.
Differentiated NSCs with Large CAG Expansion Show an Electrophysiology and Cell Death Phenotype
In order to establish whether HD NSCs could give rise to neurons with electrophysiological properties, NSCs were dissociated, plated on laminin and allowed to differentiate for 14 days in defined medium (short differentiation; Figure 1C) before performing whole patch clamp recordings. MAP2a/b and GABA staining showed that all three lines generated neurons (Figure 3A) with functional expression of voltage-activated K+ currents (Figure 3B), voltage-activated Na+ currents (Figure 3C), voltage-activated Ca2+ currents (Figure 3D) and GABAA receptor Cl− currents (Figure 3E). Maturing neurons from all lines also generated induced (Figure 3F) and spontaneous (Figure 3G) action potentials that correlated well with expression of voltage-gated Na+ channels (Table S4). Importantly, there were repeat-associated differences in the neurons ability to fire action potentials, either spontaneously or after current injection. In the HD180i.5/7 clones, no spontaneously firing neurons could be detected by 2 weeks of differentiation and there was no cell survival by 3 weeks of differentiation suggesting a gradual dying off of cells over time (Table S4). This was in contrast to the other lines which continued to express inward and outward currents and fire action potentials, all with similar magnitudes, and showed no increase in cell death at 3 weeks (Table S4). This acute cell death phenotype of the HD180 clones was reproduced by other consortium members using cell imaging and cleaved caspase 3 quantification (Figure 3H,I).
Figure 3. iPSCs can be Differentiated into Mature, Electrophysiologically Active Neurons Susceptible to Glutamate Toxicity.

(A) HD180i, HD60i and HD33i lines differentiated for 14 days were positive for MAP2a/b and GABA (Scale bar 50µm). (B) Current density (pA.pF−1) versus voltage (mV) relationships for the outward, voltage-activated currents of the exemplar conventional whole-cell recording shown in the inset in normal extracellular solution (ECS) and after isoosmotic addition of 20 mM tetraethylammonium chloride (TEA). Holding potential = −70 mV. (C) Current density (pA.pF−1) versus voltage (mV) relationships for the inward, voltage-activated currents of the same cell as in (B) in the presence of ECS and after isoosmotic replacement of Na+ with N-methyl D glutamine (NMDG). The exemplar family of Na+ currents in the inset was recorded in the presence of 20 mM TEA and is displayed on a fast time base. Holding potential = −70 mV. (D) Current (pA) versus voltage (mV) relationships, evoked using a voltage-ramp protocol, for currents carried by Ba2+ (27 mM, isoosmotic replacement of NaCl, Ba2+) in the absence and presence of 2 mM of the Ltype Ca2+ channel blocker, nifedipine (Ba2+ + Nif). Holding potential = −110 mV. (E) Current density (pA.pF−1) versus voltage (mV) relationship for Cl− currents activated by 300 mM GABA. The inset shows a family of GABA-activated currents recorded at the voltages shown in the main panel; GABA application is indicated by the bar above the traces shown and the voltage was stepped from −60mV to the voltages indicated in the main panel at the point indicated by the arrow. Holding potential = −70 mV. (F) Typical evoked action potential (upper trace) recorded under current-clamp in the conventional whole-cell patch-clamp configuration during the current injection shown in the lower trace (from 0 to + 120 pA). (G) Example of spontaneous action potential activity recorded under current-clamp (I = 0 mV) in the conventional whole-cell patch-camp configuration. (H,I) Staining for cleaved caspase 3 revealed increased apoptotic death in the HD180i.5 line over time compared with the control line HD33i.8 (p< 0.05, Students t-test).
HD NSCs Generate Forebrain Cell Types and DARPP-32-Positive Neurons
To further pattern NSCs towards a striatal fate, we modified a published long differentiation protocol with stepwise differentiation in defined media over a period of 72 days (Figure 1C; Aubry et al., 2008). Using this protocol, which included more growth factors and the plating of cell clusters rather than dissociated cells, the widespread cell death phenotype seen for the HD180 line at three weeks using the short differentiation protocol was avoided. The expression of both neural and striatal-specific genes gradually increased over time in all lines with no obvious disease specific differences (Figure 4A and S4). In addition, western blotting showed robust increases in cytoplasmic DARPP- 32 protein in differentiated cultures of the HD109i.1 line compared to NSCs (Figure 4B). Together this data suggests that the HD NSCs were capable of producing neurons with a striatal phenotype. We next used immunocytochemistry to visualize the developing striatal neurons (Figure 4C,D). Up to 10% of the cells from all lines were βIII-tubulin or Map2a/b-expressing neurons and up to 5% were DARPP-32/Bcl11B positive, but variation between cultures and lines after the long, complex differentiation was too large to determine statistical differences between HD and control samples at a single time point. There was also some variability in gene expression at the endpoint of differentiation among three HD and two control samples (Figure 4E), in contrast to the similarities seen between lines at the NSC stage (Figure 1I). Interestingly, in the HD NSCs patterned towards a striatal fate, the majority of genes showed increased expression relative to controls (Figure 4E and S4). Key pathways affected in HD were identified with IPA, including those involved in proliferation, signaling and cellular assembly (Table 1).
Figure 4. iPSCs can be Differentiated into a Striatal-like Phenotype.

(A) qRT-PCR from day 0 (NSC stage) to 86 using the long differentiation protocol for HD180i.5/7, HD60i.3/4 and HD28i.2/HD33i.8 demonstrates that neural (Mash1), neuronal (Map2) and striatal-specific (DARPP- 32 and Bcl11B) genes upregulate overtime. (B) Western blots for DARPP-32 in HD109i.1 NSCs and differentiated cells also show up-regulation in the cytoplasmic (C) but not nuclear fraction (N) upon differentiation. (C) HD180i, HD60i and HD33i cells differentiated for 56 days expressed βIII-Tubulin (immature neuron), DARPP-32 (striatal), GFAP (glia), Map2a/b (mature neuron) and GABA (GABAergic neuron). Nuclei stained with Hoechst. (D) HD109i.1 cells can be differentiated into mature, striatal-like neurons that express Map2a/b and Bcl11B. (E) Hierarchical clustering of top of 787 genes from striatal-like cells is represented by the vertical bars (yellow for HD and green for control). The dataset shows that most genes are up-regulated in the HD lines and that they can be separated into two defined clusters.
CAG Expansion-Associated Phenotypes in Neural Cultures Derived from HD NSCs
We next asked whether HD NSCs patterned towards a striatal fate had an increased risk of dying over time using the powerful approach of tracking live cells in longitudinal studies. Differentiated HD NSCs (long protocol) were transfected with a fluorescent reporter and followed by automated imaging and a longitudinal analysis system (Arrasate and Finkbeiner, 2005). The tracked cells that were frequently seen to die in these experiments often had morphological features of neurons, including tapering dendrite-like processes and thin axon-like processes extending hundreds of microns and tipped with growth cones (Figure 5A). To further confirm the identity of tracked live cells, separate cultures were fixed and cells with very similar morphologies were shown to express Map2a/b (Figure S5). By imaging labeled cells with neuronal-like morphology over time, we established that the cumulative risk of death was significantly higher for the HD180i.5 and HD60i.4 lines than the HD33i.8 line (Figure 5B). This is likely due to the expression of expanded CAGs in these lines, and indeed we showed that over-expressing 134 CAG repeats in the control HD33i.8 line led to an increased risk of death, similar to that seen in the HD180i.7 line (Figure 5C).
Figure 5. HD iPSCs Show Increased Risk of Death Over Time in Culture and Following Trophic Factor Withdrawal.

(A) Examples from a time series of images of two differentiated cells at day 35 from the HD33i.8 and HD60i.4 lines. Often cell bodies (hollow arrow, top and bottom rows) extend 1–3 processes, which are tipped by structures resembling growth cones (solid arrow, upper row, day 1). Degeneration and cell death were evident (bottom row, compare days 3–5) from the blebbing and retraction of neurites (closed arrows) and the loss of the cell soma (open arrow). Scale bar = 50 µm. (B) Kaplan-Meier analysis revealed that the cumulative risk of death was higher for the 180i.5 (hazard ratio is 1.4, p<0.01, n=337 cells) and the HD60i.4 (hazard ratio is 1.5, p<0.001, n=164 cells) lines compared to the HD33i.8 (n=248 cells) line. Total n=750 cells; 6 experiments for HD60i.4, 7 for HD180i.5 and 8 for HD33i.8.
(C) The cumulative risk of death is significantly increased in HD33i.8 cells over-expressing (by plasmid transfection) 134 CAG repeats (94 cells) compared to cells over-expressing 17 CAG repeats (92 cells). P<0.01, hazard ratio is 1.7, n=2 experiments. (D) The risk of death was significantly higher for the HD180i.7 line (195 cells) grown in BDNF compared to the HD33i.8 line (134 cells) grown in BDNF. Hazard ratio is 2.1 (p<0.001). After BDNF removal, the risk of death was significantly greater for the HD180i.7 line (156 cells) compared to the HD33i.8 line (n=191 cells), the hazard ratio is 2.56 (p<0.001). Removal of BDNF did not significantly increase the risk of death for the HD33i.8 and HD180i.7 lines compared to the lines grown in BDNF, however the increased risk of death for the HD180i.7 line after BDNF removal approached significance, p=0.08, hazard ratio=1.22, n=4 experiments. (E) BDNF was withdrawn for 48 hours, and cells were fixed and labeled with Hoechst. Quantifying condensed nuclei as a measure of cell toxicity showed that both HD109i.1 and HD180i.5 lines had significantly more cell death after BDNF withdrawal, whereas the HD33i.8 control line showed no change. ANOVA;* indicates p<0.01. (F) Quantifying caspase 3/7 after BDNF was withdrawn for 24 hours showed that both clones of the HD180i line demonstrated significant increases in caspase 3/7 activity. In addition to BDNF withdrawal, dbcAMP and VPA were removed from the medium as they increase endogenous BDNF transcription (Pruunsild et al., 2011). (G) Addition of 4X BDNF reduced the cumulative risk of death for HD180i.7. The risk of death is significantly less for the HD180i.7 line plus 4X BDNF (108 cells) compared to the HD180i.7 line alone (182 cells) (p<0.001). The hazard ratio is 0.67. There is no difference in the cumulative risk of death between the HD33i.8 line (208 cells) that received 4X BDNF (156 cells) p=0.43. The hazard ratio is 1.06, n=4 experiments.
BDNF is reduced in HD patients, and may be connected with striatal degeneration (Zuccato and Cattaneo, 2009). In order to establish whether the HD lines may be sensitive to BDNF, we removed it from the medium and tracked cells over time. Following BDNF withdrawal, there was a higher cumulative risk of death in the HD180i.7 cells than the HD33i.8 cells (Figure 5D). Complementary studies using a nuclear condensation assay confirmed that another HD line (HD109i.1) and an additional clone (HD180i.5) also showed significantly greater amounts of cell death following BDNF withdrawal from the media than the HD33i.8 control line (Figure 5E). We also found a robust and significant CAG-associated increase in caspase 3/7 activity upon BDNF withdrawal, across multiple clones of the HD180i line although the HD60 line showed a more variable clonal response (Figure 5F). Interestingly, the addition of four times the normal concentration of BDNF to the HD180.7 cultures significantly reduced the cumulative death, although not to control levels (Figure 5G).
We wanted to establish whether exposing HD cells to excitotoxic stress using glutamate could bring out a more robust phenotype, as has been shown previously using hydrogen peroxide on dopamine neurons derived from Parkinson’s disease iPSCs (Nguyen et al, 2011). Using the short differentiation protocol we first confirmed that increases in [Ca2+]I were evoked by extracellular KCl, γ-aminobutyric acid,L-glutamate/L-glycine, N-methyl-D-aspartic acid, kainate, and α-amino-3- hydroxyl-5-methyl-4-isoxazole-propionate (AMPA), demonstrating that GABAA and the three subtypes of ionotropic glutamate receptors were expressed in these cultures (Figure S6). Then, cultures were exposed to 20 second pulses of glutamate and examined using fura-2 ratiometric imaging of intracellular Ca2+ concentration ([Ca2+]i). Interestingly, using this assay there was a clear CAG expansion-dependent phenotype in Ca2+ handling after 20-second pulses with glutamate (Figure 6A). Since in HD there is evidence for chronic, elevated exposure of cells to glutamate (Behrens et al., 2002; Faideau et al., 2010), we also examined cells differentiated under chronic exposure to pathological levels of glutamate (150µM), which significantly exacerbated the Ca2+ dyshomeostatis in the HD180i lines (Figure 6B).
Figure 6. HD iPSCs have Increased Vulnerability to Stress and Toxicity.

(A) Using the short differentiation protocol, Ca2+ dysfunction was significantly elevated in the HD lines compared to the HD33i.8 line (* p< 0.02; † p <0.001). (B) As (A) except following a 14-day chronic pre-treatment with pathological glutamate (150 µM). Significantly different from *HD33i.8 p< 0.005; † HD60i.4 p< 0.0001. (C) Images demonstrate TUNEL-positive nuclei (green) and total nuclei (blue) in HD and control lines after exposure to no glutamate or 5 glutamate pulses. (D) HD iPSCs were differentiated for 56 days before repeated 30-minute pulses (0–5) with 50 µM glutamate. Cells were allowed to rest 24 hours before analyzing cell death. Compared to 0 glutamate pulses, TUNEL staining was significantly increased in both clones of the HD180i line after 4 or 5 glutamate pulses and in both clones of the HD60i line after 5 glutamate pulses. The control lines showed no significant increase after 5 pulses using a one-way ANOVA with Bonferroni post-test. (E) Images demonstrate non-condensed nuclei (arrows) and bright condensed nuclei (arrowheads) in HD180i.5 and HD33i.8 differentiated iPSCs in either non-treated media or media treated with 300 µM H2O2, 10 µM lactacystin or 5 mM 3-MA. (F) Nuclear condensation assay shows enhanced toxicity of HD180i.5 cells compared to control HD33i.8 cells upon treatment with H2O2 or 3-MA.
*Significantly different (p<0.05).
We next assessed the effects of glutamate pulsing using the long differentiation protocol. Staining and quantification of TUNEL-positive nuclei demonstrated that multiple 30-minute glutamate pulses led to an increased level of cell death in the HD cultures (Figure 6C,D). While the HD33i line showed apparent increases in death after pulsing, it also had a higher basal level of cell death (40% vs 20%) and so this increased death did not reach significance when compared to basal levels. While repeated glutamate pulsing has previously been shown to induce aggregation of the polyQ-expanded protein ATXN3 in SCA3 iPSC lines (Koch et al., 2011), we did not see aggregation of the expanded HTT protein by ICC in these cultures (data not shown). Finally, we evaluated the effects of other HD-related toxic stressors on cell survival. Both H2O2 (oxidative stress) and 3-MA (autophagy inhibition) but not lactacystin led to an increased amount of cell death in the HD lines when compared to controls (Figure 6 E,F). Together these data suggest that the risk of death for HD iPSC differentiated cultures was far greater than that of the control cultures. This was evident through multiple means of stressing the HD-derived cells, including the withdrawal of trophic support, pulsing with glutamate or addition of cellular stressors.
Discussion
This is the first study to characterize a set of CAG expansion-associated phenotypes in neural cells derived from HD iPSC lines. A unique aspect of the current report was that we worked as a consortium, using the same set of lines in a wide range of cellular assays. HD is an ideal disorder for exploring the utility of iPSC for disease modeling as it is caused by a single gene and there is a strong correlation between the length of the expanded of CAG repeat and age of disease onset (Consortium 1993), Stine et al 1993). In addition, there is a weaker, though still highly significant correlation between the length of the expanded repeat and rate of progression some clinical phenotypes (e.g. motor and cognitive disorder) though not others (e.g. emotional disorders) (Rosenblatt et al 2012). Interestingly, we found that in some assays such as cellular aggregation, overall energy metabolism and cumulative risk of death over time in the long differentiation protocol, both the HD60 and HD180 lines showed very similar pathological profiles that were significantly different from control lines. However, in other assays, such as cell survival in a short differentiation protocol, BDNF withdrawal and glutamate toxicity, only the HD180 line (and, where tested, the 109 line) showed a robust phenotype. Finally, in one assay we developed based on calcium homeostasis following repeated glutamate pulsing, we saw a clear repeat dependent phenotype with a graded response across the HD33, HD60 and HD180 lines. The gene array studies also suggested a gradation of expression changes, particularly those that are differentially expressed in both the very long repeat lines (HD180, HD109), and the more moderate length repeat (HD60) compared to control lines, but show differences clearly segregating between the long and medium repeat lines within this group. Together these studies suggest that there are clear phenotypes associated with expanded CAG repeats, and that the choice of assay and exact tissue culture conditions will determine the extent of the phenotypic gradation with length of the CAG expansion that can be detected.
The success of this model reflected the maintenance of the HTT CAG repeat expansion following reprogramming, stem cell expansion and subsequent differentiation. The HD lines demonstrated only mild CAG repeat instability in culture, and the slight increase in repeat number with passaging for one of the longest CAG lines (HD109) may correspond to the somatic genomic CAG instability seen in tissues from HD patients (Shelbourne et al., 2007). As expected, we found expression of the mutant protein in these cultures, although no inclusion bodies were found in the cells before or after differentiation, or after the addition of cellular stressors, possibly reflecting the long period of time before inclusions develop in the human disease (Ross and Poirier, 2004). It is important to note that while HTT inclusions are pathognomonic in post mortem tissue, inclusion formation is not linked to HTT cell toxicity (Arrasate et al., 2004).
Alterations in gene transcription and protein expression are prominent in HD mouse models and human HD brain tissue (Ross and Thompson, 2006). In dividing HD NSCs, which had a very stable number of nestin-positive progenitors, we observed HD-related changes in gene expression including SLC1A3 (Fan and Raymond, 2007), UCHL1 ( Xu et al., 2009), EGFR (Lievens et al., 2005), and TRK receptors (Apostol et al., 2008; Zuccato et al., 2010), consistent with changes in human HD brain (Hodges et al., 2006), and HD transgenic mouse striatum (Luthi-Carter et al., 2000). Among the genes up-regulated, GLB1, PLSCR4, PTGIS and PLA2 have been implicated in lipid metabolism and membrane fluidity, with possible consequences for cell signaling and receptor function in HD (Karasinska and Hayden, 2011). Additional novel altered pathways were identified, including a network of G-protein coupled receptors, developmental genes such as PAX6, and matrix metalloproteinases, consistent with the involvement of this family of proteases in mutant HTT toxicity (Miller et al., 2010). The concordance of pathways and networks at RNA and protein levels further suggests a primary dysfunction of these systems in this model of HD. These results suggest that expanded CAG repeats were having a biological effect even at the neural stem cell stage and further analysis of these novel pathways may uncover factors that contribute to emerging HD pathology (Molero et al., 2009).
Following differentiation to a striatal-like phenotype, we found more genes with increased rather than decreased expression, as shown previously in studies of human HD striatum (Hodges et al., 2006). Genes up-regulated in human tissue and differentiated HD iPSCs included p53, which is also up-regulated in HD mice and may contribute to the cell death seen in this study and by others (Bae et al., 2005); syndecan4, involved in recycling of lipids and cholesterol from degenerating terminals (Blain et al., 2004); HMG box protein 1, a tumor suppressor and transcription factor that accumulates in the Alzheimer’s brain and may impair Aβ clearance (Takata et al., 2004); and SRPX, which contributes to language and cognitive development (Royer et al., 2007). An advantage of this iPSC model is that gene expression changes in human neurons can be identified overtime during the degeneration process and at specific stages of neuronal differentiation to illuminate pathogenic mechanisms, in contrast to gene expression studies done only in end-stage post-mortem human HD brain tissue.
A number of dominant, CAG length–dependent biochemical and cell biological phenotypes, such as cell adhesion and altered energetics, have been observed in murine Hdh CAG knock-in ESCs and derived immortalized lines (Gines et al., 2010; Jacobsen et al., 2011). Neural progenitors derived from the HD60i and HD180i NSC lines were found to undergo less aggregation upon plating, and showed significantly reduced ATP levels compared to control lines. This suggests disruptions of cell adhesion and energy metabolism, which may alter the cells’ ability to survive and differentiate appropriately. This was reflected by a gradual reduction in the number of neurons that could generate spontaneous and induced action potentials over time in the HD lines, and ultimately cell death by three weeks of differentiation in the HD180i cultures. Thus, our studies showed that under specific culture conditions there was a severe phenotype associated with endogenous levels of mutant HTT expression.
Using a longer differentiation protocol that included addition of multiple growth factors to direct the cells towards a striatal lineage (Aubry et al., 2008), it was possible to avoid the acute stress-related neural cell death seen in the HD NSC lines, again reinforcing the idea of stress being a key component of these in vitro models of disease. A very sensitive single cell time-lapse assay (Arrasate et al., 2004) showed conclusively that cells within the HD60i and HD180i lines had a significantly greater cumulative risk of death than those in control lines. Furthermore, a similar cell death pattern in control lines could be seen by over-expression of mutant but not normal HTT. To uncover further phenotypes in cultures at single time points may require stressors to the system, as shown in iPSC models of Parkinson’s disease and SCA3 (Mattis and Svendsen, 2011; Seibler et al., 2011). We found clear repeat expansion-associated differences in the vulnerability of cells to the addition of exogenous stressors, such as H2O2 or 3-MA, or by repetitive exposure to glutamate. This is of interest in light of studies showing that HD may be associated with increased reactive oxygen species (Tunez et al., 2011). Withdrawal of BDNF from the medium also revealed a CAG expansion-associated toxic phenotype, based on the time-lapse assay, nuclear condensation assays, and caspase activation. There is a long literature on the role of BDNF in HD pathogenesis in relation to striatal neuron vulnerability (Zuccato and Cattaneo, 2009), as well as reported toxicity in response to BDNF withdrawal in a single HD iPSC line (Zhang et al., 2010). Our new data further support a central role of BDNF in HD. It will be of interest to test if there is preferential cell toxicity in neurons expressing striatal markers, as contrasted with other neurons in the culture. This kind of preferential toxicity was seen for dopamine neurons in a recent report on iPSCs derived from a patient with a LRRK2 mutation (Nguyen et al., 2011). However in HD, unlike Parkinson’s disease, there is widespread neuronal dysfunction and death, especially in cases with long repeats, so cell toxicity may not be limited purely to striatal neurons.
Our study is notable for detecting clear CAG expansion-dependent phenotypes, including cell toxicity, as would be expected for a neurodegenerative disease such as HD. We observed three variations on the relationship between phenotypes and the length of the CAG expansion in cells differentiated from HD iPSCs compared to controls. Some phenotypes were present in the HD lines in a graded fashion that correlated with the length of the CAG expansion. Others were only found in lines with the longest CAG expansion. Still others were present to a similar extent in lines with HD-associated CAG expansions of any length. The ability to detect a relationship between the length of the CAG expansion and dysfunction induced by mHTT will likely depend on a number of factors including the sensitivity and dynamic range of a particular assay and the cell type being studied. Our data would also be consistent with a model of HD pathogenesis in which the number of affected pathways and, in some cases, the extent of their dysfunction varies with the length of the CAG expansion. The CAG-dependence of neurodegeneration could therefore be an emergent property of the cumulative effect of a multifarious network of pathways affected by mHTT.
In conclusion, we have developed and characterized an iPSC model of HD that includes multiple lines, clones and repeat lengths. Future experiments using an allelic series of of cell lines with a range of expanded repeat lengths will help define the expanded- repeat length dependence of different phenotypes. The utility this new model system includes elucidation of HD cellular pathogenesis, development of HD-specific biomarkers, and ultimately screening for small molecule or other therapeutic interventions.
EXPERIMENTAL PROCEDURES
Generation and Characterization of iPSC Lines
Human fibroblast lines were obtained from two HD patients with expanded CAG alleles of 60 and 180 repeats and from one non-HD sister of the former with 33 repeat CAG alleles (Tables 1 and S2). Reprogramming was conducted by lentiviral transduction of six transcription factors (Oct4, Sox2, Klf4, cMyc, Nanog and Lin28) as previously described (Yu et al., 2007). A number of clonal colonies with iPSC morphology (Figure 1A) were expanded into stable iPSC lines named HD33i.x, HD60i.x and HD180i.x where “x” defines the clone number. Additional iPSC lines were generated from patient fibroblast samples collected by consortium members (Table 1; HD109 and HD21), using retroviral transduction and maintenance of iPSC colonies as described in Takahashi et al., 2007. A previously generated control line (HD28i.2) was also used in some experiments (WT4.2; Ebert et al., 2009). Finally, HD lines have been generated, but not yet characterized, using nonintegrating methods (Yu et al., 2009). Karyotyping and teratoma formation were performed, and are described further in supplemental methods.
Generation of iPSC-Derived NSC Lines
NSC lines were generated by collagenase treating (1mg/ml, Gibco) iPSC colonies and lifting them from the feeder layers directly into Stemline medium (Sigma) supplemented 100ng/ml basic FGF (Chemicon), 100ng/ml EGF (Chemicon), and 5µg/ml heparin (Sigma) in polyhema-coated flasks to prevent attachment. iPSC-derived NSCs were expanded as spherical aggregates and passaged weekly with a chopping technique (Svendsen et al., 1998).
Neural Differentiation from NSCs
A short differentiation protocol with NSCs plated onto laminin coated coverslips was used for some experiments (Figure 1C, see supplemental methods). In addition, a long differentiation protocol was used based on a protocol from Aubry et al., 2008 (Figure 1C). Growth medium containing EGF/FGF was removed from NSCs, and cells were plated on laminin or allowed to aggregate for 5 days in NIM (1% N2 in DMEM:F12). BDNF (20ng/ml; Peprotech 450-02) was then added for 2 days. The medium was then supplemented for 21 days with BDNF, rhShh (200ng/ml; R&D 1845-SH), and Dkk1 (100ng/ml; R&D 1096-DK-010). The rest of the differentiation was then completed in NIM with BDNF, dibutyryl cyclic AMP (dbcAMP, 0.5mM; Sigma D0260) and valproic acid (VPA, 0.5mM; Sigma P4546). Medium was half-changed twice per week or as needed. If cells were differentiated as aggregates, they were plated on day 42.
RNA Isolation and Quantitative Reverse-Transcriptase PCR Analysis
Total RNA was isolated using the RNeasy Mini Kit (Qiagen), followed by DNase I digestion (RQ1 DNAse, Promega). Complementary DNA was generated from 0.5–2µg total RNA using a Reverse Transcript System (Promega A3500 or Invitrogen). qRT–PCR and primer sequences are described in supplemental methods.
Immunocytochemistry
Cells were fixed in 4% paraformaldehyde (PFA) at room temperature, rinsed with PBS and permeabilized with 5% normal goat and/or donkey serum containing 0.2% Triton X-100 for 30 minutes at room temperature. Cells were then labeled with primary antibodies (listed in supplemental methods) for 60 minutes at room temperature or overnight at 4°C, followed with the appropriate fluorescently-tagged secondary antibodies for 60 minutes at room temperature. Hoechst nuclear dye was used to label nuclei. Cells were counted using stereological software (stereoinvestigator).
Western Blotting
Western blotting was performed per manufacturer recommendations. The HTT-specific antibody 2166 (Millipore) was used to detect HTT protein in the control and HD lines. The expanded polyglutamine-specific antibody IC2 (Chemicon) was used to detect mutant HTT in the HD lines.
BDNF Withdrawal
Cells were differentiated toward a striatal fate for 52–54 days and then transferred into basic NIM without BDNF, VPA and dbcAMP for 48 hours. Cell death was measured by quantifying condensed nuclei (described in below assay). In addition, cells were differentiated towards a striatal fate for 42 days and then transferred into basic NIM, NIM plus 10ng/ml BDNF/0.25mM VPA/ 0.25mMdbcAMP, NIM plus 20ng/mL BDNF/0.5mMVPA/ 0.5mMdbcAMP, or NIM plus 20ng/ml BDNF alone for 24 hours. Caspase 3/7 activity was measured using a Caspase-Glo 3/7 assay (see supplemental methods). dbcAMP and VPA were removed from the medium in the above experiments as they increase endogenous BDNF transcription but are not critical for cell survival (Pruunsild et al., 2011).
Cell Stress and Toxicity Assays
To assess the effects of cellular stressors, differentiated iPSCs were treated with 3-methyladenine (3-MA, 5 mM) for autophagy inhibition, lactacystin (10 µM) for proteasome inhibition, and hydrogen peroxide (H2O2, 300 µM) for oxidative stress. All reagents were purchased from Sigma. Cells were then fixed with 4% PFA, permeabilized with 0.3% Triton-X100 and stained with 0.4 µg/ml Hoechst 33342. Cell toxicity was assayed by quantifying condensed nuclei by the Volocity software (Perkin- Elmer) with the Zeiss Axiovert 200 microscope and is described further in supplementary methods. Cells were considered as non-viable when their Hoechst intensity was greater than 200% of the control intensity.
To assess the effects of cellular toxicity, cells were differentiated for 56 days and then treated with 0–5 30-minute pulses of 50 µM glutamate (Sigma G1251) in DMEM:F12 1:1, with 30-minute no-glutamate rests between pulsing. At the end of treatment, cells were maintained in conditioned media for 24 hours before fixation in 4% PFA. Effects of glutamate pulses were assessed by quantifying TUNEL incorporation per total Hoechst-stained nuclei, according to manufacturer recommendations (Promega DeadEndFluorometric TUNEL System, G3250). Effects of glutamate pulses were also assessed by measuring Ca2+dyshomeostasis (see supplemental methods).
Automated Survival Assays
Cells were transfected with reporter genes and then plated and imaged as described (Arrasate and Finkbeiner, 2005; Arrasate et al., 2004) and in supplemental methods.
Electrophysiology and Calcium Imaging
Details are given in Figure legends and supplemental methods.
Gene Expression Studies
Microarray experiments were performed using Affymetrix Human Gene 1.0 ST Arrays. RNA integrity was verified using a Bioanalyzer 2100 (Agilent) and processed at the UC Irvine Genomics High-Throughput Facility. Additional details in supplemental methods.
iTRAQ Procedure and LC-MS Analysis
Total cell lysates were prepared from HD33i.8, HD60i.4, and 180i.5 cell lines (two duplicate samples from each cell line), and the proteins were precipitated with TCA and subjected to iTRAQ procedure.
HPLC Analysis of Adenine Nucleotides
HPLC analysis was performed on NPCs to analyze quantitative differences on cellular ATP/ADP ratios, as described in supplemental methods.
Phalloidin Assay
For phalloidin staining, cells were incubated in phalloidin reagent, as described in supplemental methods.
Cell Cluster Formation Assay
Dissociated NPCs were plated and clump size was measured after 12 hours, as described in supplemental methods.
Supplementary Material
Induced pluripotent cell lines with range of CAG repeats generated from HD patients
Genomic profiles of HD iPSC derived neurons show disease specific expression patterns
HD lines with long CAG repeats show energy, adhesion and electrophysiological deficits and were most susceptible to stress and BDNF withdrawal
The HD lines are a valuable resource for mechanistic studies and drug screens
ACKNOWLEDGMENTS
We thank HD patients and their families for their essential contributions to this research and Nissim Benvenisty for critical reading. Primary support for this work was from RC2-NS069422 (L.M.T., C.N.S., J.F.G., C.A.R. and S.F) and from the CHDI Foundation, Inc (E.C., N.A., P.K.). Additional support was provided by P50NS16375, P50NS16367 (HD Center Without Walls) and R01NS32765, CIRM fellowships TG2-01160 (J.A.K.) and TG2-01152 (A.K) and CIRM New Cell Line Grant RL1- 00678-1 (L.M.T), the Taube-Koret Center and the Hellman Family Foundation (S.F.), and the Charlotte Geyer Foundation (J.T.) and NIH grant PO1 GM081629 (J.T.).
Footnotes
Publisher's Disclaimer: This is a PDF file of an unedited manuscript that has been accepted for publication. As a service to our customers we are providing this early version of the manuscript. The manuscript will undergo copyediting, typesetting, and review of the resulting proof before it is published in its final citable form. Please note that during the production process errors may be discovered which could affect the content, and all legal disclaimers that apply to the journal pertain.
References
- Apostol BL, Simmons DA, Zuccato C, Illes K, Pallos J, Casale M, Conforti P, Ramos C, Roarke M, Kathuria S, et al. CEP-1347 reduces mutant huntingtin-associated neurotoxicity and restores BDNF levels in R6/2 mice. Mol Cell Neurosci. 2008;39:8–20. doi: 10.1016/j.mcn.2008.04.007. [DOI] [PubMed] [Google Scholar]
- Arrasate M, Finkbeiner S. Automated microscope system for determining factors that predict neuronal fate. Proc Natl Acad Sci U S A. 2005;102:3840–3845. doi: 10.1073/pnas.0409777102. [DOI] [PMC free article] [PubMed] [Google Scholar]
- Arrasate M, Mitra S, Schweitzer ES, Segal MR, Finkbeiner S. Inclusion body formation reduces levels of mutant huntingtin and the risk of neuronal death. Nature. 2004;431:805–810. doi: 10.1038/nature02998. [DOI] [PubMed] [Google Scholar]
- Aubry L, Bugi A, Lefort N, Rousseau F, Peschanski M, Perrier AL. Striatal progenitors derived from human ES cells mature into DARPP32 neurons in vitro and in quinolinic acid-lesioned rats. Proc Natl Acad Sci U S A. 2008;105:16707–16712. doi: 10.1073/pnas.0808488105. [DOI] [PMC free article] [PubMed] [Google Scholar]
- Bae BI, Xu H, Igarashi S, Fujimuro M, Agrawal N, Taya Y, Hayward SD, Moran TH, Montell C, Ross CA, et al. p53 mediates cellular dysfunction and behavioral abnormalities in Huntington's disease. Neuron. 2005;47:29–41. doi: 10.1016/j.neuron.2005.06.005. [DOI] [PubMed] [Google Scholar]
- Behrens PF, Franz P, Woodman B, Lindenberg KS, Landwehrmeyer GB. Impaired glutamate transport and glutamate-glutamine cycling: downstream effects of the Huntington mutation. Brain. 2002;125:1908–1922. doi: 10.1093/brain/awf180. [DOI] [PubMed] [Google Scholar]
- Blain JF, Paradis E, Gaudreault SB, Champagne D, Richard D, Poirier J. A role for lipoprotein lipase during synaptic remodeling in the adult mouse brain. Neurobiol Dis. 2004;15:510–519. doi: 10.1016/j.nbd.2003.12.001. [DOI] [PubMed] [Google Scholar]
- Bradley CK, Scott HA, Chami O, Peura TT, Dumevska B, Schmidt U, Stojanov T. Derivation of Huntington's disease-affected human embryonic stem cell lines. Stem Cells Dev. 2011;20:495–502. doi: 10.1089/scd.2010.0120. [DOI] [PubMed] [Google Scholar]
- Camnasio S, Carri AD, Lombardo A, Grad I, Mariotti C, Castucci A, Rozell B, Riso PL, Castiglioni V, Zuccato C, Rochon C, Takashima Y, Diaferia G, Biunno I, Gellera C, Jaconi M, Smith A, Hovatta O, Naldini L, Di Donato S, Feki A, Cattaneo E. The first reported generation of several induced pluripotent stem cell lines from homozygous and heterozygous Huntington's disease patients demonstrates mutation related enhanced lysosomal activity. Neurobiology of Disease. 2012;46:41–51. doi: 10.1016/j.nbd.2011.12.042. 2012. [DOI] [PubMed] [Google Scholar]
- Consortium TH. A novel gene containing a trinucleotide repeat that is expanded and unstable on Huntington's disease chromosomes. The Huntington's Disease Collaborative Research Group. Cell. 1993;72:971–983. doi: 10.1016/0092-8674(93)90585-e. [DOI] [PubMed] [Google Scholar]
- Ebert AD, Yu J, Rose FF, Jr, Mattis VB, Lorson CL, Thomson JA, Svendsen CN. Induced pluripotent stem cells from a spinal muscular atrophy patient. Nature. 2009;457:277–280. doi: 10.1038/nature07677. [DOI] [PMC free article] [PubMed] [Google Scholar]
- Faideau M, Kim J, Cormier K, Gilmore R, Welch M, Auregan G, Dufour N, Guillermier M, Brouillet E, Hantraye P, et al. In vivo expression of polyglutamine-expanded huntingtin by mouse striatal astrocytes impairs glutamate transport: a correlation with Huntington's disease subjects. Hum Mol Genet. 2010;19:3053–3067. doi: 10.1093/hmg/ddq212. [DOI] [PMC free article] [PubMed] [Google Scholar]
- Fan MM, Raymond LA. N-methyl-D-aspartate (NMDA) receptor function and excitotoxicity in Huntington's disease. Prog Neurobiol. 2007;81:272–293. doi: 10.1016/j.pneurobio.2006.11.003. [DOI] [PubMed] [Google Scholar]
- Gines S, Paoletti P, Alberch J. Impaired TrkB-mediated ERK1/2 activation in huntington disease knock-in striatal cells involves reduced p52/p46 Shc expression. J Biol Chem. 2010;285:21537–21548. doi: 10.1074/jbc.M109.084202. [DOI] [PMC free article] [PubMed] [Google Scholar]
- Hodges A, Strand AD, Aragaki AK, Kuhn A, Sengstag T, Hughes G, Elliston LA, Hartog C, Goldstein DR, Thu D, et al. Regional and cellular gene expression changes in human Huntington's disease brain. Hum Mol Genet. 2006;15:965–977. doi: 10.1093/hmg/ddl013. [DOI] [PubMed] [Google Scholar]
- Jacobsen JC, Gregory GC, Woda JM, Thompson MN, Coser KR, Murthy V, Kohane IS, Gusella JF, Seong IS, MacDonald ME, et al. HD CAG-correlated gene expression changes support a simple dominant gain of function. Hum Mol Genet. 2011;20:2846–2860. doi: 10.1093/hmg/ddr195. [DOI] [PMC free article] [PubMed] [Google Scholar]
- Karasinska JM, Hayden MR. Cholesterol metabolism in Huntington disease. Nat Rev Neurol. 2011;7:561–572. doi: 10.1038/nrneurol.2011.132. [DOI] [PubMed] [Google Scholar]
- Koch P, Breuer P, Peitz M, Jungverdorben J, Kesavan J, Poppe D, Doerr J, Ladewig J, Mertens J, Tuting T, et al. Excitation-induced ataxin-3 aggregation in neurons from patients with Machado-Joseph disease. Nature. 2011;480:543–546. doi: 10.1038/nature10671. [DOI] [PubMed] [Google Scholar]
- Langbehn DR, Hayden MR, Paulsen JS. CAG-repeat length and the age of onset in Huntington disease (HD): a review and validation study of statistical approaches. Am J Med Genet B Neuropsychiatr Genet. 2010;153B:397–408. doi: 10.1002/ajmg.b.30992. [DOI] [PMC free article] [PubMed] [Google Scholar]
- Lievens JC, Rival T, Iche M, Chneiweiss H, Birman S. Expanded polyglutamine peptides disrupt EGF receptor signaling and glutamate transporter expression in Drosophila. Hum Mol Genet. 2005 doi: 10.1093/hmg/ddi067. [DOI] [PubMed] [Google Scholar]
- Luthi-Carter R, Strand A, Peters NL, Solano SM, Hollingsworth ZR, Menon AS, Frey AS, Spektor BS, Penney EB, Schilling G, et al. Decreased expression of striatal signaling genes in a mouse model of Huntington's disease. Hum Mol Genet. 2000;9:1259–1271. doi: 10.1093/hmg/9.9.1259. [DOI] [PubMed] [Google Scholar]
- Mattis VB, Svendsen CN. Induced pluripotent stem cells: a new revolution for clinical neurology? Lancet Neurol. 2011;10:383–394. doi: 10.1016/S1474-4422(11)70022-9. [DOI] [PubMed] [Google Scholar]
- Miller JP, Holcomb J, Al-Ramahi I, de Haro M, Gafni J, Zhang N, Kim E, Sanhueza M, Torcassi C, Kwak S, et al. Matrix metalloproteinases are modifiers of huntingtin proteolysis and toxicity in Huntington's disease. Neuron. 2010;67:199–212. doi: 10.1016/j.neuron.2010.06.021. [DOI] [PMC free article] [PubMed] [Google Scholar]
- Molero AE, Gokhan S, Gonzalez S, Feig JL, Alexandre LC, Mehler MF. Impairment of developmental stem cell-mediated striatal neurogenesis and pluripotency genes in a knock-in model of Huntington's disease. Proc Natl Acad Sci U S A. 2009;106:21900–21905. doi: 10.1073/pnas.0912171106. [DOI] [PMC free article] [PubMed] [Google Scholar]
- Nguyen HN, Byers B, Cord B, Shcheglovitov A, Byrne J, Gujar P, Kee K, Schule B, Dolmetsch RE, Langston W, et al. LRRK2 mutant iPSC-derived DA neurons demonstrate increased susceptibility to oxidative stress. Cell Stem Cell. 2011;8:267–280. doi: 10.1016/j.stem.2011.01.013. [DOI] [PMC free article] [PubMed] [Google Scholar]
- Park IH, Arora N, Huo H, Maherali N, Ahfeldt T, Shimamura A, Lensch MW, Cowan C, Hochedlinger K, Daley GQ. Disease-specific induced pluripotent stem cells. Cell. 2008;134:877–886. doi: 10.1016/j.cell.2008.07.041. [DOI] [PMC free article] [PubMed] [Google Scholar]
- Pruunsild P, Sepp M, Orav E, Koppel I, Timmusk T. Identification of cis-elements and transcription factors regulating neuronal activity-dependent transcription of human BDNF gene. J Neurosci. 2011;31:3295–3308. doi: 10.1523/JNEUROSCI.4540-10.2011. [DOI] [PMC free article] [PubMed] [Google Scholar]
- Reis SA, Thompson MN, Lee JM, Fossale E, Kim HH, Liao JK, Moskowitz MA, Shaw SY, Dong L, Haggarty SJ, et al. Striatal neurons expressing full-length mutant huntingtin exhibit decreased N-cadherin and altered neuritogenesis. Hum Mol Genet. 2011;20:2344–2355. doi: 10.1093/hmg/ddr127. [DOI] [PMC free article] [PubMed] [Google Scholar]
- Rosenblatt A, Kumar BV, Mo A, Welsh CS, Margolis RL, Ross CA. Age, CAG repeat length, and clinical progression in Huntington's disease. Mov Disord. 2012;27:272–276. doi: 10.1002/mds.24024. [DOI] [PubMed] [Google Scholar]
- Ross CA, Poirier MA. Protein aggregation and neurodegenerative disease. Nat Med. 2004;10(Suppl):S10–S17. doi: 10.1038/nm1066. [DOI] [PubMed] [Google Scholar]
- Ross CA, Tabrizi SJ. Huntington's disease: from molecular pathogenesis to clinical treatment. Lancet Neurol. 2011;10:83–98. doi: 10.1016/S1474-4422(10)70245-3. [DOI] [PubMed] [Google Scholar]
- Ross CA, Thompson LM. Transcription meets metabolism in neurodegeneration. Nat Med. 2006;12:1239–1241. doi: 10.1038/nm1106-1239. [DOI] [PubMed] [Google Scholar]
- Royer B, Soares DC, Barlow PN, Bontrop RE, Roll P, Robaglia-Schlupp A, Blancher A, Levasseur A, Cau P, Pontarotti P, et al. Molecular evolution of the human SRPX2 gene that causes brain disorders of the Rolandic and Sylvian speech areas. BMC Genet. 2007;8:72. doi: 10.1186/1471-2156-8-72. [DOI] [PMC free article] [PubMed] [Google Scholar]
- Seibler P, Graziotto J, Jeong H, Simunovic F, Klein C, Krainc D. Mitochondrial Parkin recruitment is impaired in neurons derived from mutant PINK1 induced pluripotent stem cells. J Neurosci. 2011;31:5970–5976. doi: 10.1523/JNEUROSCI.4441-10.2011. [DOI] [PMC free article] [PubMed] [Google Scholar]
- Seong IS, Ivanova E, Lee JM, Choo YS, Fossale E, Anderson M, Gusella JF, Laramie JM, Myers RH, Lesort M, et al. HD CAG repeat implicates a dominant property of huntingtin in mitochondrial energy metabolism. Hum Mol Genet. 2005;14:2871–2880. doi: 10.1093/hmg/ddi319. [DOI] [PubMed] [Google Scholar]
- Shelbourne PF, Keller-McGandy C, Bi WL, Yoon SR, Dubeau L, Veitch NJ, Vonsattel JP, Wexler NS, Arnheim N, Augood SJ. Triplet repeat mutation length gains correlate with cell-type specific vulnerability in Huntington disease brain. Hum Mol Genet. 2007;16:1133–1142. doi: 10.1093/hmg/ddm054. [DOI] [PubMed] [Google Scholar]
- Stine OC, Pleasant N, Franz ML, Abbott MH, Folstein SE, Ross CA. Correlation between the onset age of Huntington's disease and length of the trinucleotide repeat in IT-15. Hum Mol Genetics. 1993;2:1547–1549. doi: 10.1093/hmg/2.10.1547. [DOI] [PubMed] [Google Scholar]
- Svendsen CN, ter Borg MG, Armstrong RJ, Rosser AE, Chandran S, Ostenfeld T, Caldwell MA. A new method for the rapid and long term growth of human neural precursor cells. J Neurosci Methods. 1998;85:141–152. doi: 10.1016/s0165-0270(98)00126-5. [DOI] [PubMed] [Google Scholar]
- Takahashi K, Tanabe K, Ohnuki M, Narita M, Ichisaka T, Tomodo K, Yamanaka S. Induction of pluripotent stem cells from adult human fibroblasts by defined factors. Cell. 2007;131:861–872. doi: 10.1016/j.cell.2007.11.019. [DOI] [PubMed] [Google Scholar]
- Takata K, Kitamura Y, Tsuchiya D, Kawasaki T, Taniguchi T, Shimohama S. High mobility group box protein-1 inhibits microglial Abeta clearance and enhances Abeta neurotoxicity. J Neurosci Res. 2004;78:880–891. doi: 10.1002/jnr.20340. [DOI] [PubMed] [Google Scholar]
- Tunez I, Sanchez-Lopez F, Aguera E, Fernandez-Bolanos R, Sanchez FM, Tasset-Cuevas I. Important Role of Oxidative Stress Biomarkers in Huntington's Disease. J Med Chem. 2011;54:5602–5606. doi: 10.1021/jm200605a. [DOI] [PubMed] [Google Scholar]
- Vonsattel JP, Keller C, Del Pilar Amaya M. Neuropathology of Huntington's disease. Handb Clin Neurol. 2008;89:599–618. doi: 10.1016/S0072-9752(07)01256-0. [DOI] [PubMed] [Google Scholar]
- Walker FO. Huntington's disease. Lancet. 2007;369:218–228. doi: 10.1016/S0140-6736(07)60111-1. [DOI] [PubMed] [Google Scholar]
- Xu EH, Tang Y, Li D, Jia JP. Polymorphism of HD and UCHL-1 genes in Huntington's disease. J Clin Neurosci. 2009;16:1473–1477. doi: 10.1016/j.jocn.2009.03.027. [DOI] [PubMed] [Google Scholar]
- Yu J, Hu K, Smuga-Otta K, Tian S, Stewart R, Slukvin I, Thomson JA. Human induced pluripotent stem cells free of vector and transgene sequences. Science. 2009;324:797–801. doi: 10.1126/science.1172482. [DOI] [PMC free article] [PubMed] [Google Scholar]
- Yu J, Vodyanik MA, Smuga-Otto K, Antosiewicz-Bourget J, Frane JL, Tian S, Nie J, Jonsdottir GA, Ruotti V, Stewart R, et al. Induced pluripotent stem cell lines derived from human somatic cells. Science. 2007;318:1917–1920. doi: 10.1126/science.1151526. [DOI] [PubMed] [Google Scholar]
- Zhang N, An MC, Montoro D, Ellerby LM. Characterization of Human Huntington's Disease Cell Model from Induced Pluripotent Stem Cells. PLoS Curr. 2010;2:RRN1193. doi: 10.1371/currents.RRN1193. [DOI] [PMC free article] [PubMed] [Google Scholar]
- Zuccato C, Cattaneo E. Brain-derived neurotrophic factor in neurodegenerative diseases. Nat Rev Neurol. 2009;5:311–322. doi: 10.1038/nrneurol.2009.54. [DOI] [PubMed] [Google Scholar]
- Zuccato C, Valenza M, Cattaneo E. Molecular mechanisms and potential therapeutical targets in Huntington's disease. Physiol Rev. 2010;90:905–981. doi: 10.1152/physrev.00041.2009. [DOI] [PubMed] [Google Scholar]
Associated Data
This section collects any data citations, data availability statements, or supplementary materials included in this article.