

Abstract
Background
An industrially robust microorganism that can efficiently degrade and convert lignocellulosic biomass into ethanol and next-generation fuels is required to economically produce future sustainable liquid transportation fuels. The anaerobic, thermophilic, cellulolytic bacterium Clostridium thermocellum is a candidate microorganism for such conversions but it, like many bacteria, is sensitive to potential toxic inhibitors developed in the liquid hydrolysate produced during biomass processing. Microbial processes leading to tolerance of these inhibitory compounds found in the pretreated biomass hydrolysate are likely complex and involve multiple genes.
Methodology/Principal Findings
In this study, we developed a 17.5% v/v Populus hydrolysate tolerant mutant strain of C. thermocellum by directed evolution. The genome of the wild type strain, six intermediate population samples and seven single colony isolates were sequenced to elucidate the mechanism of tolerance. Analysis of the 224 putative mutations revealed 73 high confidence mutations. A longitudinal analysis of the intermediate population samples, a pan-genomic analysis of the isolates, and a hotspot analysis revealed 24 core genes common to all seven isolates and 8 hotspots. Genetic mutations were matched with the observed phenotype through comparison of RNA expression levels during fermentation by the wild type strain and mutant isolate 6 in various concentrations of Populus hydrolysate (0%, 10%, and 17.5% v/v).
Conclusion/Significance
The findings suggest that there are multiple mutations responsible for the Populus hydrolysate tolerant phenotype resulting in several simultaneous mechanisms of action, including increases in cellular repair, and altered energy metabolism. To date, this study provides the most comprehensive elucidation of the mechanism of tolerance to a pretreated biomass hydrolysate by C. thermocellum. These findings make important contributions to the development of industrially robust strains of consolidated bioprocessing microorganisms.
Introduction
Organic fuels, chemicals, and materials developed from plant biomass are among the leading options to meet sustainability requirements of the future [1]. Cellulosic biomass is an attractive feed stock for production of renewable fuels because of its widespread availability and relatively low cost [1]. The conversion process of cellulosic biomass to fuels utilizes biological fermentations. The most economic process combines the cellulase production, biomass hydrolysis, and sugar fermentation into a single step by a cellulose-fermenting microorganism in a consolidated bioprocessing (CBP) scheme [1,2]. CBP eliminates the cost of exogenous cellulase addition and consolidates capital equipment [2,3].
The plant cell walls of cellulosic biomass consist of several intertwined heterogeneous polymers, primarily cellulose, hemicelluloses (e.g., substituted xylans, mannans, ect.), pectin and lignin [4]. Various pretreatment methods are designed to make the sugars more available for subsequent hydrolysis and fermentation steps through the breakdown of the cell wall and the degradation of cellulose, hemicelluloses, and lignin matrix [4,5]. Most pretreatment processes produce compounds that are inhibitory to the organism used for fermentation. These inhibitory compounds come from the partial degradation of biomass components and include carboxylic acids (primarily acetic acid), furfural, 5-hydroxymethylfurfural (HMF), phenolic compounds, and inorganic salts [4]. The furan derivatives HMF and furfural are formed at high temperature and pressure as degradation products of hexoses and pentoses, respectively [4,6]. The phenolic compounds originate from the degradation of lignin [4,6]. Different biomass feedstocks and pretreatment methods produce different combinations of inhibitory compounds that stress the microorganisms [5-7]. Acetic acid, furfural and HMF are the most studied inhibitory compounds [4,5].
A variety of cellulolytic microorganisms are under development for biofuel production, but these organisms are typically poorly characterized [8,9]. An exception is Clostridium thermocellum which has been the subject of significant research for decades. C. thermocellum is a Gram-positive, anaerobic, thermophilic, cellulolytic bacterium that can rapidly solubilize biomass and use cellulose as a carbon and energy source [8,10,11]. High efficiency cellulose hydrolysis is aided by the cell surface attached multi-enzyme protein complex termed the cellulosome [11,12]. C. thermocellum’s cellulolytic ability gives it an advantage over organisms that are currently used for bioethanol production (e.g., yeast and Zymomonas), which can only ferment nonpolymeric carbohydrates, and has the potential to be a model organism for CBP [9,13]. C. thermocellum produces a number of industrially important fermentation products in addition to ethanol, including acetic acid, formic acid, lactic acid, and hydrogen[9]. Inhibitory compounds have been shown to reduce the rate of ethanol production and the overall yield [14,15]. Improved tolerance to inhibitory compounds found in pretreated biomass hydrolysate should improve the fermentation process and increase economic feasibility of consolidated bioprocessing.
C. thermocellum 27405 is among the rapidly growing number of microorganisms whose genome has been sequenced and annotated, and serves as a baseline for comparison to strains improved through engineering or evolution. Thus genomic sequencing can assist in determining the possible mutations responsible for an evolved phenotype. When genome sequencing is applied in a longitudinal manner, in which the genome is sequenced at various time points during its evolution, the mutation rate can be determined. Studies have shown that the mutation rate increases in the later phase of the adaption due to the development of a mutator phenotype [16]. However, the genome sequence that is obtained represents a population average rather than the sequence of any individual bacterium [17]. Therefore, it is not possible to characterize a species from a single genome sequence [17]. The best approximation to describe a species uses the concept of the pan-genome from multiple single cell isolates [17]. The pan-genome can be divided into three elements: a core genome that is shared by all single cell isolates; a set of shared mutations that are shared by some but not all single cell isolates; and a set of isolate-specific mutations that are unique to each single cell isolate [17]. When the pan-genome is combined with population samples, a fourth category of discarded mutations can be identified which occur in the population samples but not in the single cell isolates. The pan-genome reflects the selective pressure to generate new adaptive combinations by recombining and constantly restructuring gene variants (alleles) in the population [17]. RNA Sequencing (RNA-seq) is an emerging technology that is being used for expression studies and it offers several advantages over DNA microarrays such as better detection of genes expressed at low levels [18]. RNA-seq analysis is particularly relevant for controlled experiments comparing expression in wild type and mutant strains of the same microorganism [19].
To date, the majority of genetic regulation studies for C. thermocellum have focused on the cellulosome [10,20-25] or ethanol tolerance [3,8,13,26]. Only a few studies have looked at gene regulation of C. thermocellum on a global level [9,11,27]. At this time, there is no known research that investigates the effects of hydrolysates from pretreated biomass on C. thermocellum gene expression. Current research suggests that comparing the change in phenotype between a wild type strain and a mutant strain of bacteria can give the greatest insight into the genes which are essential to the change in phenotype between the two strains. Therefore, in this study, we created a mutant population of C. thermocellum tolerant to 17.5% v/v Populus hydrolysate from which we isolated seven single cell colonies. We have sought to understand the mechanism of tolerance by (1) sequencing the genomes of the wild type strain (WT), intermediate population samples, and final isolate samples; (2) conducting comparative fermentative growth studies with the wild type and a final mutant isolate stain; and (3) comparing gene expression between the two strains during fermentative growth studies.
Material and Methods
Strain and Culture Conditions
Clostridium thermocellum ATCC 27405 was obtained from Prof. Herb Strobel, University of Kentucky collection and denoted as the wild type strain (WT). In all experiments the cells were grown in media for thermophilic clostridia (MTC) with a substrate loading of 5 g/L cellobiose. The medium was composed of 0.336 g/L potassium chloride [KCl], 0.25 g/L ammonium chloride [NH4Cl], 1.00 g/L magnesium sulfate heptahydrate [MgSO4*7H2O], 1.70 g/L potassium phosphate [KH2PO4], 0.50 g/L MOPS [C7H14NO4S], 0.15 g/L calcium chloride dehydrate [CaCl2*2H2O], 1.75 g/L trisodium citrate dehydrate [Na3C6O7*2H2O], 0.6 g/L urea [CH4N2O], 1.00 g/L L-cysteine HCL, 0.30 mg/L resazurin, 2.0 mL of 1000x MTC minerals and 1.25 mL of 50x MTC vitamins [28,29]. All chemicals were reagent grade and obtained from Sigma (St. Louis, MO), unless otherwise indicated. The initial medium pH was approximately 6.8 - 7.0. The cells were grown in 25 mL Balch tubes (Bellco Glass, Inc., Vineland, NJ) and were incubated in the dark in an orbital shaker at 58 °C and 100 rpm.
Populus hydrolysate preparation and analysis
Milled Populus trichocarpa hydrolysate was pretreated at the National Renewable Energy Lab (NREL) using a 20% w/w solid loading and dilute concentrations of H2SO4 at temperatures of 165-195 °C [30]. Solids were removed by filtration. The Populus hydrolysate was adjusted to a pH of 7.0 using 50% w/w NaOH and filter-sterilized before being added to the MTC medium at various concentrations. HPLC analysis used a LaChrom Elite system (Hitachi High Technologies America, Inc. Pleasanton, CA) equipped with a refractive index detector (Model L-2490) and UV lamp (Model L-242OU). Metabolites were separated at a flow rate of 0.5 mL/min in 5 mM H2SO4 using an Aminex HPX-87H column (Bio-Rad Laboratories, Inc, Hercules, CA). GC-MS analysis used sorbitol (10 μl of a 1 mg/mL aqueous solution) added to 10 μl of sample as an internal standard to correct for differences in derivatization efficiency and changes in sample volume during heating. The sample was dried in a nitrogen stream and then dissolved in 500 μL of silylation–grade acetonitrile, followed by the addition of 500 mL N-methyl-N-trimethylsilyltrifluoroacetamide (MSTFA) with 1% trimethylchlorosilane (TMCS) (Thermo Scientific, Bellefonte, PA), and then heated for 1 h at 70 °C to generate trimethylsilyl (TMS) derivatives [31]. After 2 days, 0.5 to 1-mL aliquots were injected into an Agilent Technologies Inc. (Santa Clara, CA) 5975C inert XL gas chromatograph-mass spectrometer (GCMS), fitted with an Rtx-5MS with Integra-guard (5% diphenyl/95% dimethyl polysiloxane) 30 m x 250 µm x 0.25 µm film thickness capillary column. The standard quadrupole GC-MS was operated in the electron impact (70 eV) ionization mode; gas (helium) flow is set at 1.2 mL per minute with the injection port configured in the splitless mode. The injection port, MS Source, and MS Quad temperatures are set to 250 °C, 230 °C, and 150 °C, respectively. The initial oven temperature is held at 50 °C for 2 min and is programmed to increase at 20 °C per min to 325 °C and held for another 11 min, before cycling back to the initial conditions.
Adaptation of C. thermocellum to Populus hydrolysate
Adaption of C. thermocellum was performed by serial transfers using crimp-sealed 25 mL Balch tubes containing fresh anaerobic medium at 24-hour intervals with increasing concentration of Populus hydrolysate [32]. The tubes were sealed empty and purged with N2 and sterilized by autoclaving at 121 °C. The tubes were then injected with 9.5 mL MTC medium containing cellobiose and a known concentration of Populus hydrolysate. Each inoculation/transfer was 5% volume (0.5 mL). The optical density (OD600) was measured directly (without sampling) using a Spectronic 21D (Milton Roy, Ivyland, PA). The OD was referenced to an uninoculated sample of the Populus hydrolysate medium incubated with the samples. The OD was used to determine the increase in cell growth over time. A given concentration of Populus hydrolysate was maintained for each transfer until the OD reached that of the WT strain at 24 hours. When the benchmark OD was obtained at 24 hours, the culture was transferred to a higher Populus hydrolysate concentration. The final adaptation culture, after 117 transfers, is tolerant to 17.5% v/v Populus hydrolysate. Various viable culture samples were stabilized with 33% glycerol and stored at -80 °C during the course of the mutation process [3].
Isolation of single colonies
Agar (Fisher Scientific, Pittsburg, PA, USA) solution (15 g/L) was prepared with 5 g/L cellobiose MTC medium. The agar-containing bottles were then transferred into an anaerobic chamber (Coy Laboratory Products, Grass Lake, MI, USA) where the following manipulation occurred. The final adaption culture was plated with serial dilutions of (100 μL, 10 μL, 1 μL, and 0.1 μL) on quad- Petri plates (BD Biosciences, Bedford, MA, USA) and mixed with the agar solution. The plates were allowed to sit for 30 min to solidify the agar and then incubated at 55 °C. Colonies were picked using a needle after 32-48 hours incubation. Seven petri plates were filled with the agar solution and let dry in the anaerobic chamber for 2-3 days. A picked colony was streaked onto the pre-poured plates and incubated for an additional 32-48 hours. A picked colony was then transferred into a microcentrifuge tube with 1 mL sterilized DI water, which was mixed and injected into a crimp-sealed Balch tube with 9.5 mL of cellobiose MTC medium. The tube was incubated at 58 °C and 100 rpm. After about 24 hours, stock culture was prepared with 33% glycerol and stored at -80 °C [3]. These cultures were named isolates 1-7.
Genome resequencing and analysis
Genomic DNA for the WT strain, six intermediate mutant populations, and seven 17.5% v/v Populus hydrolysate tolerant mutant isolates were extracted using a Qiagen DNeasy kit (Qiagen, Valencia, CA). The DNA samples were shipped in dry ice to the DOE Joint Genome Institute (JGI, Walnut Creek, CA). The samples were sequenced using JGI’s whole-genome shotgun sequencing method, which began with the creation of DNA libraries [33]. Sequencing was performed from both sides of the library insert, producing paired ends, typically resulting in approximately 10X depth coverage for the single colony isolates and 50X depth coverage for the intermediate populations. Sequenced reads were aligned using MAQ [34]. A report with Single Nucleotide Polymorphisms (SNPs) and statistical analysis was returned (NCBI study accession number: SRP024303). Further analysis was conducted on the mutations using the Genome Resequencing Toolkit available from BESC Knowledgebase [35]. The “Function change predictor” tool available from the toolkit was used to evaluate potential changes in the protein function, namely a loss or a gain of a protein family (Pfam) domain. This tool calculates the Pfam score of the non-synonymous amino acid substitution within a Pfam domain. The Pfam score is calculated from the Position Specific Scoring Matrix (PSSM) scores of the Pfam model, taking into consideration the position of the substitution and the amino acid in the mutant and in the reference sequence. The resulting Pfam score of the mutation can be positive, which indicates a potential gain of function, or negative, which points to a potential loss of the protein function. Detailed documentation of these tools is available at http://cricket.ornl.gov/html/download/resequencing/ResequencingToolkitDocumentation_16Dec2011.pdf [35-37]. Multiple sequence alignment was conducted on the top 100 Blastp hits using Clustalw. Amino acids were termed ‘very conserved’ upon visual inspection showing 100% agreement or ‘non-conserved’ if there was no conservation at that position. Genes with unknown function or hypothetical proteins where analyzed with BLAST to identify homologus genes with known functions.
PCR DNA sequencing
Genomic sequencing data was validated using PCR amplification of genomic DNA. PCR primers were designed for 28 mutations. The mutations selected for validation included 19 ‘high confident’ mutations and 9 ‘false positive’ mutations found in PM Isolates. PCR primers were designed with approximately 150-200 bp on either side of the mutation. Both the genomic DNA of PM Isolates and WT was PCR amplified using a GeneAmp PCR System 9700 Thermal Cycler (Life Technologies, Grand Island, NY). The DNA samples were concentrated using Qiagen PCR clean-up kit (Qiagen, Valencia, CA) and eluted into H2O. The samples were sequenced at the Molecular Biology Resource Facility (MBRF) at the University of Tennessee (Knoxville, TN) using the Sanger sequencing method. After further clean-up, the samples were loaded into a 48 capillary array Applied Biosystems 3730 Genetic Analyzer using ABI’s POP7 polymer and run using the default long read modules. The data files generated were analyzed using Applied Biosystems Sequencing Analysis Software vs. 3.7. The genetic sequences were compared to the reference genome of C. thermocellum ATCC 27405 using BLAST to confirm 100% homology for the WT sequences and the presence or absence of the suspected mutation in the PM Isolate sequences.
Fermentation
Batch fermentations were conducted in triplicate in 1.5 L Q-plus jacketed glass fermentors (Sartorius Stedim Biotech, Bohemia, NY) using a 1 L working volume of MTC medium at 58 °C and 300 rpm, with pH controlled to 7.0 using 3N NaOH. Fermentors containing only 5 g/L cellobiose were sparged with filtered 20% CO2/80% N2 gas mixture and vigorously agitated overnight, followed by addition of the remaining medium components and Populus hydrolysate. Populus hydrolysate was added to the fermentors at 0%, 10%, or 17.5% v/v concentration. The fermentors were then sparged for an additional 4 hours with a 20% CO2/80% N2 gas mixture. The inoculum was grown overnight in 125 mL serum bottles (11-13 hrs) in 5 g/L cellobiose, diluted to an OD600 of 0.200 + 0.013, and added as 10% v/v to the fermentors. Isolate 6 was chosen as the Populus mutant (PM) strain. Well-mixed 5 mL aliquots of culture were harvested at regular intervals. Cell growth was monitored based on an increase in the optical density. The OD600 of the culture was measured in triplicate by a Spectramax Plus 384 (Molecular Devices, Sunnyvale, CA). Metabolite analysis was performed using HPLC as previously described. Statistical analysis of the difference in growth parameters was conducted using an Analysis of Covariance [38] and was considered significant if the p-value was less than 0.05.
RNA isolation
Fermentation samples for RNA isolations were harvested by centrifugation of a ~30 mL culture in 50 mL conical tubes at 8000 rpm and 4 °C for 10-15 min. The solid pellet fraction containing cells was flash frozen in liquid nitrogen and stored at -80 °C until further use. Total RNA was extracted from the cell pellets as follows. Briefly, the frozen cell solution was thawed on ice and an equal volume of TRIzol (Invitrogen, Carlsbad, CA) was added. The cell solution was divided into ~1 mL aliquots and added to 2 mL tubes containing 1 mL of 0.1 mm glass beads (Biospec Products, Bartesville, OK) ashed at 250 °C overnight. Cells were lysed by rapid agitation of the tubes at 6500 rpm for 1 min in three 20s-ON/20s-OFF cycles using the Precellys® bead beater (Bertin Technologies, France). Subsequently, the cell lysate (~0.8 mL) in TRIzol was phase separated by addition of 200 μL chloroform and the RNA was precipitated by addition of 500 μL isopropanol. The precipitated RNA pellet was washed with 1 mL of 75% ethanol and resuspended in 100 μL of RNase-free water. Any contaminating DNA was digested in-solution with a DNase-I (Qiagen, Valencia, CA) treatment and the RNA sample was purified using the RNeasy mini kit (Qiagen, Valencia, CA) as per the manufacturer’s instructions. Methods for fermentation experiments through RNA isolation techniques were adapted from Raman et. al (2011) [27].
RNA sequencing
The RNA samples were shipped in dry ice to DOE Joint Genome Institute (JGI, Walnut Creek, CA). JGI prepared an indexed, directional, amplified Illumina RNA_seq library for each sample using the RiboZero kit for rRNA removal [33]. Triplicate fermentation samples were pooled into a single channel and sequenced using 10 2x100 channels. The reads were mapped to the reference transcriptome. A report from JGI was returned with a correlation analysis between replicate samples and contained counts (raw and normalized to the gene length and total number of counts for the sample) for known gene models. Further analysis of the gene expression level was conducted using JMP Genomics 10. The raw count data was log-2 transformed and normalized by Upper Quartile Scaling [39]. An analysis of variance (ANOVA) test was conducted using a false discovery rate of 5% and the WT in 0% v/v Populus hydrolysate as the baseline. A gene was considered statistically significantly differentially expressed if the log-2 difference was greater than 1 and the -log10(p) was greater than 1.714. The differentially expressed genes were then clustered using hierarchal clustering.
Gas Analysis
Gas analysis was performed using triplicate sacrificial crimp-sealed 25 mL Balch tubes containing 5 mL of 5 g/L cellobiose- MTC medium with either 0% or 10% v/v Populus hydrolysate . WT and PM samples were grown using sacrificial techniques described above and collected at 3 hour intervals. The H2 and N2 gas analysis was performed using a Thermo Scientific Focus Gas Chromatography (GC) system (Asheville, NC) fitted with an HP Plot (molecular Sieve 5A) 30 m x 0.53 mm x 50 µm film thickness capillary column and helium as the carrier gas. Both the inlet and detector was held at 125 °C. The initial oven temperature is held at 30 °C for 4 min and is programmed to increase at 8 °C per min to 45 °C and held for 2 min, before cycling back to initial conditions. The CO2 and air analysis was performed using a Hewlett Packard Series II 5890 GC fitted with an HP Plot Q 15 m x 0.53 mm x 40 µm film thickness capillary column and helium as the carrier gas. The inlet and detector was held at 55 and 180 °C, respectively. The initial oven temperature is held at 50 °C for 1 min and is programmed to increase at 5 °C per min to 72 °C and held for 0.5 min, before cycling back to initial conditions. In both cases, 100 µL sample of gas was injected into the GC. H2 and CO2 concentrations were correlated using N2. Cell growth and metabolite analysis was performed using techniques previously described.
Results
Populus hydrolysate analysis
The Populus hydrolysate used in these experiments was analyzed by HPLC and GCMS. Table 1 shows the average concentration of metabolites found in four samples of the hydrolysate taken over the course of the experiments. Analysis of the effects of various feedstocks and pretreatment combinations on the formation and the accumulation of potentially inhibitory degradation products in biomass hydrolysate have been investigated [40]. Additional literature discusses inhibition by products formed during biomass pretreatment [4,5,40-43]. Many of the non-carbohydrate compounds are believed to be inhibitory in nature [42,44-47].
Table 1. Results of four Populus hydrolysate samples metabolite analysis by HPLC and GC-MS.
| Sugar | g/L | aliphatic acids | mg/L |
|---|---|---|---|
| Cellobiose | 3.7 + 0.2 | lactic acid | 157 + 25 |
| Glucose | 19.8 + 1.9 | maleic acid | 25.0 + 11.3 |
| Xylose | 38.9 + 2.5 | succinic acid | 82.2 + 6.4 |
| galactose | 2.7 + 0.3 | fumaric acid | 56.1 + 12.7 |
| Arabinose | 1.6 + 0.2 | levulinic acid | 1349 + 191 |
| Mannose | 5.7 + 0.4 | itaconic acid | 11.7 + 0.7 |
| aromatic acids | mg/L | adipic acid | 0.3 + 0.7 |
| 2-furoic acid | 41.8 + 4.2 | acetic acid | 11150 + 1881 |
| 3,4-dihydroxybenzoic acid | 43.9 + 9.2 | arabinonic acid | 49.9 + 6.0 |
| salicylic acid | 1.5 + 1.1 | xylonic acid | 772 + 202 |
| syringic acid | 84.9 + 29.1 | aldehydes and ketones | mg/L |
| 4-hydroxybenzoic acid | 9567 + 1223 | 5-hydroxymethylfurfural | 460 + 23 |
| benzoic acid | 44.1 + 3.6 | Furfural | 1198 + 165 |
| hydroquinone | 4.1 + 0.5 | 4-hydroxybenzaldehyde | 0.9 + 0.3 |
| catechol | 1.0 + 0.1 | syringaldehyde | 146 + 54 |
| glucuronic acid | 981 + 270 | vanillin | 143 + 39 |
| galacturonic acid | 7965 + 1769 |
The samples were taken over the time course of the experiments.
Mutant development
The mutant development process can be seen in Figure 1, with the mutant development steps listed in Figure 1A. In order to determine the inhibitory effect of the Populus hydrolysate, the wild type strain (WT) of C. thermocellum was cultured with low concentrations of Populus hydrolysate (0.05% to 10% v/v Populus hydrolysate) in Figure 1B. During these early selection experiments the medium was prepared with only 1/3 of the vitamin solution compared to later experiments which explains the decreased growth of the WT in Figure 1B. Late in the fermentation (approximately 200 hours) the culture with 5% v/v Populus hydrolysate started to grow (Figure 1B). When cultured in fresh medium containing 5% v/v Populus hydrolysate this culture grew as well as the WT strain in standard medium (without hydrolysate) and was denoted as the final 5% v/v Populus hydrolysate tolerant mutant strain of C. thermocellum. Selection of a resistant culture began using 10% v/v Populus hydrolysate. The growth rate of each serial dilution was tracked at 24 hour intervals for 96 hours and plotted as optical density (OD) versus time (Figure 1C). The WT when grown in standard medium reaches a maximum OD600 of 0.750 within 24 hours; therefore, an OD of 0.750 was selected as the benchmark for a resistant culture. The OD of the culture in 10% v/v Populus hydrolysate at 24 hours slowly increased with each serial dilution transfer until the OD reached the required benchmark (Figure 1C). The concentration of Populus hydrolysate was then increased by 5% v/v and the process repeated. The benchmark was not reached after 30 serial dilutions when the culture was grown in 20% v/v Populus hydrolysate. At that point, the concentration of hydrolysate was reduced to 17.5% v/v Populus hydrolysate. This subculture was able to reach the benchmark OD and was denoted as the final 17.5% v/v Populus hydrolysate culture. As described, culture samples were saved throughout the process. After a total of 117 transfers, the 5% v/v Populus hydrolysate tolerant population generated the final 17.5% v/v Populus hydrolysate tolerant mutants. Seven single colony isolates were obtained from the final 17.5% v/v Populus hydrolysate tolerant mutant population. Isolates 1 and 4 grew poorly compared to the other isolates (Figure S1). Isolate 6 grew most similarly to the population average; therefore, it was selected for further strain comparisons and denoted PM for “Populus Mutant” (Figure 1A). The PM has a similar growth rate on insoluble cellulose (Avicel) compared to the WT strain despite being selected with cellobiose as the only carbon source (Figure S2).
Figure 1. Flow chart for mutant development.

(A) The flow chart shows the mutant development process from the initial WT strain through the final mutant. Single colony isolate 6 was chosen as the final 17.5% v/v Populus hydrolysate tolerant mutant strain (PM). (B) Initial growth of WT culture on various concentrations of Populus hydrolysate to determine inhibitory effect. The culture in 5% v/v Populus hydrolysate started growing late in the fermentation. (C) An example of serial transfers showing increased growth over time in 10% v/v Populus hydrolysate. Illustrative curves show each daily serial transfer.
Genetic changes during the mutation process
To determine the genetic basis of the C. thermocellum Populus hydrolysate- tolerant phenotype, the genomes of the WT strain, six intermediate populations and the seven single colony isolates were resequenced by JGI using the whole-genome shotgun sequencing method. JGI reported 224 putative mutations across all 14 samples (File S1) [33]. There were 20 putative differences compared to the reference genome in all of the sample sequences including the WT which were removed from consideration. The remaining 204 putative differences were screened for ‘high-confidence differences’ by removing mutations listed as false positive (fp), Illumina Sequence-specific error leading to a false positive (ISE), and structural variants (SV), resulting in 73 high confidence differences.
In order to verify the JGI high throughput sequencing results, 19 of the high confidence mutations and 9 of the false positive mutations found in the PM Isolates were selected for verification by Sanger sequencing of PCR products (Table S1). Primers were designed to yield PCR products containing approximately 200 bp on either side of the mutation in question. PCR products were also generated for the WT as a negative control. The 19 high confidence mutations were selected randomly from PM Isolate 6. In each case the mutations identified by high throughput sequencing were identified in the PM sequences and the WT sequences resulted in 100% homology to the reference genome. Of the 131 false positive mutations identified by JGI, 62 were related to the presence of multiple long sequences of similar content in the C. thermocellum reference genome. Of the 69 potential false positive mutations that could be uniquely associated with a single sequence in the C. thermocellum reference genome via BLAST, only 11 appeared in PM isolates. PCR products were successfully obtained for 9 of these 11 potential mutations and in each case, both the WT and the PM sequences resulted in 100% homology to the reference genome, thereby confirming that no mutation occurred. Collectively these results suggest that the high throughput sequencing yields results that are reliable and that the false positive mutations identified by JGI can be safely ignored.
A longitudinal analysis was conducted on the six intermediate populations to determine when in the evolutionary process the mutations occurred. The number of mutations increased at a rate of 5+3 mutations between samples (Figure S3). The greatest increase in the number of mutations, 9 differences, occurred between the final 15% v/v Populus hydrolysate tolerant population and the final 17.5% v/v Populus hydrolysate tolerant population samples. The second highest increase in differences, 8 differences, occurred between the WT and the final 5% v/v Populus hydrolysate tolerant population samples. Although, there was no difference in the total number of mutations between the final 10% v/v Populus hydrolysate tolerant population and the intermediate 15% v/v Populus hydrolysate tolerant population sample, the actual mutations in these two populations were different from one another.
A pan genomic analysis (Figure S4) was conducted on the seven single colony isolates to determine the distribution of differences among the isolates. Each of the isolates contained an average of 27+2 differences. Of the 73 differences, 33% of the differences were found in the population samples but not in the isolate samples and were considered discarded mutations. Of the remaining differences, 32% were unique to one of the isolates, 5% were shared by multiple isolates, and 30% belonged to the core genome which is common to all of the isolates (designated as core mutations). Figure 2 lists the core mutations plus their annotated function, and when they occurred in the evolutionary process.
Figure 2. Core mutations common to all 7 single colony isolates.

*Blast search of the uncharacterized protein returned yyaL as a homologus protein. Type of mutations: Syn: synonymous SNP, Non-Syn: Non-Synonymous SNP, NC: non-coding region, STOP: stop codon inserted, INDEL: insertion or deletion.
Table S2 lists the unique and shared mutations for the seven single colony isolates. There are a total of 27 unique and shared mutations among the isolates. Only four of these mutations were detected in the final 17.5% v/v Populus hydrolysate tolerant mutant population sample at a concentration of < 2% of the population. None of the mutations were detected in earlier population samples. These mutations may explain some of the variability seen in the growth of the different single colony isolates (Figure S1). The two poor growing isolates have three mutations shared only by those two isolates: a synonymous SNP in a ribosomal protein (Cthe_0992), a non-synonymous SNP in an integrase family protein (Cthe_1127), and an insertion of 7bp near the 3’ end of an AbrB family transcriptional regulator (Cthe_2655). The two isolates only differ in two mutations. Isolate 1 has an INDEL in an acetate kinase (Cthe_1028) and Isolate 4 has a non-synonymous SNP in extracellular solute-binding protein (Cthe_1020). However, only the six unique and shared mutations contained in Isolate 6 will be considered further since the fermentation and RNA-seq experiments used this isolate.
There was a nonrandom distribution of mutations with only 11% of mutations occurring in the non-coding region. The number of insertions or deletions (INDELs), synonymous single nucleotide polymorphous (SNPs), non-synonymous SNPs and STOP codons in the coding parts of the genome is presented in Figure S5. SNPs are the dominant type of mutation that occurred, and non-synonymous substitutions were approximately four times as abundant as synonymous. JGI did not report any transposon-mediated mutations.
Further analysis of the distribution of mutations revealed an increase number of mutations at several locations termed hotpots. In order to be considered a hotspot, multiple mutations had to be located within a gene, in an operon, or along the same pathway and at least one of the genes had to be located in the core mutation genome (Figure 2). A manual analysis of the distribution of the mutations identified 8 putative hot spots (Table 2). Genes linked to the hot spots included 24 out of the 73 putative mutations and 14 of the 22 core mutations.
Table 2. Mutational Hot spots identified in the sequenced genome.
| Hot Spot ID | Number of Mutations | Genes (# mutations, location) | Products |
|---|---|---|---|
| 1 | 5 | Cthe_0948 (1, CDS), Cthe_0949 (1, CDS), Cthe_1766 (1, CDS), Cthe_1866 (1, CDS), Cthe_2529 (1, CDS) | Production of various amino acids |
| 2 | 5 | Cthe_2602 (2, NC)*, Cthe_2603 (2, CDS), Cthe_2607 (1, CDS) | Single transcription unit Cthe_2602-9: Subunits for F-type H+-transporting ATPase |
| 3 | 4 | Cthe_0422 (one NC and 1 CDS) *, Cthe_1028 (1 CDS), Cthe_1029 (1 CDS) | Redox-sensing transcriptional repressor Rex and acetate formation from acetyl-CoA I |
| 4 | 2 | Cthe_1569 (1 CDS), Cthe_1842 (1 CDS) | Homocysteine biosynthesis |
| 5 | 2 | Cthe_1202 (one NC and 1 CDS) | Major facilitotor superfamily, MFS_1 |
| 6 | 2 | Cthe_1020 (2 CDS) * | Extracellular solute-binding protein family 1, PBP2_LTTR_substrate superfamily |
| 7 | 2 | Cthe_3087 (2 CDS) * | Sporulation transcriptional activator Spo0A |
| 8 | 2 | Cthe_1256 (1 CDS), Cthe_2119 (1 CDS) | glycoside hydrolases |
CDS, coding region, NC, non-coding region, bold genes belong to the core mutational genome, *only one of the mutations are in the core mutational genome
Genes and mutations with unknown function
There are four mutations in the core genome with unknown function. Two of the mutations are INDELS located in non-coding regions and are located at positions 2179038 and 3151358. The two other mutations are in Cthe_0291 an uncharacterized protein, and Cthe_0531 a hypothetical protein. In an attempt to determine functionality of these genes a BLAST similarity search was run between the unknown genes and genes from public databases. The BLAST search for Cthe_0531 returned only genes with hypothetical protein annotations. However, the BLAST search for Cthe_0291 returned a number of genes annotated as the thioredoxin, yyaL, protein.
Fermentative Growth
Batch fermentations were conducted in triplicate in Q-plus fermentors to further evaluate the performance of the PM versus WT C. thermocellum strains in different levels of hydrolysate. The PM was grown in three test conditions: standard medium (0% v/v Populus hydrolysate), 10% v/v and 17.5% v/v Populus hydrolysate. The WT was grown in two test conditions: standard medium and 10% v/v Populus hydrolysate. The WT grown in the presence of 17.5% v/v Populus hydrolysate severely inhibited growth in an unpredictable manner (data not shown). Samples were taken at regular intervals from each fermentation unit based on their growth rate. Samples were analyzed for OD and metabolite concentration by HPLC. Figure 3 shows the average OD over the entire fermentation (Figure 3A) and the average OD on a log scale for the initial stages to emphasize the initiation of exponential growth (Figure 3B). The lag period lasted approximately 4 hours for the standard medium conditions and 6 hours for the hydrolysate medium condition for both the PM and WT strains. Figure 3 also shows the net growth rate (ln(biomass/time, μnet) (Figure 3C), ethanol yield (Figure 3D) and acetic acid yield (Figure 3E) for each of the test conditions over the exponential growth phase. Table S3 contains p-values indicating statistically significant differences in pair-wise comparisons of growth rates and product yields among the various strains and growth conditions. The net growth rate is calculated from the end of the lag phase until the time of maximum cell density. Less than 15% of the initial glucan concentration and less than 5% initial cellobiose remained at the end of the fermentations conducted in 0% and 10% v/v Populus hydrolysate. Approximately 19% and 8% of the initial glucan and cellobiose remained at the end of the PM fermentation with 17.5% v/v Populus hydrolysate. End products yields are calculated as a function of the amount of glucan utilized from the fermentation broth since the hydrolysate contained additional cellobiose and glucose. In brief, the PM had an increased growth rate when compared to the WT in the same condition. The PM was characterized by similar growth rates in 0% and 10% v/v Populus hydrolysate media, but the growth rate decreased in 17.5% v/v Populus hydrolysate medium. The growth rate of the WT decreased in 10% v/v Populus hydrolysate medium in comparison to 0% v/v Populus hydrolysate medium. The PM was characterized by a greater ethanol yield compared to the WT under the same test conditions. Ethanol yields also increased for both strains in the presence of Populus hydrolysate. Acetic acid yield were similar for both strains when grown under the same growth conditions. Acetic acid yield increased in the PM strain in the presence of hydrolysate, but remained constant for the WT strain. The p-value of the regression analysis can be seen in Table S3.
Figure 3. Growth comparison for WT and PM in various concentrations of Populus hydrolysate.
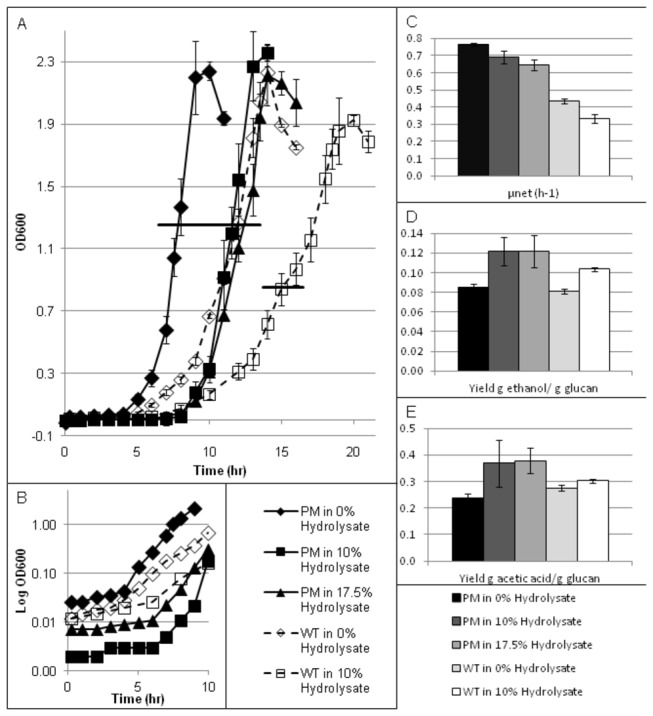
(A) Optical density versus time. The horizontal bars indicate sample point for RNA-seq analysis, (B) the average OD on a log scale for the initial stages to emphasize the initiation of exponential growth, (C) net growth rate (ln(biomass/time, μnet), (D) yield of ethanol produced (g/L)/glucan utilized (g/L), and (E) Yield of acetic acid produced (g/L)/ glucan utilized (g/L).
RNA-seq Analysis
The samples for RNA analysis were harvested from the fermentors during the mid-log phase based on OD (see Figure 3A). Resulting RNA-seq data was used to elucidate the role of the genomic changes that helped confer the hydrolysate tolerant phenotype. Gene expression data were analyzed for genes that: (1) were mutated, (2) were located downstream or in an operon with a mutated gene, (3) were another copy of a mutated gene, or (4) were under regulatory control of a mutated gene. An ANOVA analysis was conducted on the resulting subset of 41 genes using a false discovery rate of 5% and the expression of the WT in 0% v/v Populus hydrolysate as the baseline. Of the 41 genes 25 of them were differentially expressed in at least one of the comparisons. The 25 differentially expressed genes were clustered using hierarchal clustering as shown in Figure 4. The differential expression profiles for the subset of 41 genes can be found in File S2.
Figure 4. Hierarchical clustering of differentially expressed genes.
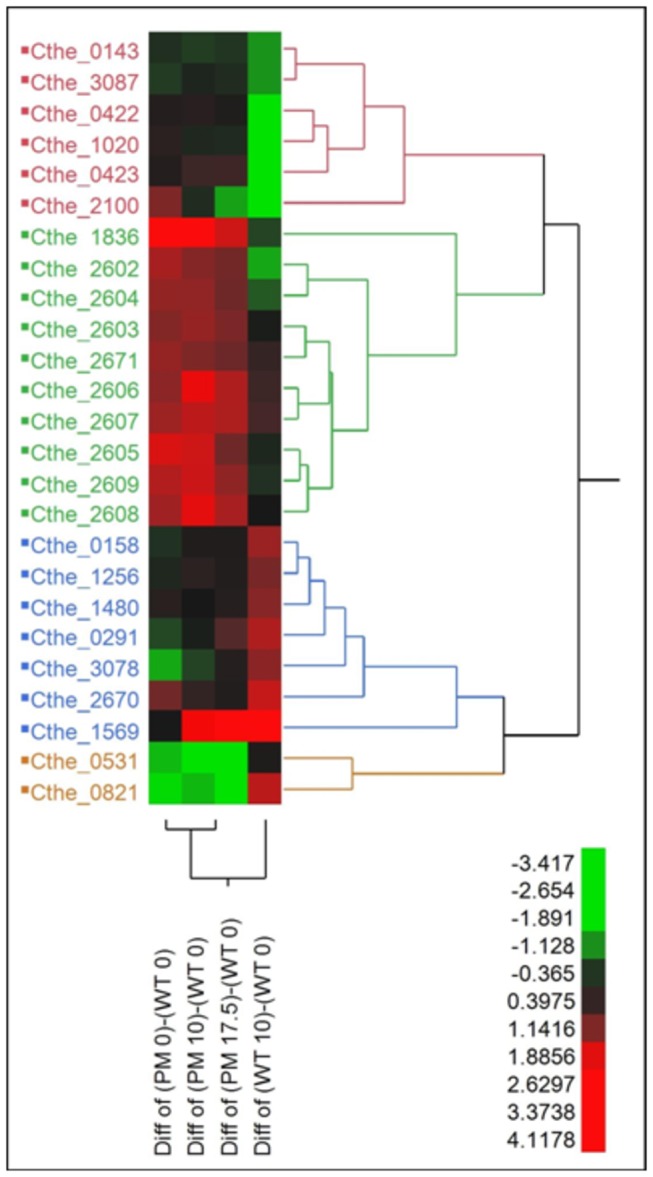
The scale represents the log-2 transformed difference between the two conditions; therefore a change greater than one represents a >2-fold change in gene expression.
Gas Analysis
Sacrificial fermentations were conducted in triplicate in 25 mL Balch tubes to evaluate the CO2 and H2 production of the PM versus WT C. thermocellum strains in 0% and 10% v/v Populus hydrolysate. Samples were taken at 3 hour intervals and analyzed for OD, metabolite concentration by HPLC, and gas concentration by GC. The growth rates in the Balch tubes were shown to be statistically equivalent to the growth rates in the Q-plus fermenters (Table S3) facilitating comparisons across the two reactor types. The production of CO2 or H2 versus glucan utilization for the WT and PM can be seen in Figure S6 part A and D respectively. Table S3 indicated that both strains had similar H2 production rates under the same experimental conditions. Statistical analysis shows that the PM produces slightly more CO2 than the WT in 0% v/v Populus hydrolysate medium, but similar amounts in 10% v/v Populus hydrolysate medium.
Discussion
Further analysis was conducted on the core mutations (Figure 2) with insight from the hot spot analysis (Table 2). The mutations were broken down into three basic categories: mutations beneficial to the tolerant phenotype, extraneous or detrimental mutations, and mutations of unknown function.
Mutations beneficial to the tolerant phenotype
Inhibitory compounds may affect the cell by damaging and denaturing biological molecules resulting in adverse outcomes including the improper folding of proteins, DNA damage, improper RNA unfolding and degradation, and the impairment of biophysical changes to cell membranes necessary for energy generation and the proper functioning of molecular pumps [6,48]. Figure 5 provides an overall schematic of the mechanisms of tolerance for the PM. The tolerant phenotype is the result of several simultaneous mechanisms of action, including increases in cellular repair, and altered energy metabolism. These and related mechanisms are apparently independent from each other and can involve genes or gene clusters widely dispersed on the chromosome [6]. The ‘tolerant’ phenotype can be broken down into two distinct changes in PM compared to the WT. The first is the PM’s enhanced growth phenotype which can be seen by the comparison of the growth rate of the two strains in 0% v/v Populus hydrolysate. The second is the PM’s enhanced tolerance to hydrolysis components which can be seen by the difference in the response to hydrolysate of the two strains (Figure 3A).
Figure 5. Mechanisms of tolerance.
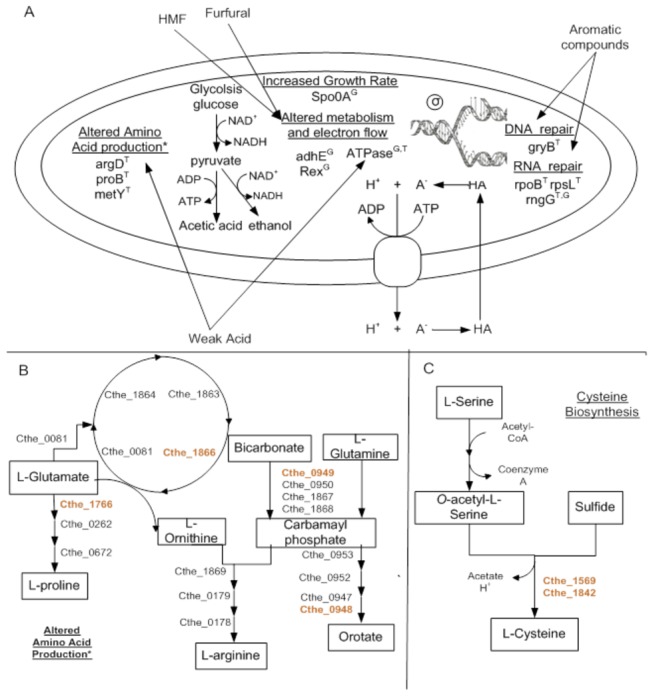
(A) Graphical representation for the mechanism of tolerance in PM. The superscript T means that the mutation is most likely is involved with enhanced tolerance by the mutatnt strain and the superscript G means that the mutation is most likely involve with enhanced growth rate of the mutatn strain (B) In depth look at the alter amino acid production (C) and in homocysteine biosynthesis (Taken in part from [55,56]).
DNA repair and mRNA and protein turnover
Cells contain multiple lines of defense against protein aggregation, DNA and RNA damage, and membrane and organelle damage [6]. The PM has one mutation affecting a gene encoding for a protein related to DNA repair (Cthe_2376) and three mutations affecting genes related to transcription (Cthe_2724), translation (Cthe_2727) and RNA degradation (Cthe_0158). The mutations in Cthe_2376, Cthe_2724 and Cthe_2727 are all non-synonymous SNPS and Cthe_0158 has a deletion near the 3’ end.
The gyrB gene (Cthe_2376) encodes an ATP-dependent DNA gyrase enzyme which cleaves and reseals double stranded DNA thereby introducing negative supercoils into DNA [49]. This activity is essential for DNA replication, transcription and recombination [49]. The non-synonymous SNP mutation in gyrB (R26S) occurs in a very conserved amino acid based on the Clustlw alignment (File S3). C. thermocellum contains a second copy of the gyrB gene (Cthe_0305) which is expressed at approximately one tenth of the level of Cthe_2376 in the WT under standard conditions. Neither copy of the gyrB gene is differentially expressed across the different conditions (data not shown). It is likely that Cthe_2376 is the dominant copy of the gyrB gene in C. thermocellum. Although, the potential change in specificity, selectivity or stability resulting from this mutation is unknown, the mutation may be beneficial for hydrolysate tolerance by reducing DNA replication errors.
The rpoB gene (Cthe_2724) encodes for the β-subunit of RNA polymerase. The RNA polymerase controls the flow of information from genotype to phenotype and is composed of an essential catalytic core enzyme and one of several alternative sigma (σ) factors [50]. C. thermocellum contains a single copy of the rpoB gene and the PM strain has a non-synonymous SNP mutation (E885K) in a strongly conserved amino acid based on the Clustalw alignment (File S4). This mutation potentially changes the specificity, activity and/or stability of the RNA polymerase. Since, the RNA polymerase contacts every promoter in the genome; a single amino acid substitution in the critical portions of the enzyme may lead to global changes in gene expression and cellular function [50]. By comparison, Alper et al. (2007) randomly mutated rpoD, which encodes the main sigma factor in Escherichia coli [51]. Mutations to the sigma factor were able to elicit changes in phenotype which confer tolerance to ethanol, metabolite overproduction, and multiple, simultaneous phenotypes [51]. The rpsL gene (Cthe_2727) produces the ribosomal protein S12 [52] which is part of the 30S ribosomal subunit. Alterations in rpsL are known to confer resistance to the error-inducing antibiotic streptomycin [53]. The rpsL mutation (A14V) occurs in a poorly conserved location based on the Clustalw alignment (File S5). Together, mutations in the subunits of RNA polymerase and ribosomes have significant potential to change the overall protein expression profile in the cell. However, these mutations do not significantly change the gene expression level of the rpoB and rpsL genes in any of the test conditions (data not shown). In addition, mutations in both rpoB and rpsL have been shown to impart increased tolerance to solvents and aromatic compounds, such as 4-hydroxybenzoate, by blocking their uptake through the membrane transport system [52]. Therefore, it is possible that these mutations contribute to the enhanced hydrolysate tolerance of the PM.
RNase G (Cthe_0158) endoribonuclease is required for the normal decay of several transcripts including mRNA from two genes in the glycolysis pathway, enolase (eno) and acetaldehyde dehydrogenase (adhE) [54]. When the rng protein is disrupted, the eno and adhE proteins are known to be over produced as a consequence of mRNA stabilization and the resulting increase of their half-lives [54]. Although the mutation does not occur in a known domain, it is possible that the deletion of codons 438 through 486 of 498 may disrupt the functionality of the rng protein and decrease the rate of RNA degradation in the PM. A reduction in mRNA degradation can either increase the activity of mRNA or maintain mRNA activity with reduced transcriptional effort. The rng gene is significantly upregulated in the WT in the presence of hydrolysate (Figure 4) which would result in more rapid mRNA turnover. Upregulation of rng does not occur in PM, which, when combined with the potential disruption of rng functionality would result in significant reduction of mRNA turnover. Consistent with the differences in rng activity, the activity of adhE (Cthe_0423) and eno (Cthe_0143) transcripts is decreased in the WT in hydrolysate medium whereas the PM maintains constant activity (See Figure 4). Since DNA is particularly sensitive to damage during transcription, reduced mRNA turnover rates would also lead to reduced DNA damage by the hydrolysate, and could conserve energy and increase metabolic efficiency in stable environments that do not require frequent changes in gene expression profile. Furthermore, constant expression of the eno and adhE genes in the PM may allow the organism to maintain flux through the acetyl CoA to ethanol pathway. Since this pathway is a key mechanism by which NAD+ is recycled, maintenance of adhE activity may contribute to greater flux through the glycolysis pathway. Together, the benefits of reduced mRNA turnover may play a significant role in the increased tolerance and faster growth of the PM.
Altered Energy Metabolism
The faster growth rate of the PM and increased product yields suggest that mutations in the PM result in an altered metabolism. Furfural and HMF are reduced to their corresponding alcohols through NAD(P)H dependent reactions, thereby reducing the need to recover NAD+ through ethanol formation [48,55]. In the WT, the Cthe_0422-3 operon, which encodes for the Rex (redox) repressor and adhE, is down regulated in the presence of hydrolysate (Figure 4). Surprisingly, WT ethanol yields increases in hydrolysate medium despite down regulation of adhE. In Clostridium acetobutylicum, Rex regulates the expression of solventogentic genes, including adhE2, in response to the NAD+/NADH ratio. The PM had a mutation in the non-coding region upstream of the Cthe_0422-3 operon which seems to maintain its expression level in hydrolysate medium (Figure 4). While it is unclear whether adhE activity in the WT is down regulated by Rex or by another mechanism, such as the activity of RNase G discussed above, the end result is that the PM maintains greater activity of adhE in the presence of hydrolysate, contributing both to greater ethanol yields and availability of NAD+ for upstream glycolytic reaction steps. As to be expected with the increased expression of adhE compared to the WT, the PM has a greater ethanol to acetic acid ratio (0.43:1) when compared to the WT strain (0.35:1) (p-value = 1.46E-05) in standard medium. This mutation might both enhance the growth of the PM in standard medium and impart greater tolerance to the hydrolysate media.
The PM has a mutation in the non-coding region 127 bp upstream of the first gene in the operon (Cthe_2602-09) coding for the ATPase complex. The PM has significantly increased expression levels for the entire ATPase operon compared to the WT in all conditions tested (Figure 4). Of the single colony isolates, Isolates 1-6 also have a mutation in Cthe_2603 (I4M) which encodes for the C subunit of the ATP synthase (Table S1); however, the effect of this mutation is unknown at this time.
The ATPase obtains energy from the transmembrane transport of ions (H+/Na+) along the electrochemical gradient to generate ATP from the substrates adenosine diphosphate (ADP) and inorganic phosphate (Pi). An increase in the activity of ATPase complex can provide additional energy for biosynthetic processes. It has been proposed that ATPase might also work in conjunction with the membrane bound Ferredoxin-dependent Ech-type NiFe-hydrogenase (Cthe3013-3024) for the production of molecular hydrogen to dispose of excess reducing equivalents generated during carbohydrate catabolism and to create the necessary H+/Na+ gradients to power ATP synthesis [27]. However, the statistically similar rates of H2 production per glucan utilization of the WT and PM in both 0 and 10% v/v Populus hydrolysate media does not support this argument (Figure S6A and S6C). Alternatively, ATPase may operate against the H+ gradient at the expense of ATP [6]. In this case ATPase may act to increase the intercellular pH thereby providing a tolerance mechanism for undissociated forms of weak acids in the hydrolysate. Given the conflicting evidence, it is not possible at this time to ascertain the role of the up regulation of ATPase with certainty.
Cells respond to the effect of inhibitory compounds by alterations in the biosynthetic programs to produce metabolites, such as amino acids, that counter toxic effects [6]. The PM contained several mutations involved in amino acid production which are similar to those seen by an ethanol tolerant mutant under similar conditions [3] and may enhance the tolerance of the PM to hydrolysate as well. The PM has two mutations involved with glutamate catabolism. A mutation to a gene in the arginine pathway, argD (Cthe_1866 E55G) resulted in a pfam score of +1180. This common mutation has been previously observed in the C. thermocellum DSM 1313 strain [3]. Another mutation to a gene in the proline pathway, proB (Cthe_1766 A149T) resulted in a pfam score of -18 which suggests similar functionality. This mutation is found in Clostridium phytofermentans. These two mutations could suggest a shift from proline production to arginine production in PM which seems to be a beneficial mutation that commonly occurs (see Figure 5B). An increase in amino acid production can also help overcome weak acid stress. The decarboxylation and antiport of the amino acids glutamate and arginine generates a net efflux of intracellular protons thus increasing intracellular pH [6,56] thereby suggesting a possible mechanism by which proton gradients for ATP synthesis may be maintained.
There are two copies (Cthe_1569 and Cthe_1842) of the metY gene in C. thermocellum, which produces L-cysteine, both of which have mutations in the PM that seem to inactivate the proteins (Figure 5C). Cthe_1569 has a stop sequence inserted at codon 229 and the non-synonymous SNP in a highly conserved region of Cthe_1842 (P29Q) results in a pfam score of -1198. These two mutations essentially cut off the conversion of serine and hydrogen sulfide to L-cysteine. Miller et al. (2009) showed that supplementing fermentation media with cysteine improved furfural resistance the greatest out of the five amino acids tested [57]. Since MTC media contains L-cysteine the benefits of forgoing its synthesis may have provided selective pressure favorable to these mutations [57].
The spo0A transcription factor is responsible for the initiation of sporulation [58,59]. Spo0A has been shown to repress transcription of the transcriptional pleiotropic regulator of transition state genes (abrB) and to activate operons encoding stage II sporulation genes [58,60]. The abrB product acts to minimize the expression of extraneous genes that interfere with the maximal rate of growth of the cell under nutrient-excess conditions [59]. Spo0A mutants are unable to go into sporulation and are thought to be locked in exponential growth since they continue to grow under nutritional conditions that would normally induce sporulation. Essentially they appear to maintain growth until the nutrients are exhausted, whereupon cell lysis occurs [59]. This behavior is consistent with the PM growth kinetics and other spo0A defective mutants [60-62]. There are two copies of spo0A in C. thermocellum, Cthe_0812 and a distantly related homologue Cthe_3087. The PM has a stop codon placed early in the coding region of Cthe_3087 which should disrupt the protein function. As would be expected, the gene expression of Cthe_3087 is not significantly different for the PM in any test condition. Cthe_0812 is significantly downregulated by an unknown mechanism for the PM under all test conditions (Figure 4). The disrupted expression of both spo0A proteins in the PM results in increased expression of abrB (Cthe_2100) in standard medium (Figure 4). The expression of abrB is down regulated in the presence of hydrolysate in both the WT and PM strains, consistent with the decrease in growth of the WT in 10% v/v Populus hydrolysate medium and the PM in 17.5% v/v Populus hydrolysate medium.
Genes and mutations with unknown function
Of the three mutations in non-coding regions of genes with unknown function, the first mutation (located at position 2179038) is an insertion of a string of nine adenine nucleotides 388 bp upstream of Cthe_1836, a hypothetical protein that results in an increase in its expression in the PM compared to the WT. The second mutation (located at position 3151358) is an INDEL of unknown size and 245 bp downstream of the 3’ end of Cthe_2670, a hypothetical protein and 221 bp upstream of the 3’ end of Cthe_2671, mutator type transposase. This mutation seems to be related to an increase in expression of both genes in the PM in the presence of hydrolysate. The third mutation (located at position 2732545) is unique to PM Isolate 6 and is a deletion of 67 bp in an intergenic region (Table S1) more than 3000 bp from the closest gene. Three additional mutations occurred in the coding regions of genes of unknown function. Cthe_0531 was mutated at the C30Y position; however, a BLAST search returned no similar genes with known function. The BLAST search of Cthe_0291, a synonymous SNP at codon 19, returned a number of genes annotated as the thioredoxin, yyaL, gene which are responsible for maintaining a cellular reducing environment and fulfill an important role in DNA synthesis and protein repair [63]. Even if Cthe_0291 is a thioredoxin homologue, the synonymous nature of the SNP decreases the likelihood that this mutation contributes to the tolerant phenotype. The third mutation is unique to Isolate 6 and is an INDEL in the hypothetical protein Cthe_1480. The BLAST search returned a number of genes annotated as RND family transporter and mmpL domain-containing proteins. The pfam score of -492 suggest that this mutation is a loss of function. Although there are differences in the gene expression levels for these genes (Figure 4), the potential impacts of these mutations are unknown at this time.
Extraneous or detrimental mutations
The PM has three mutations affecting genes associated with the cellulosome. These mutation may result in the conservation of cell resources when grown on soluble hydrolysate, but could be detrimental to cell growth on solid biomass. Cthe_2119 (RsgI6), is involved in regulating the expression of cellulosomal genes in the presence of xylans and cellulose [20,23,64], contains a synonymous SNP in codon 415. Since the mutation is outside of the catalytic domain and does not result in a change in expression, it is unlikely to cause a significant change in phenotype. A mutation (E458K) in bglX (Cthe_1256) results in a pfam score of -539 suggesting a possible loss of function. The gene encodes for a GH3 family beta-D-glucoside glucohydrolase which breaks the β-1,4 glucosidic bonds of cellobiose to produce glucose monomers [65]. Hydrolysate seemed to induce expression of this gene in the WT, but had no effect on the PM. Therefore, the mutation seems to negatively affect both the functionality and the expression level of the GH3 protein PM Isolate 6 also has a unique mutation in cellulosome anchoring protein Cthe_3078. The mutation is a synonymous SNP in codon 1013, which is outside of a known domain. In the WT the expression of this gene increases in the presence of hydrolysate. The expression in the PM is repressed in 0% v/v Populus hydrolysate and is insensitive to hydrolysate concentration.
The PM also had mutations related to the ATP-binding cassette (ABC) and Major Facilitator Superfamily 1 (MFS_1) sugar transporter systems. The Cthe_1018-1020 ABC transport system has been suggested to play a major role in cellodextrin assimilation [10]. A mutation (A99V) in the extracellular binding protein of the complex, Cthe_1020 (cbpB) is associated with a pfam score of -277. Although, the role of this mutation is not clear, the negative pfam suggests that it might be detrimental to the function of the protein. Solutes transported by the MFS_1 family include galactose, arabinose, xylose, and glucose in bacteria [66]. The PM has two mutations in the MFS_1 gene (Cthe_1202); one is in the non-coding region 82 bp upstream of the 5’ end and the other is R343G. There is no significant change in gene expression between the WT and PM (data not shown) so it is unlikely that the mutation in the non-coding region affects gene expression; however, the mutation in the coding region may change the selectivity or specificity of this protein. Since the PM was evolved only on soluble cellobiose, it is possible that these mutations are a result of an attempt to conserve energy and may be detrimental to the cell when grown on more complex substrates.
The PM also has two mutations along the pyrimidine pathway (Cthe_0947-0953). The gene carB (Cthe_0949 P361H) encodes for a subunit of the carbamoyl-P synthase enzyme which catalyzes its synthesis from ammonia and ATP [2]. The other mutation in pyrDII (Cthe_0948 D173H) is located on the pathway from carbamoyl-P to orotate. These two mutations do not result in a significant change in the pfam score or gene expression (data not shown); therefore, these mutations are unlikely to contribute significantly to the tolerant phenotype (see Figure 5B).
PM Isolate 6 also has two extraneous unique mutations. The first mutation (K559R) occurs in a gene that encodes a multi-sensor signal transduction histidine kinase (Cthe_1393). The pfam score of 55 suggest that this mutation does not greatly affect the functionality of the protein. There is also no significant change in expression of this gene. The other mutation is in the urea ABC transporter ATP-binding protein urtE (Cthe_1819). The mutation (N99I) is outside of a known domain and does not result in a significant change in gene expression.
Future work includes a global analysis of gene expression and kinetic modeling of growth for the PM and WT strains to further understanding the mechanisms of Populus hydrolysate tolerance. Additional analysis of these mutations could be pursued using system biology methods, genetic tools, biochemical assays and strain engineering.
Conclusion
This study is the first investigation of the mechanism of tolerance for C. thermocellum to inhibition by a complex hydrolysate generated during pretreatment, in this case using Populus hydrolysate. Genome sequencing used in the study proved to be a useful tool to reveal cellular evolution to stress such as that provided by the composition of Populus hydrolysate. Analysis of the mutations included a longitudinal analysis, a pan genomic analysis, and a hotspot analysis. Additional systems biology tools including pfam scores and RNA_seq analysis led to the identification of the multiple mutations most likely to confer tolerance to the Populus hydrolysate based of change in function and gene expression. These mutations are located in several simultaneous mechanisms of action, including increases in cellular repair, and altered energy metabolism. This study may provide the building blocks for the construction of an industrially robust organism for economical ethanol production.
Supporting Information
Growth comparison of WT and 7 different single colony isolates in standard MTC media and 17.5% v/v Populus Hydrolysate. The OD was referenced to an uninoculated sample of medium incubated with the samples. The PM and WT have the ability to degrade two of the compounds in the Populus hydrolysate which lightens the color and leads to the negative OD.
(TIF)
PM and WT growth comparison on insoluable substrate (Avicel) as a function of pellete and supernatant nitrogen concentration taken over time.
(TIF)
Longitudinal Genomic Analysis in which six populations samples along the evolutionary process were sequenced to determine when the mutations occurred. (A) Daily transfers over the entire evolutionary process in various hydrolysate concentrations. The arrows indicate where in the process the different population samples were taken for sequencing. Samples were considered either final mutations if taken at the end of a given concentrations evolutionary process or intermediate mutants if taken during the middle of the processes. (B) The total number of mutations that occurred for each population by catergory of the pan genomic analysis.
(TIF)
Pan Genomic Analysis of the seven single colony isolates from the final 17.5% v/v Populus hydrolysate-tolerant mutant strain. The core mutations are most likely responsible for the increased robustness since they are shared by all isolates.
(TIF)
Distribution analysis of mutations data. Syn: synonymous SNP, Non-Syn: Non-Synonymous SNP, INDEL: insertion or deletion, and STOP: stop codon inserted.
(TIF)
In Comparison of the g/L Dry Cell Weight (DCW) versus g/L H2 production in A) 0% v/v Populus hydrolysate and B) 10% v/v Populus hydrolysate. Compaison of the g/L DCW versus g/L CO2 production in C) 0% v/v Populus hysrolysate and D) 10% v/v Populus hydrolysate. The comparisons are for the PM and WT strains for the exponential growth phase using a sacraficial test tube experiment. Trendlines were added to show the rate of production.
(TIF)
Clostridium thermocellum genomic analysis : An excel File containing the full list of possible mutations received from JGI.
(XLSX)
Differential Gene Expression Profiles : An excel file containing the significantly differentially expressed genes based of the ANOVA results.
(XLSX)
Cthe_2376-alignment: A text containing the Clustawl alignment of the SNP in Cthe_2376 with the top 100 hits.
(TXT)
Cthe_2724-alignment: A text containing the Clustawl alignment of the SNP in Cthe_2724 with the top 100 hits.
(TXT)
Cthe_2727-alignment: A text containing the Clustawl alignment of the SNP in Cthe_2727 with the top 100 hits.
(TXT)
Selected mutations for verification of mutations in the WT and PM Isolate 6. The putative mutations included for PCR verification 19 high confidence mutations and 9 false postive mutations. The table lists the gene name, position of the mutation, type of mutations as determined by JGI (Syn: synonymous SNP, Non-Syn: Non-Synonymous SNP, NC: non-coding region, STOP: stop codon inserted, INDEL: insertion or deletion, FP- false positive, ISE – instrument specific error or ???- unknown), the identity of the base in question determined in the PCR products of the WT and PM strains (WT:PM), and the final determination of whether a real mutation or a false positive mutation occurred. Both the forward and reverse strands were sequenced for each mutation listed.
(PDF)
Shared and uniquie mutations in the seven single colony isolates. ‘X’ marks which isolate contained the mutation. * Indicates that the mutation was detected in the final 17.5% v/v Populus hydrolysate tolerant mutant populuation sample at less than 2%. The rest of the mutations were not detected in the population sample. None of the mutations were detected in earlier population samples. Type of mutations: Syn: synonymous SNP, Non-Syn: Non-Synonymous SNP, NC: non-coding region, STOP: stop codon inserted, INDEL: insertion or deletion.
(PDF)
P-values determined by Analysis of Covariance to determine statistically significant differences in growth parameters. The growth rates and yields are calculated from slopes. For growth rate the slope is calculated from a plot of ln(biomass) vs. time. For yields, the slope is calculated from product vs. substrate. Statistical comparisons of slopes from different experiments were conducted using Analysis of Covariance. Briefly, a multiple regression was conducted for each pair-wise comparison for the dependent variable y as a function of the independent variables x and z, where z encodes the treatment (0 for treatment A and 1 for treatment B). The reported p-values represent the statistical significance of the treatment variable term in the multiple regression. P-values < 0.05 is considered statistically significant.
(PDF)
Acknowledgments
The authors thank Adam M. Guss for assistance with single colony isolations; Loren J. Hauser, Adam M. Guss and Tatiana V. Karpinets for assistance with genetic mutation analysis; Steve D. Brown, Dawn M. Klingeman and Courtney M. Johnson for assistance with DNA and RNA purification; Steve D. Brown for assistance with transcriptome analysis Abhijeet P. Borole for assistance with carbon dioxide and hydrogen measurements; and Qiang He for valuable discussions.
Funding Statement
This research was supported by the BioEnergy Science Center, a Department of Energy Bioenergy Research Center supported by the Office of Biological and Environmental Research in the Department of Energy Office of Science. Additional support was provided by the Institute for a Secure and Sustainable Environment at the University of Tennessee. Oak Ridge National Laboratory is managed by UT-Battelle, LLC, for the DOE under Contract DE-AC05-00OR22725. The funders had no role in study design, data collection and analysis, decision to publish, or preparation of the manuscript.
References
- 1. Lynd LR, Wyman CE, Gerngross TU (1999) Biocommodity engineering. Biotechnol Prog 15: 777-793. doi: 10.1021/bp990109e. PubMed: 10514248. [DOI] [PubMed] [Google Scholar]
- 2. Lynd LR, van Zyl WH, McBride JE, Laser M (2005) Consolidated bioprocessing of cellulosic biomass: an update. Curr Opin Biotechnol 16: 577-583. doi: 10.1016/j.copbio.2005.08.009. PubMed: 16154338. [DOI] [PubMed] [Google Scholar]
- 3. Shao XJ, Raman B, Zhu MJ, Mielenz JR, Brown SD et al. (2011) Mutant selection and phenotypic and genetic characterization of ethanol-tolerant strains of Clostridium thermocellum . Appl Microbiol Biotechnol 92: 641-652. doi: 10.1007/s00253-011-3492-z. PubMed: 21874277. [DOI] [PubMed] [Google Scholar]
- 4. Palmqvist E, Hahn-Hagerdal B (2000) Fermentation of lignocellulosic hydrolysates. II: inhibitors and mechanisms of inhibition. Bioresour Technol 74: 25-33. doi: 10.1016/S0960-8524(99)00161-3. [DOI] [Google Scholar]
- 5. Klinke HB, Thomsen AB, Ahring BK (2004) Inhibition of ethanol-producing yeast and bacteria by degradation products produced during pre-treatment of biomass. Appl Microbiol Biotechnol 66: 10-26. doi: 10.1007/s00253-004-1642-2. PubMed: 15300416. [DOI] [PubMed] [Google Scholar]
- 6. Nicolaou SA, Gaida SM, Papoutsakis ET (2010) A comparative view of metabolite and substrate stress and tolerance in microbial bioprocessing: From biofuels and chemicals, to biocatalysis and bioremediation. Metab Eng 12: 307-331. doi: 10.1016/j.ymben.2010.03.004. PubMed: 20346409. [DOI] [PubMed] [Google Scholar]
- 7. Palmqvist E, Almeida JS, Hahn-Hägerdal B (1999) Influence of furfural on anaerobic glycolytic kinetics of Saccharomyces cerevisiae in batch culture. Biotechnol Bioeng 62: 447-454. doi: 10.1002/(SICI)1097-0290(19990220)62:4. PubMed: 9921153. [DOI] [PubMed] [Google Scholar]
- 8. Brown SD, Guss AM, Karpinets TV, Parks JM, Smolin N et al. (2011) Mutant alcohol dehydrogenase leads to improved ethanol tolerance in Clostridium thermocellum . Proc Natl Acad Sci U S A 108: 13752-13757. doi: 10.1073/pnas.1102444108. PubMed: 21825121. [DOI] [PMC free article] [PubMed] [Google Scholar]
- 9. Roberts SB, Gowen CM, Brooks JP, Fong SS (2010) Genome-scale metabolic analysis of Clostridium thermocellum for bioethanol production. BMC. Syst Biol 4. [DOI] [PMC free article] [PubMed] [Google Scholar]
- 10. Yu TT, Xu XP, Peng YF, Luo YM, Yang KQ (2012) Cell wall proteome of Clostridium thermocellum and detection of glycoproteins. Microbiol Res 167: 364-371. doi: 10.1016/j.micres.2012.02.006. PubMed: 22494898. [DOI] [PubMed] [Google Scholar]
- 11. Riederer A, Takasuka TE, Makino S, Stevenson DM, Bukhman YV et al. (2011) Global Gene Expression Patterns in Clostridium thermocellum as Determined by Microarray Analysis of Chemostat Cultures on Cellulose or Cellobiose. Appl Environ Microbiol 77: 1243-1253. doi: 10.1128/AEM.02008-10. PubMed: 21169455. [DOI] [PMC free article] [PubMed] [Google Scholar]
- 12. Raman B, Pan C, Hurst GB, Rodriguez M, McKeown CK et al. (2009) Impact of Pretreated Switchgrass and Biomass Carbohydrates on Clostridium thermocellum ATCC 27405 Cellulosome Composition: A Quantitative Proteomic Analysis. PLOS ONE 4: e5271 PubMed: 19384422. [DOI] [PMC free article] [PubMed] [Google Scholar]
- 13. Williams TI, Combs JC, Lynn BC, Strobel HJ (2007) Proteomic profile changes in membranes of ethanol-tolerant Clostridium thermocellum . Appl Microbiol Biotechnol 74: 422-432. doi: 10.1007/s00253-006-0689-7. PubMed: 17124583. [DOI] [PubMed] [Google Scholar]
- 14. Pienkos PT, Zhang M (2009) Role of pretreatment and conditioning processes on toxicity of lignocellulosic biomass hydrolysates. Cellulose 16: 743-762. doi: 10.1007/s10570-009-9309-x. [DOI] [Google Scholar]
- 15. DOE (2006) /SC-0095 Breaking the biological barriers to cellulosuc ethanol: a joint research agenda. U.S. Department of Energy. [Google Scholar]
- 16. Conrad TM, Lewis NE, Palsson BO (2011) Microbial laboratory evolution in the era of genome-scale science. Mol Syst Biol 7: 11 PubMed: 21734648. [DOI] [PMC free article] [PubMed] [Google Scholar]
- 17. Medini D, Serruto D, Parkhill J, Relman DA, Donati C et al. (2008) Microbiology in the post-genomic era. Nat Rev Microbiol 6: 419-430. PubMed: 18475305. [DOI] [PubMed] [Google Scholar]
- 18. Marioni JC, Mason CE, Mane SM, Stephens M, Gilad Y (2008) RNA-seq: An assessment of technical reproducibility and comparison with gene expression arrays. Genome Res 18: 1509-1517. doi: 10.1101/gr.079558.108. PubMed: 18550803. [DOI] [PMC free article] [PubMed] [Google Scholar]
- 19. Oshlack A, Robinson MD, Young MD (2010) From RNA-seq reads to differential expression results. Genome Biol 11: 10. doi: 10.1186/gb-2010-11-s1-i10. PubMed: 21176179. [DOI] [PMC free article] [PubMed] [Google Scholar]
- 20. Nataf Y, Bahari L, Kahel-Raifer H, Borovok I, Lamed R et al. (2010) Clostridium thermocellum cellulosomal genes are regulated by extracytoplasmic polysaccharides via alternative sigma factors. Proc Natl Acad Sci U S A 107: 18646-18651. doi: 10.1073/pnas.1012175107. PubMed: 20937888. [DOI] [PMC free article] [PubMed] [Google Scholar]
- 21. Dror TW, Morag E, Rolider A, Bayer EA, Lamed R et al. (2003) Regulation of the cellulosomal celS (cel48A) gene of Clostridium thermocellum is growth rate dependent. J Bacteriol 185: 3042-3048. doi: 10.1128/JB.185.10.3042-3048.2003. PubMed: 12730163. [DOI] [PMC free article] [PubMed] [Google Scholar]
- 22. Stevenson DM, Weimer PJ (2005) Expression of 17 genes in Clostridium thermocellum ATCC 27405 during fermentation of cellulose or cellobiose in continuous culture. Appl Environ Microbiol 71: 4672-4678. doi: 10.1128/AEM.71.8.4672-4678.2005. PubMed: 16085862. [DOI] [PMC free article] [PubMed] [Google Scholar]
- 23. Bahari L, Gilad Y, Borovok I, Kahel-Raifer H, Dassa B et al. (2011) Glycoside hydrolases as components of putative carbohydrate biosensor proteins in Clostridium thermocellum . J Ind Microbiol Biotechnol 38: 825-832. doi: 10.1007/s10295-010-0848-9. PubMed: 20820855. [DOI] [PubMed] [Google Scholar]
- 24. Zhang YHP, Lynd LR (2005) Regulation of cellulase synthesis in batch and continuous cultures of Clostridium thermocellum . J Bacteriol 187: 99-106. doi: 10.1128/JB.187.1.99-106.2005. PubMed: 15601693. [DOI] [PMC free article] [PubMed] [Google Scholar]
- 25. Kahel-Raifer H, Jindou S, Bahari L, Nataf Y, Shoham Y et al. (2010) The unique set of putative membrane-associated anti-Sigma factors in Clostridium thermocellum suggests a novel extracellular carbohydrate-sensing mechanism involved in gene regulation. FEMS Microbiol Lett 308: 84-93. doi: 10.1111/j.1574-6968.2010.01997.x. PubMed: 20487018. [DOI] [PubMed] [Google Scholar]
- 26. Rani KS, Seenayya G (1999) High ethanol tolerance of new isolates of Clostridium thermocellum strains SS21 and SS22. World J Microbiol Biotechnol 15: 173-178. doi: 10.1023/A:1008863410460. [DOI] [PubMed] [Google Scholar]
- 27. Raman B, McKeown CK, Rodriguez M, Brown SD, Mielenz JR (2011) Transcriptomic analysis of Clostridium thermocellum ATCC 27405 cellulose fermentation. BMC Microbiol 11: 15. doi: 10.1186/1471-2180-11-15. PubMed: 21247468. [DOI] [PMC free article] [PubMed] [Google Scholar]
- 28. Zhang YH, Lynd LR (2003) Quantification of cell and cellulase mass concentrations during anaerobic cellulose fermentation: Development of an enzyme-linked immunosorbent assay-based method with application to Clostridium thermocellum batch cultures. Anal Chem 75: 219-227. doi: 10.1021/ac020271n. PubMed: 12553755. [DOI] [PubMed] [Google Scholar]
- 29. Ozkan M, Desai SG, Zhang Y, Stevenson DM, Beane J et al. (2001) Characterization of 13 newly isolated strains of anaerobic, cellulolytic, thermophilic bacteria. J Ind Microbiol Biotechnol 27: 275-280. doi: 10.1038/sj.jim.7000082. PubMed: 11781801. [DOI] [PubMed] [Google Scholar]
- 30. Schell DJ, Farmer J, Newman M, McMillan JD (2003) Dilute-sulfuric acid pretreatment of corn stover in pilot-scale reactor - Investigation of yields, kinetics, and enzymatic digestibilities of solids. Appl Biochem Biotechnol 105: 69-85. doi: 10.1385/ABAB:105:1-3:69. PubMed: 12721476. [DOI] [PubMed] [Google Scholar]
- 31. Jung HW, Tschaplinski TJ, Wang L, Glazebrook J, Greenberg JT (2009) Priming in Systemic Plant Immunity. Science 324: 89-91. doi: 10.1126/science.1170025. PubMed: 19342588. [DOI] [PubMed] [Google Scholar]
- 32. Miller EN, Jarboe LR, Yomano LP, York SW, Shanmugam KT et al. (2009) Silencing of NADPH-Dependent Oxidoreductase Genes (yqhD and dkgA) in Furfural-Resistant Ethanologenic Escherichia coli . Appl Environ Microbiol 75: 4315-4323. doi: 10.1128/AEM.00567-09. PubMed: 19429550. [DOI] [PMC free article] [PubMed] [Google Scholar]
- 33. Grigoriev IV, Nordberg H, Shabalov I, Aerts A, Cantor M et al. (2012) The Genome Portal of the Department of Energy Joint Genome Institute. Nucleic Acids Res 40: D26-D32. doi: 10.1093/nar/gkr947. PubMed: 22110030. [DOI] [PMC free article] [PubMed] [Google Scholar]
- 34. Li H, Ruan J, Durbin R (2008) Mapping short DNA sequencing reads and calling variants using mapping quality scores. Genome Res 18: 1851–8. PubMed: 18714091. [DOI] [PMC free article] [PubMed] [Google Scholar]
- 35. Syed MH, Karpinets TV, Parang M, Leuze MR, Park BH et al. (2012) BESC knowledgebase public portal. Bioinformatics 28: 750-751. doi: 10.1093/bioinformatics/bts016. PubMed: 22238270. [DOI] [PMC free article] [PubMed] [Google Scholar]
- 36. Finn RD, Mistry J, Schuster-Böckler B, Griffiths-Jones S, Hollich V et al. (2006) Pfam: clans, web tools and services. Nucleic Acids Res 34: D247-D251. doi: 10.1093/nar/gkj149. PubMed: 16381856. [DOI] [PMC free article] [PubMed] [Google Scholar]
- 37. Bateman A, Birney E, Cerruti L, Durbin R, Etwiller L et al. (2002) The Pfam Protein Families Database. Nucleic Acids Res 30: 276-280. doi: 10.1093/nar/30.1.276. PubMed: 11752314. [DOI] [PMC free article] [PubMed] [Google Scholar]
- 38. Cudeck R (1989) Analysis of correlation-matrices uning covariance structure models. Psychol Bull 105: 317-327. doi: 10.1037/0033-2909.105.2.317. [DOI] [Google Scholar]
- 39. Bullard JH, Purdom E, Hansen KD, Dudoit S (2010) Evaluation of statistical methods for normalization and differential expression in mRNA-Seq experiments. BMC Bioinformatics 11: 13. doi: 10.1186/1471-2105-11-S6-S13. PubMed: 20055994. [DOI] [PMC free article] [PubMed] [Google Scholar]
- 40. Du BW, Sharma LN, Becker C, Chen SF, Mowery RA et al. (2010) Effect of Varying Feedstock-Pretreatment Chemistry Combinations on the Formation and Accumulation of Potentially Inhibitory Degradation Products in Biomass Hydrolysates. Biotechnol Bioeng 107: 430-440. doi: 10.1002/bit.22829. PubMed: 20552667. [DOI] [PubMed] [Google Scholar]
- 41. Varga E, Klinke HB, Réczey K, Thomsen AB (2004) High Solid Simultaneous Saccharification and Fermentation of Wet Oxidized Corn Stover to Ethanol. Biotechnol Bioeng, 88: 567-574. PubMed: 15470714. [DOI] [PubMed] [Google Scholar]
- 42. Joh LD, Rezaei F, Barabote RD, Parales JV, Parales RE et al. (2010) Effects of Phenolic Monomers on Growth of Acidothermus cellulolyticus . American Institute of Chemical Engineers; pp. 1-8. PubMed; : 21312351 [DOI] [PubMed] [Google Scholar]
- 43. Palmqvist E, Hahn-Hagerdal B (2000) Fermentation of lignocellulosic hydrolysates. I: inhibition and detoxification. Bioresour Technol 74: 17-24. doi: 10.1016/S0960-8524(99)00160-1. [DOI] [Google Scholar]
- 44. Ezeji T, Qureshi N, Blaschek HP (2007) Butanol production from agricultural residues: Impact of degradation products on Clostridium beijerinckii growth and butanol fermentation. Biotechnol Bioeng 97: 1460-1469. doi: 10.1002/bit.21373. PubMed: 17274071. [DOI] [PubMed] [Google Scholar]
- 45. Geddes CC, Mullinnix MT, Nieves IU, Peterson JJ, Hoffman RW et al. (2010) Simplified process for ethanol production from sugarcane bagasse using hydrolysate-resistant Escherichia coli strain MM160. PubMed: 21111615 [DOI] [PubMed] [Google Scholar]
- 46. Geng AL, Wang ZK, Lai KS, Tan MWY (2010) Bioenergy II: Comparison of Laboratory and Industrial Saccharomyces cerevisiae Strains for their Stress Tolerance. Int J Chem Reactor Eng 8. [Google Scholar]
- 47. Barber MS, McConnell VS, DeCaux BS (2000) Antimicrobial intermediates of the general phenylpropanoid and lignin specific pathways. Phytochemistry 54: 53-56. doi: 10.1016/S0031-9422(00)00038-8. PubMed: 10846747. [DOI] [PubMed] [Google Scholar]
- 48. Zhang Y, Han B, Ezeji Chukwuemeka T (2011) Biotransformation of furfural and 5-hydroxymethylfurfural (HMF) by Clostridiumacetobutylicium ATCC 824 during butanol fermentation. New Biotechnology [DOI] [PubMed]
- 49. Malik S, Willby M, Sikes D, Tsodikov OV, Posey JE (2012) New Insights into Fluoroquinolone Resistance in Mycobacterium tuberculosis: Functional Genetic Analysis of gyrA and gyrB Mutations. PLOS ONE 7: 10 PubMed: 22761889. [DOI] [PMC free article] [PubMed] [Google Scholar]
- 50. Moeller R, Vlašić I, Reitz G, Nicholson WL (2012) Role of altered rpoB alleles in Bacillus subtilis sporulation and spore resistance to heat, hydrogen peroxide, formaldehyde, and glutaraldehyde. Arch Microbiol 194: 759-767. doi: 10.1007/s00203-012-0811-4. PubMed: 22484477. [DOI] [PubMed] [Google Scholar]
- 51. Alper H, Stephanopoulos G (2007) Global transcription machinery engineering: A new approach for improving cellular phenotype. Metab Eng 9: 258-267. doi: 10.1016/j.ymben.2006.12.002. PubMed: 17292651. [DOI] [PubMed] [Google Scholar]
- 52. Hosokawa K, Park NH, Inaoka T, Itoh Y, Ochi K (2002) Streptomycin-resistant (rpsL) or rifampicin-resistant (rpoB) mutation in Pseudomonas putida KH146-2 confers enhanced tolerance to organic chemicals. Environ Microbiol 4: 703-712. doi: 10.1046/j.1462-2920.2002.00348.x. PubMed: 12460278. [DOI] [PubMed] [Google Scholar]
- 53. Lee ASG, Ong DCT, Wong JCL, Siu GKH, Yam WC (2012) High-Resolution Melting Analysis for the Rapid Detection of Fluoroquinolone and Streptomycin Resistance in Mycobacterium tuberculosis . PLOS ONE 7: 8 PubMed: 22363772. [DOI] [PMC free article] [PubMed] [Google Scholar]
- 54. Jourdan SS, McDowall KJ (2008) Sensing of 5 ' monophosphate by Escherichia coli RNase G can significantly enhance association with RNA and stimulate the decay of functional mRNA transcripts in vivo. Mol Microbiol 67: 102-115. PubMed: 18078441. [DOI] [PubMed] [Google Scholar]
- 55. Almeida JRM, Modig T, Petersson A, Hahn-Hagerdal B, Liden G et al. (2007) Increased tolerance and conversion of inhibitors in lignocellulosic hydrolysates by Saccharomyces cerevisiae . J Chem Technol Biotechnol 82: 340-349. doi: 10.1002/jctb.1676. [DOI] [Google Scholar]
- 56. Cotter PD, Hill C (2003) Surviving the acid test: Responses of gram-positive bacteria to low pH. Microbiol Mol Biol Rev 67: 429–53, table of contents-+ doi: 10.1128/MMBR.67.3.429-453.2003. PubMed: 12966143. [DOI] [PMC free article] [PubMed] [Google Scholar]
- 57. Miller EN, Jarboe LR, Turner PC, Pharkya P, Yomano LP et al. (2009) Furfural Inhibits Growth by Limiting Sulfur Assimilation in Ethanologenic Escherichia coli Strain LY180. Appl Environ Microbiol 75: 6132-6141. doi: 10.1128/AEM.01187-09. PubMed: 19684179. [DOI] [PMC free article] [PubMed] [Google Scholar]
- 58. Grimsley JK, Tjalkens RB, Strauch MA, Bird TH, Spiegelman GB et al. (1994) Subunit composistion and domain-structure of Spo0A sporulation transcription factor of Bacillus subtilis . J Biol Chem 269: 16977-16982. PubMed: 8207022. [PubMed] [Google Scholar]
- 59. Hoch JA (1993) Regulation of the phophorelay and the initiation of sporulation in Bacillus subtilis . Annu Rev Microbiol 47: 441-465. doi: 10.1146/annurev.mi.47.100193.002301. PubMed: 8257105. [DOI] [PubMed] [Google Scholar]
- 60. Fawcett P, Eichenberger P, Losick R, Youngman P (2000) The transcriptional profile of early to middle sporulation in Bacillus subtilis . Proc Natl Acad Sci U S A 97: 8063-8068. doi: 10.1073/pnas.140209597. PubMed: 10869437. [DOI] [PMC free article] [PubMed] [Google Scholar]
- 61. Shi Z, Blaschek HP (2008) Transcriptional Analysis of Clostridium beijerinckii NCIMB 8052 and the Hyper-Butanol-Producing Mutant BA101 during the Shift from Acidogenesis to Solventogenesis. Appl Environ Microbiol 74: 7709-7714. doi: 10.1128/AEM.01948-08. PubMed: 18849451. [DOI] [PMC free article] [PubMed] [Google Scholar]
- 62. Tomas CA, Alsaker KV, Bonarius HPJ, Hendriksen WT, Yang H et al. (2003) DNA array-based transcriptional analysis of asporogenous, nonsolventogenic Clostridium acetobutylicum strains SKO1 and M5. J Bacteriol 185: 4539-4547. doi: 10.1128/JB.185.15.4539-4547.2003. PubMed: 12867463. [DOI] [PMC free article] [PubMed] [Google Scholar]
- 63. Zeller T, Klug G (2006) Thioredoxins in bacteria: functions in oxidative stress response and regulation of thioredoxin genes. Naturwissenschaften 93: 259-266. doi: 10.1007/s00114-006-0106-1. PubMed: 16555095. [DOI] [PubMed] [Google Scholar]
- 64. Ichinose H, Diertavitian S, Fujimoto Z, Kuno A, Lo Leggio L et al. (2012) Structure-based engineering of glucose specificity in a family 10 xylanase from Streptomyces olivaceoviridis E-86. Proc Biochem 47: 358-365. doi: 10.1016/j.procbio.2011.06.002. [DOI] [Google Scholar]
- 65. Jeng WY, Wang NC, Lin MH, Lin CT, Liaw YC et al. (2011) Structural and functional analysis of three beta-glucosidases from bacterium Clostridium cellulovorans, fungus Trichoderma reesei and termite Neotermes koshunensis . J Struct Biol 173: 46-56. doi: 10.1016/j.jsb.2010.07.008. PubMed: 20682343. [DOI] [PubMed] [Google Scholar]
- 66. Pao SS, Paulsen IT, Saier MH (1998) Major facilitator superfamily. Microbiol Mol Biol Rev 62: 1–34 -+ PubMed: 9529885. [DOI] [PMC free article] [PubMed] [Google Scholar]
Associated Data
This section collects any data citations, data availability statements, or supplementary materials included in this article.
Supplementary Materials
Growth comparison of WT and 7 different single colony isolates in standard MTC media and 17.5% v/v Populus Hydrolysate. The OD was referenced to an uninoculated sample of medium incubated with the samples. The PM and WT have the ability to degrade two of the compounds in the Populus hydrolysate which lightens the color and leads to the negative OD.
(TIF)
PM and WT growth comparison on insoluable substrate (Avicel) as a function of pellete and supernatant nitrogen concentration taken over time.
(TIF)
Longitudinal Genomic Analysis in which six populations samples along the evolutionary process were sequenced to determine when the mutations occurred. (A) Daily transfers over the entire evolutionary process in various hydrolysate concentrations. The arrows indicate where in the process the different population samples were taken for sequencing. Samples were considered either final mutations if taken at the end of a given concentrations evolutionary process or intermediate mutants if taken during the middle of the processes. (B) The total number of mutations that occurred for each population by catergory of the pan genomic analysis.
(TIF)
Pan Genomic Analysis of the seven single colony isolates from the final 17.5% v/v Populus hydrolysate-tolerant mutant strain. The core mutations are most likely responsible for the increased robustness since they are shared by all isolates.
(TIF)
Distribution analysis of mutations data. Syn: synonymous SNP, Non-Syn: Non-Synonymous SNP, INDEL: insertion or deletion, and STOP: stop codon inserted.
(TIF)
In Comparison of the g/L Dry Cell Weight (DCW) versus g/L H2 production in A) 0% v/v Populus hydrolysate and B) 10% v/v Populus hydrolysate. Compaison of the g/L DCW versus g/L CO2 production in C) 0% v/v Populus hysrolysate and D) 10% v/v Populus hydrolysate. The comparisons are for the PM and WT strains for the exponential growth phase using a sacraficial test tube experiment. Trendlines were added to show the rate of production.
(TIF)
Clostridium thermocellum genomic analysis : An excel File containing the full list of possible mutations received from JGI.
(XLSX)
Differential Gene Expression Profiles : An excel file containing the significantly differentially expressed genes based of the ANOVA results.
(XLSX)
Cthe_2376-alignment: A text containing the Clustawl alignment of the SNP in Cthe_2376 with the top 100 hits.
(TXT)
Cthe_2724-alignment: A text containing the Clustawl alignment of the SNP in Cthe_2724 with the top 100 hits.
(TXT)
Cthe_2727-alignment: A text containing the Clustawl alignment of the SNP in Cthe_2727 with the top 100 hits.
(TXT)
Selected mutations for verification of mutations in the WT and PM Isolate 6. The putative mutations included for PCR verification 19 high confidence mutations and 9 false postive mutations. The table lists the gene name, position of the mutation, type of mutations as determined by JGI (Syn: synonymous SNP, Non-Syn: Non-Synonymous SNP, NC: non-coding region, STOP: stop codon inserted, INDEL: insertion or deletion, FP- false positive, ISE – instrument specific error or ???- unknown), the identity of the base in question determined in the PCR products of the WT and PM strains (WT:PM), and the final determination of whether a real mutation or a false positive mutation occurred. Both the forward and reverse strands were sequenced for each mutation listed.
(PDF)
Shared and uniquie mutations in the seven single colony isolates. ‘X’ marks which isolate contained the mutation. * Indicates that the mutation was detected in the final 17.5% v/v Populus hydrolysate tolerant mutant populuation sample at less than 2%. The rest of the mutations were not detected in the population sample. None of the mutations were detected in earlier population samples. Type of mutations: Syn: synonymous SNP, Non-Syn: Non-Synonymous SNP, NC: non-coding region, STOP: stop codon inserted, INDEL: insertion or deletion.
(PDF)
P-values determined by Analysis of Covariance to determine statistically significant differences in growth parameters. The growth rates and yields are calculated from slopes. For growth rate the slope is calculated from a plot of ln(biomass) vs. time. For yields, the slope is calculated from product vs. substrate. Statistical comparisons of slopes from different experiments were conducted using Analysis of Covariance. Briefly, a multiple regression was conducted for each pair-wise comparison for the dependent variable y as a function of the independent variables x and z, where z encodes the treatment (0 for treatment A and 1 for treatment B). The reported p-values represent the statistical significance of the treatment variable term in the multiple regression. P-values < 0.05 is considered statistically significant.
(PDF)