

Summary
Background
Adult cystic fibrosis (CF) patients are an expanding cohort that is taken care of in a variety of hospital settings including adult centers located within pediatric institutions. This study compared costs and discharge rates among adult CF patient hospitalizations in terms of location of hospitalization.
Methods
The 2007 Nationwide Inpatient Sample was utilized to identify adult CF patient admission data on patients aged 18–44. Data were separated into pediatric and adult facilities based on percentage discharge rate for patients >18. Primary outcomes measures were length of stay (LOS) and total hospital charges. Secondary predictors were geographic, primary payer, and co-morbidity effects on LOS and total hospital charges.
Results
LOS was higher for adult CF patient admissions in pediatric facilities compared to adult facilities by a mean of 2.5 days. Mean total hospital charges were not significantly different. Adult hospitals in the Western U.S. had a mean total charge more than $50,000 greater than any region in the U.S. Self-pay patients had significantly fewer hospital days and charges across all hospital types. Adult facilities had 7% more CF patients discharged home with home healthcare use. Depressed CF patients had longer LOS by 1.5 days regardless of facility type.
Conclusions
LOS for adult CF inpatient admissions was significantly lower in adult facilities compared to pediatric facilities without a significant difference in hospital charges and is influenced by geographic hospital location. Depressed patients had longer lengths of stay regardless of facility type. Self-insured adult CF patients have a significant reduction in LOS and hospital charges when compared to all other payers regardless of hospital type.
Keywords: healthcare utilization, socioeconomic factors, geographic factors
INTRODUCTION
Cystic fibrosis (CF) is a common genetic disorder affecting nearly 30,000 people in the United States alone. It is characterized by progressive respiratory infections and organ dysfunction due to inspissated mucus, ultimately leading to death. Care for CF patients has improved dramatically over the past few decades resulting in a tremendous increase in average life expectancy. In 1985 the average lifespan of a person with CF was 25 years; by 2009 it had risen to 37.4 years.1 Advancements in airway clearance, antibiotics, nutrition, detection of milder phenotypes, and early detection through newborn screening have all contributed to the increasing lifespan of CF patients. Currently, approximately 46% of the patients in the CF registry are >18 years old.1
Advancing age of surviving CF patients has led to the challenge of taking care of a new population of patients. Pediatric pulmonologists were not accustomed to taking care of adults in the past, and adult pulmonologists had limited exposure to the complexities of this disorder. The Cystic Fibrosis Foundation recommends “care for adults delivered in inpatient and outpatient facilities that are appropriate for adults with laboratory services as outlined in Clinical Practice Guidelines.”2 Three general models of care for adult CF patients exist in today’s clinical setting. Some adult CF centers are located in adult facilities separate from the traditional pediatric CF center and are cared for in recently developed multi-disciplinary teams by adult providers. The second model has CF adult centers that are based out of children’s hospitals where there are established multi-disciplinary teams in place for care along with pediatric and adult practitioners familiar with the complexities of managing this multi-organ disease. However, in this model patients may still have short stays at adult facilities for procedures not performed in pediatric institutions. A third, or mixed model exists where institutions have existing pediatric and adult practitioners and facilities available in the same location. Difficulties in care for adult patients in pediatric facilities can arise during inpatient admissions when non-CF related concerns arise that house-staff and nurses may not be trained to recognize or treat, such as myocardial infarction or pregnancy complications. Pediatric sub-specialists also may not have expertise dealing with adult complications and defer consultation requests. These co-morbidities can contribute to prolonged length of stay (LOS) and hospital charges for patients in pediatric facilities. However, pediatric facilities generally have more experience in recognizing long-term complications related to CF care that can contribute to overall mortality. It is well established that patients have better clinical outcomes when followed in CF centers, regardless of whether the institution is pediatric or adult based.3
We chose to follow up on a previous broad comparison of adult healthcare use among several chronic childhood illnesses with a specific focus on CF care. Okumura et al.4 had shown that adult patients have longer LOS as well as higher overall hospital charges during hospitalization in pediatric facilities when compared to adult institutions. However, these data were not analyzed separately for possible predictive factors such as socioeconomic status or co-morbidities. Adult CF patients >30 were a cohort recently shown to have the largest increases in total medical costs between the years 2001 and 2007.5 The U.S. CF data registry approximates that 4.8% of adults have no insurance to cover medical expenses, emphasizing the importance of cost-efficient care.6 Additionally, CF patients with insurance have been shown to have 22 times higher annual medical care expenditures than those without CF.7 Different socioeconomic factors among patients with insurance can impact care for CF as Medicaid patients have a 3.7-fold higher death risk than CF patients without Medicaid.8 Medicaid assisted CF patients were also found to have worse lung function and more IV antibiotics for pulmonary exacerbations leading to more inpatient hospitalizations.9,10
The focus of this article will be on comparing the three models of adult CF care for differences and predictors of hospital costs and duration of stay for adult CF patients. We hypothesized that LOS and hospital charges for adult CF patients would be higher in pediatric facilities. By examining predictors of LOS and hospital charges for adult inpatient CF admissions, we hope to gain a better estimation of the economic impact of this growing population on our medical system during acute hospitalizations.
MATERIALS AND METHODS
This study was deemed exempt from institutional review by the Nationwide Children’s Hospital Institutional Review Board consistent with federal guidelines on human subject research and the use of de-identified data. The 2007 Nationwide Inpatient Sample (NIS) was analyzed for differences in LOS, total hospital charges and mortality between adult, pediatric, and mixed inpatient facilities discharges of adult CF patients. The NIS is a database of hospital inpatient stays as part of the Healthcare Cost and Utilization Project (HCUP). HCUP is a family of healthcare databases sponsored by the Agency for Healthcare Research and Quality. HCUP includes the largest collection of hospital care data in the U.S. The NIS contains data from approximately 8 million hospital stays each year. The 2007 NIS contains all discharge data from 1,044 hospitals located in 40 States, approximating a 20% stratified sample of U.S. community hospitals. The sampling frame for the 2007 NIS is a sample of hospitals that comprises approximately 90% of all hospital discharges in the U.S. and does not differentiate between acute and non-acute hospitalizations and therefore includes all patient hospitalizations. The NIS is the only national hospital database containing charge information on all patients, regardless of payer. Finally, the NIS includes more than 100 clinical and non-clinical data elements for each hospital stay.11
For facilities not directly labeled as pediatric in the NIS, pediatric facilities were defined as more than 75% of discharges for any diagnosis (not just CF) were patients <18 years based on a previous classification by Okumura.4 Adult facilities were defined as more than 75% of discharges were for patients >18 years, and mixed facilities were in between these two classifications.
The primary predictor examined for inpatient LOS and hospital charges for adult CF patients was hospital type (pediatric, adult, and mixed). Secondary predictors included hospital region, primary payer, and co-morbidities, all of which have been shown to impact inpatient care for chronic diseases including CF.9,10,12,13 In particular, complex chronic conditions and public insurance use impact hospital utilization within pediatric hospitals.14
CF patients were identified in the NIS database using the ICD-9 codes of 277.00–277.09 as a primary or secondary discharge diagnosis from hospital discharge abstract information containing one primary diagnosis and the availability of multiple secondary diagnoses to include all relevant patient co-morbidities. NIS data elements are available at: http://www.hcup-us.ahrq.gov/nisoverview.jsp#Data. Adult patients were identified from the ages of 18 to 44 years. Eighteen was used as the standard cutoff for adults and 44 was chosen to avoid extreme skewness in LOS for elderly patients with other co-morbidities as per the method of Okumura while achieving a deviation above the average lifespan of an adult CF patient.4
Statistical analysis was performed using the software SAS (SAS 9.1.3, SAS Institute Inc., Cary, NC) to obtain all estimated statistics and account for the analysis of complex survey data.15 Statistical measures were weighted for national estimates. The survey linear and logistic regression procedures were used to determine differences in primary outcomes of LOS, total hospital charges, and in-house mortality.16 The SURVEYREG procedure available fits linear models for complex survey data. The difference in mean ages between the populations studied was controlled by regression testing. Holm’s method was used for multiple pairwise comparisons. A comprehensive regression analysis of the 30 standard co-morbidity measures available in the HCUP database was performed to control for underlying co-morbidities unrelated to CF, per standard protocol for large database analysis. A list of co-morbidities used is available at: http://www.hcup-us.ahrq.gov/db/nation/nis/nisdde.jsp under NIS severity file data elements and identified by ICD-9 codes. Co-morbidities are listed per individual encounters and only one hospitalization is needed for a relevant co-morbidity code to be included in the analysis.
RESULTS
Using the survey weights, observations representing 14,999 discharges nationally for adult CF patients aged 18–44 were analyzed from 2007. One thousand six hundred ten weighted discharges were from pediatric institutions. Mean patient age was 26.5 years with a heavy Caucasian predominance correlating with expected ethnic predisposition (90%, not listed). Approximately 75% of the total discharges were recorded in adult institutions (Table 1).
TABLE 1.
Breakdown of Patients by Hospital Type
| Characteristic | Pediatric hospital | Adult hospital | Mixed hospital | P-value |
|---|---|---|---|---|
| Discharges, weighted | 1,610 (10.7%) | 11,213 (74.8%) | 2,176 (14.5%) | |
| Stay less than 2 days | 100 (0.7%) | 1,992 (13.3%) | 302 (2.0%) | |
| Mean age, years (SE) | 23.97 (0.78) | 27.2 (0.22) | 25.06 (0.44) | 0.01* |
| Male (%) | 727 (45.0%) | 4,948 (44.0%) | 1,012 (47.0%) | 0.6 |
| Primary payer | ||||
| Medicare | 206 (12.8%) | 2,686 (24.3%) | 319 (14.7%) | <0.01* |
| Medicaid | 361 (22.4%) | 2,483 (22.4%) | 741 (34.0%) | 0.1 |
| Private | 756 (47.0%) | 4,659 (42.1%) | 970 (44.6%) | 0.7 |
| Self | 29 (1.8%) | 301 (2.7%) | 79 (3.6%) | |
| Mortality no. (%) | <10 (<0.01%) | 237 (2.1%) | 51 (2.3%) | 0.5 |
| Procedures | ||||
| Intubation | 14 (0.9%) | 728 (6.5%) | 118 (5.4%) | |
| Location | ||||
| Rural | Zero | 920 (8.2%) | 77 (3.5%) | 0.1 |
| Urban non-teaching | Zero | 1,442 (12.9%) | 337 (15.5%) | 0.6 |
| Urban teaching | 1,610 (100%) | 8,846 (78.9%) | 1,762 (80.1%) | |
| Disposition | ||||
| Routine | 1,231 (76.6%) | 7,193 (64.1%) | 1,658 (76.2%) | |
| Short-term hospital | 13 (0.8%) | 268 (2.4%) | 26 (1.2%) | 0.2 |
| Other transfers | <10 | 210 (1.9%) | 24 (1.1%) | 0.2 |
| Home health care | 340 (21.2%) | 3,171 (28.3%) | 372 (17.1%) | 0.03* |
| Against medical advice | 11 (0.7%) | 130 (1.2%) | 45 (2.1%) | 0.7 |
Indicates statistical significance of P value < 0.05.
Patient characteristics by hospital type are displayed in Table 1. Pediatric facilities were exclusively located in urban teaching facilities in comparison to approximately 80% urban teaching location for adult and mixed facilities. Medicare paid discharges were in higher proportion in adult facilities at 24.3% versus 12.8% in pediatric facilities with approximately equal Medicaid paid discharges except in mixed facilities. Self-insurance rates ranged from 1.8% to 3.6%. Adult facilities had a higher proportion of patients discharged with home health care at 28.3%, compared to pediatric facilities at 21.2%. Adult facilities also had a higher proportion of discharges <2 days of stay for CF patients at 13.3% compared to 0.7% for pediatric facilities.
There was a significantly longer mean LOS for adult patients in pediatric hospitals at 10.8 days compared to patients in adult hospitals at 8.3 days (P-value 0.0199, Fig. 1, E-Table 1). This was still significant after controlling for patient age, gender, co-morbidities and the secondary predictors geographic location and primary payor in a combined model. When admissions shorter than 2 days were excluded from analysis, there was still a significant difference in LOS at 11.4 and 9.7 days for pediatric and adult facilities, respectively (P-value 0.05, Fig. 1). Notably, the co-morbidity measure of depression was found in 15.0% of the sample cases (445 of 2,969), with a significant increase in overall LOS compared to non-depressed patients (P-value 0.0016), but no difference in total hospital charges (E-table 3). There was no difference in LOS for depressed patients between adult and pediatric facilities (P-value 0.7).
Fig. 1.
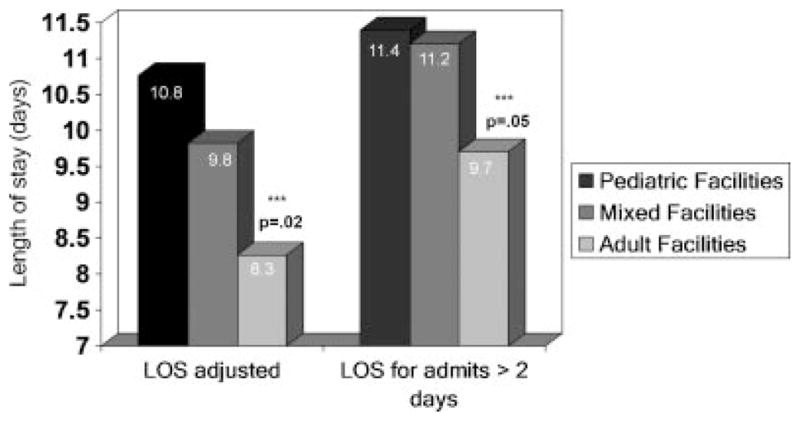
Length of stay by hospital type for adult CF patients. Adjusted length of stay in days for all admissions, and admissions >2 days for adult CF patients in pediatric, mixed and adult facilities. P values were significant at 0.02 for all admissions and 0.05 excluding short stay admissions <2 days.
Adjusted mean hospital charges had no difference for patients in pediatric ($53,095) and adult ($59,627) hospitals (P-value 0.855, Fig. 2, E-table 2). This was still not significant after controlling for patient age, gender, and co-morbidities and running an exclusion analysis without short hospital stays <2 days. A separate survey regression analysis excluding the top 2% of high total charges was performed which did not change the lack of significance.
Fig. 2.
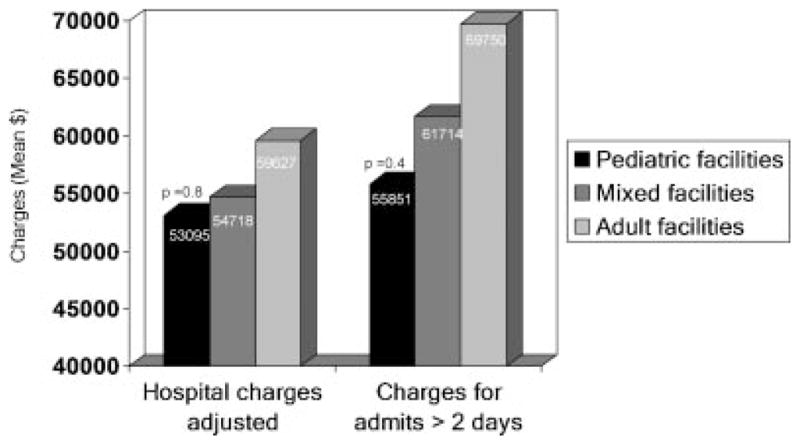
Hospital charges by hospital type for adult CF patients. Adjusted hospital charges in mean dollars for all admissions, and admissions >2 days for adult CF patients in pediatric, mixed, and adult facilities. P values were non-significant at 0.8 for all admissions and 0.4 excluding short stay admissions <2 days.
There was no difference in inpatient mortality between pediatric and adult hospitals (P-value 0.07). Less than 10 deaths were recorded in pediatric facilities and a specific number was not included as this could limit patient anonymity.
LOS and hospital charges were then further analyzed by primary payer and a significant decrease in LOS was found between self-pay patients and all other insurance types (P-value <0.0008, Table 2). There was also a significant decrease in total hospital charges between self-pay and all other insurance types (P-value <0.0006, Table 2). All other comparisons between payers were non-significant. The above values remained significant when using Holm’s method for multiple pairwise comparisons. The difference between Medicare and Medicaid hospital charges was found to be non-significant with Holm’s testing.
TABLE 2.
Length of Stay and Hospital Charges by Primary Payer
| Primary payer | LOS, mean days (95% CI) | P-value | Total charges, mean $ (95% CI) | P-value |
|---|---|---|---|---|
| Medicare | 9.2 (8.36–9.99) | <0.01* | 65,594 (44,007–87,180) | <0.01* |
| Medicaid | 9.1 (8.12–10.0) | <0.01* | 45,761 (38,430–53,091) | <0.01* |
| Private | 8.3 (7.33–9.25) | <0.01* | 57,119 (43,094–71,145) | <0.01* |
| Self-pay | 5.6 (4.26–6.92) | 24,650 (17,577–31,722) |
P values reflect comparison of self-payers to listed payer,
indicates statistical significance.
Analysis adjusted for age, gender, hospital type, geographic location, and co-morbidities.
LOS and hospital charges were also analyzed by survey regression for differences among the four regions of the United States: Northeast, Midwest, South, and West. A significance difference in LOS was found between regions, with the West having a higher LOS at 9.9 days than the Midwest and Northeast (P-value 0.0169, Table 3). There was also a significant difference in total hospital charges between regions, with the West also having the highest mean total charge at $107,194 (P-value 0.006, Table 3).
TABLE 3.
Length of Stay and Hospital Charges by Geographic Region
| Hospital region | Hospital type | LOS, mean days (95% CI) | P-value | Total charges, mean $ (95% CI) | P-value |
|---|---|---|---|---|---|
| Northeast | 8.1 (7.5–8.7) | 0.02* | 47,475 (30,297–64,651) | <0.01* | |
| Pediatric | N/A | N/A | |||
| Mixed | 7.8 (4.1–11.6) | 68,642 (38,420–98,864) | |||
| Adult | 8.1 (7.6–8.7) | 46,567 (28,440–64,692) | |||
| Midwest | 7.4 (6.1–8.7) | <0.01* | 38,205 (32,128–44,280) | <0.01* | |
| Pediatric | 8.7 (8.6–8.8) | 45,495 (38,540–52,450) | |||
| Mixed | 10.9 (10.7–11.2) | <0.01* | 52,262 (50,764–53,759) | 0.1 | |
| Adult | 5.9 (4.9–6.8) | <0.01* | 31,319 (23,540–39,097) | <0.01* | |
| South | 9.0 (7.8–10.1) | NS | 42,601 (35,642–49,558) | <0.01* | |
| Pediatric | 12.4 (12.0–12.9) | 59,132 (50,178–68,086) | |||
| Mixed | 10.4 (8.5–12.2) | 0.03 | 54,974 (40,107–69,841) | 0.6 | |
| Adult | 7.7 (6.3–9.0) | <0.01* | 34,076 (28,876–50,640) | <0.01* | |
| West | 9.9 (8.7–11.0) | 107,194 (68,296–146,090) | |||
| Pediatric | N/A | N/A | |||
| Mixed | 7.2 (5.7–8.7) | 51,851 (29,387–74,313) | |||
| Adult | 10.2 (9.1–11.3) | 113,348 (73,508–153,188) |
Analysis adjusted for age, gender, hospital type, insurance status, and co-morbidities.
P values reflect comparison of west region to others, and within regions the comparison of pediatric to other hospital types,
indicates statistical significance.
There were no pediatric facilities with discharges of adult CF patients in the Western and Northeastern U.S.
Finally, LOS and hospital charges were examined for the specific sub-group who were transferred to short-term hospitals, but statistical significance was not achieved due to the large variations from small sample size. Adult hospitals mean LOS was 5.8 days in comparison to pediatric facilities at 10.7 days, but only 13 pediatric hospital discharges were available for this comparison.
DISCUSSION
By using a large national inpatient sample of discharge information, we found that hospital LOS for adults with CF is significantly longer in pediatric hospitals when compared to adult hospitals. Total hospital charges for the stay were not different, but may be influenced by geographic cost variations. Increased LOS for adult patients in pediatric facilities compared to adult facilities is consistent with a previous broad comparison of chronic diseases.4 In that study CF patients were examined in the context of other chronic childhood diseases for differences in LOS and hospital charges along with patients with sickle cell and congenital heart disease. Our study adds to their findings by examining a larger set of CF patients with additional information on discharge dispositions as well as primary payer, geographic location, and co-morbid effects on LOS and total hospital charges. These are vital factors to the overall financial burden of CF care as hospitalizations have been shown to account for 47% of total yearly costs to CF patients.17
One possible contributing factor to the lack of statistical difference in total charges between pediatric and adult facilities was the markedly higher total charges observed in the West region seen in Table 3. Unfortunately, there were no pediatric facilities in the West with discharges of adult CF patients to compare hospital charges to adult facilities within their own region. In the Midwest and Southeast where pediatric and adult facilities were available for comparison, there were higher charges reported in the pediatric facilities as one would expect the facility with the higher LOS to incur higher costs over a more prolonged hospitalization. The survey regression model states that hospital region alone explains 8% of the variance of total charges observed in this study, making hospital region the most important predictor of total hospital charges among hospital type, age, co-morbidities, and region. While geographic inpatient expenditures have been reported to be higher in western U.S states in other chronic diseases such as congenital heart disease and acute illnesses such as mastoiditis, there have not been previously reported differences in CF patients.12,13
The differences in LOS between facility types could be explained by payment structure differences between adult and pediatric facilities and the increased pressures adult facilities are accustomed to in discharging patients in the timeliest fashion possible. Adult facilities tend to have increased Medicare patients and use of prospective payment systems where re-imbursement is based on a predetermined amount instead of the traditional fee for service model.18 Hospitals are placed at financial risk for increased LOS in such circumstances. In our study, by controlling for co-morbidities and age, this difference may be an institutionally driven practice rather than a result of discrepancies in severity of disease seen between the hospital types, but this is difficult to say in a retrospective study. Fee structures and pay for services can certainly influence the timing of discharges and how willing physicians may be to use outside services to help continue to provide medical care for their patients in place of inpatient facilities. This was supported by the finding that self-pay patients had significantly fewer hospital days and charges than other payment types, which could reflect financial pressures placed on providers to have patients discharged as soon as possible. There was also a difference in hospital charges based on primary payers for self-pay as above. Early discharges may put these patients at risk of complications, as CF patients without health insurance have been shown to have a higher mortality rate.19
Another explanation for the differences in LOS between hospital types could be the increased use of home health care among adult facilities. By transitioning patients to home sooner with home health services, these facilities may have been able to cut down on inpatient LOS. Increased home health usage in adult facilities may be some combination of the financial pressures as described above, along with an increased familiarity with services available for transitioning adults to home. CF health outcomes had been previously shown to be not associated with differential use of health services, but home healthcare usage was not mentioned in this study.9 Geographic variation in home healthcare usage among Medicare users has also been reported previously with a higher usage in southern states,20 which could potentially impact LOS and hospital charges. It is also important to consider the usage of home IV antibiotics and the total costs of home health-care usage are not available through this database in order to compare the additive costs of hospitalization with home care usage, to inpatient hospitalization alone.
It is worthwhile to note the high incidence of depression (15%) coded in this study and the significant association with increased LOS irrespective of hospital type. Depressive symptoms have been reported in the CF literature in varying ranges with smaller pediatric studies noting 3–29% prevalence of symptoms and a previous adult study noting a 30% screen rate of depressive symptoms.21–23 A larger recent study of the German CF population noted approximately 9.6% patients to have symptoms of depression.24 Our large sample of adult inpatients notes a prevalence percentage somewhere in the middle of these previous findings, but must take into account differences in medical coding practices. Future studies into the impact of depression on adult CF inpatient stays are necessary to follow up and validate this finding that may be significantly impacting inpatient lengths of stay.
We believe this study provides valuable information that will serve as a springboard for future studies into the economic impact of a growing adult CF population. In particular, the impact of hospital type and regional differences in LOS and hospital charges on respiratory, nutritional, and morbidity/mortality outcomes will be worthwhile to analyze from available CF registry data to see if the differences observed in this study translate into different health outcomes. For instance, in an adult CF patient how does decreased LOS relate to time to next hospitalization in adult and pediatric hospitals across the country? Also, continued work on the impact of depression and mood on health outcomes is ongoing and needs to be investigated further in relation to inpatient hospitalization resource usages irrespective of hospital location. Finally, the risks and benefits of home health care and transitional facilities in order to reduce overall LOS needs to be delineated further, as these are underutilized resources in pediatric facilities that might be able to decrease LOS for adult CF patients. This will need to be tied together with insurance status to determine the safety of transitional facilities or homecare for transition out of the hospital sooner for certain payors, such as the self-insured adults who cannot afford a lengthy inpatient stay.
This study was not intended to dissuade adult CF admissions in accredited adult CF centers within pediatric institutions, but instead provide impetus for further studies into the economic impact of this growing population.
Limitations
We acknowledge several limitations to our study due to its observational nature. First, when examining a national database one cannot control for data implementation or coding errors by those inputting the data or variations in interpretation of ICD-9 coding. However, the large sample size achieved should help control small errors in this fashion. Second, by limiting our patients to age 44 we did knowingly direct some selection bias. This was intended to reduce confounding co-morbidities that would be greatest in the oldest population of patients which could skew the data further.
This study was also limited by the information available in the NIS database as specific information regarding each patient’s acuity and hospital course is not available to help control for disease severity at admission such as FEV1. However, these large data sets have been used successfully to characterize resource utilization in similar chronic care cohorts with growing adult populations such as congenital heart disease.12,25 Additionally, repeat admissions cannot be determined due to lack of individual patient information as above.
The mortality data is fraught with confounders and may represent a sampling size error with <10 weighted deaths obtained for pediatric facilities. The other consideration would be that patients followed in pediatric CF centers had died outside of the hospital or in hospice settings within the hospital that were coded separately.
CONCLUSIONS
LOS for adult CF inpatient admissions was significantly lower in adult facilities compared to pediatric facilities without a significant difference in hospital charges and is influenced by geographic hospital location. Depressed patients had longer lengths of stay regardless of facility type. Self-insured adult CF patients have a significant reduction in LOS and hospital charges when compared to all other payers regardless of hospital type.
Acknowledgments
Funding source: Nationwide Children’s Hospital Graduate Medical Education Fund
B.K. contributed to study conception, design, analysis, and manuscript creation. W.W. provided statistical analysis and manuscript editing. D.C., K.K., and K.M. contributed to study design, analysis, and manuscript writing. Funding was provided by the Nationwide Children’s Hospital Graduate Medical Education Fund. Thanks to Dr. Stephen Kirkby and Dr. Mark Splaingard for their editing help.
ABBREVIATIONS
- CF
Cystic fibrosis
- LOS
Length of stay
- NIS
Nationwide Inpatient Sample
- HCUP
Healthcare Cost and Utilization Project
Footnotes
The authors have no conflict of interest related to this article.
Additional Supporting Information may be found in the online version of this article.
References
- 1.Cystic Fibrosis Foundation Patient Registry. 2009 annual data report. Bethesda, Maryland: Cystic Fibrosis Foundation Patient Registry; 2010. [Google Scholar]
- 2.Yankaskas J, Marshall B, Sufian B, Simon R, Rodman D. Cystic fibrosis adult care. Chest. 2004;125:1S–39S. doi: 10.1378/chest.125.1_suppl.1s. [DOI] [PubMed] [Google Scholar]
- 3.Mahadeva R, Webb K, Westerbeek RC, Carroll NR, Dodd ME, Bilton D, Lomas DA. Clinical outcome in relation to care in centres specialising in cystic fibrosis: cross sectional study. BMJ. 1998;316:1771–1775. doi: 10.1136/bmj.316.7147.1771. [DOI] [PMC free article] [PubMed] [Google Scholar]
- 4.Okumura M, Campbell A, Nasr S, Davis M. Inpatient health care use among adult survivors of chronic childhood illnesses in the United States. Arch Pediatr Adolesc Med. 2006;160:1054–1060. doi: 10.1001/archpedi.160.10.1054. [DOI] [PubMed] [Google Scholar]
- 5.Briesacher BA, Quittner AL, Fouayzi H, Zhang J, Swensen A. Nationwide trends in the medical care costs of privately insured patients with cystic fibrosis (CF), 2001–2007. Pediatr Pulmonol. 2011;46:770–776. doi: 10.1002/ppul.21441. [DOI] [PubMed] [Google Scholar]
- 6.Cystic Fibrosis Foundation Patient Registry. 2008 annual data report. Bethesda, Maryland: Cystic Fibrosis Foundation Patient Registry; 2009. [Google Scholar]
- 7.Ouyang L, Grosse SD, Amendah DD, Schechter MS. Healthcare expenditures for privately insured people with cystic fibrosis. Pediatr Pulmonol. 2009;44:989–996. doi: 10.1002/ppul.21090. [DOI] [PubMed] [Google Scholar]
- 8.Schechter MS, Shelton BJ, Margolis PA, Fitzsimmons SC. The association of socioeconomic status with outcomes in cystic fibrosis patients in the United States. Am J Respir Crit Care Med. 2001;163:1331–1337. doi: 10.1164/ajrccm.163.6.9912100. [DOI] [PubMed] [Google Scholar]
- 9.Schechter MS, McColley SA, Silva S, Haselkorn T, Konstan MW, Wagener JS. Association of socioeconomic status with the use of chronic therapies and healthcare utilization in children with cystic fibrosis. J Pediatr. 2009;155:634-9.e1–634-9.e4. doi: 10.1016/j.jpeds.2009.04.059. [DOI] [PMC free article] [PubMed] [Google Scholar]
- 10.Schechter MS, Margolis PA. Relationship between socioeconomic status and disease severity in cystic fibrosis. J Pediatr. 1998;132:260–264. doi: 10.1016/s0022-3476(98)70442-1. [DOI] [PubMed] [Google Scholar]
- 11.Agency for Healthcare Research and Quality. Healthcare Cost and Utilization Project. Rockville, MD: http://www.hcup-us.ahrq.gov/ [Google Scholar]
- 12.Connor JA, Gauvreau K, Jenkins KJ. Factors associated with increased resource utilization for congenital heart disease. Pediatrics. 2005;116:689–695. doi: 10.1542/peds.2004-2071. [DOI] [PubMed] [Google Scholar]
- 13.Acevedo JL, Lander L, Shah UK, Shah RK. Existence of important variations in the United States in the treatment of pediatric mastoiditis. Arch Otolaryngol Head Neck Surg. 2009;135:28–32. doi: 10.1001/archoto.2008.510. [DOI] [PubMed] [Google Scholar]
- 14.Berry JG, Hall DE, Kuo DZ, Cohen E, Agrawal R, Feudtner C, Hall M, Kueser J, Kaplan W, Neff J. Hospital utilization and characteristics of patients experiencing recurrent readmissions within children’s hospitals. JAMA. 2011;305:682–690. doi: 10.1001/jama.2011.122. [DOI] [PMC free article] [PubMed] [Google Scholar]
- 15.Cole SR. Analysis of complex survey data using SAS. Comput Methods Programs Biomed. 2001;64:65–69. doi: 10.1016/s0169-2607(00)00088-2. [DOI] [PubMed] [Google Scholar]
- 16.HCUP methods series: calculating Nationwide Inpatient Sample Variances. Report # 2003-2. 2005.
- 17.Lieu TA, Ray GT, Farmer G, Shay GF. The cost of medical care for patients with cystic fibrosis in a health maintenance organization. Pediatrics. 1999;103:e72. doi: 10.1542/peds.103.6.e72. [DOI] [PubMed] [Google Scholar]
- 18.Centers for Medicare and Medicaid Services. Baltimore, MD: https://www.cms.gov/ [Google Scholar]
- 19.Curtis JR, Burke W, Kassner AW, Aitken ML. Absence of health insurance is associated with decreased life expectancy in patients with cystic fibrosis. Am J Respir Crit Care Med. 1997;155:1921–1924. doi: 10.1164/ajrccm.155.6.9196096. [DOI] [PubMed] [Google Scholar]
- 20.Welch HG, Wennberg DE, Welch WP. The use of Medicare home health care services. N Engl J Med. 1996;335:324–329. doi: 10.1056/NEJM199608013350506. [DOI] [PubMed] [Google Scholar]
- 21.Riekert KA, Bartlett SJ, Boyle MP, Krishnan JA, Rand CS. The association between depression, lung function, and health-related quality of life among adults with cystic fibrosis. Chest. 2007;132:231–237. doi: 10.1378/chest.06-2474. [DOI] [PubMed] [Google Scholar]
- 22.Modi AC, Driscoll KA, Montag-Leifling K, Acton JD. Screening for symptoms of depression and anxiety in adolescents and young adults with cystic fibrosis. Pediatr Pulmonol. 2010;46:153–159. doi: 10.1002/ppul.21334. [DOI] [PMC free article] [PubMed] [Google Scholar]
- 23.Smith BA, Modi AC, Quittner AL, Wood BL. Depressive symptoms in children with cystic fibrosis and parents and its effects on adherence to airway clearance. Pediatr Pulmonol. 2010;45:756–763. doi: 10.1002/ppul.21238. [DOI] [PubMed] [Google Scholar]
- 24.Goldbeck L, Besier T, Hinz A, Singer S, Quittner AL. Prevalence of symptoms of anxiety and depression in German patients with cystic fibrosis. Chest. 2010;138:929–936. doi: 10.1378/chest.09-2940. [DOI] [PubMed] [Google Scholar]
- 25.Opotowsky AR, Siddiqi OK, Webb GD. Trends in hospitalizations for adults with congenital heart disease in the U. S J Am Coll Cardiol. 2009;54:460–467. doi: 10.1016/j.jacc.2009.04.037. [DOI] [PubMed] [Google Scholar]