Abstract
Amplification of 3q26.2, found in many cancer lineages, is a frequent and early event in ovarian cancer. We previously defined the most frequent region of copy number increase at 3q26.2 to EVI1 (ecotropic viral integration site‐1) and MDS1 (myelodysplastic syndrome 1) (aka MECOM), an observation recently confirmed by the cancer genome atlas (TCGA). MECOM is increased at the DNA, RNA, and protein level and likely contributes to patient outcome. Herein, we report that EVI1 is aberrantly spliced, generating multiple variants including a Del190–515 variant (equivalent to previously reported) expressed in >90% of advanced stage serous epithelial ovarian cancers. Although EVI1Del190–515 lacks ∼70% of exon 7, it binds CtBP1 as well as SMAD3, important mediators of TGFβ signaling, similar to wild type EVI1. This contrasts with EVI1 1–268 which failed to interact with CtBP1. Interestingly, the EVI1Del190–515 splice variant preferentially localizes to PML nuclear bodies compared to wild type and EVI1Del427–515. While wild type EVI1 efficiently repressed TGFβ‐mediated AP‐1 (activator protein‐1) and plasminogen activator inhibitor‐1 (PAI‐1) promoters, EVI1Del190–515 elicited a slight increase in both promoter activities. Expression of EVI1 and EVI1Del427–515 (but not EVI1Del190–515) in OVCAR8 ovarian cancer cells increased cyclin E1 LMW expression and cell cycle progression. Furthermore, knockdown of specific EVI1 splice variants (both MDS1/EVI1 and EVI1Del190–515) markedly increased claudin‐1 mRNA and protein expression in HEY ovarian and MDA‐MB‐231 breast cancer cells. Changes in claudin‐1 were associated with alterations in specific epithelial–mesenchymal transition markers concurrent with reduced migratory potential. Collectively, EVI1 is frequently aberrantly spliced in ovarian cancer with specific forms eliciting altered functions which could potentially contribute to ovarian cancer pathophysiology.
Keywords: EVI1, Ovarian cancer, TGFβ, Splice variants, Claudin-1, EMT, Cyclin E1, Motility
Highlights
-
►
Similar to wild type, EVI1Del190–515 splice variant is elevated in ovarian cancers.
-
►
EVI1Del190–515 retains binding to SMAD3/CtBP1 with increased PML co‐localization.
-
►
EVI1Del190–515 differentially modulates TGFβ‐mediated PAI‐1 promoter activity.
-
►
Wild type EVI1 and EVI1Del427–515 similarly modulate cyclin E1 in OVCAR8 cells.
-
►
siRNA targeting both MDS1/EVI1 and EVI1Del190–515 alters claudin‐1 and motility.
1. Introduction
EVI1, originally identified as a site for ecotropic viral integration in animal tumorigenesis models, and its neighboring gene MDS1 which can form a fusion readthrough protein (MECOM) have been implicated with oncogenic function by being frequent fusion gene partners with AML1 in acute myeloid leukemia (AML) and myelodysplastic syndrome (MDS) (Levy et al., 1994; Morishita et al., 1992b). EVI1 is also involved in the proliferation of leukemic cells (Mitani et al., 1995), transformation (Kilbey and Bartholomew, 1998), and inhibition of growth factor‐mediated differentiation and survival (Morishita et al., 1992a). We (Nanjundan et al., 2007) as well as others (Sunde et al., 2006) have implicated EVI1 in solid tumor development, specifically ovarian tumorigenesis. EVI1 is located on chromosome 3q26, (located telomeric to MDS1) which is amplified as a frequent and early event in a number of epithelial cancers including ovarian cancers (tcga‐data.nci.nih.gov/) (Beroukhim et al., 2010). We have previously demonstrated using high‐resolution array comparative genomic hybridization (CGH) that EVI1 is located at the most frequent point of genomic amplification at 3q26.2 in advanced stage serous epithelial ovarian cancers (Nanjundan et al., 2007). According to TCGA data (tcga‐data.nci.nih.gov/), MECOM is frequently altered in human cancers including 35% of lung squamous, 20% of ovarian and cervical, 14% of endometrial, and a lower frequency in a wide range of cancers. In most cases, the aberration is primarily amplification of 3q26.2; however, mutations are relatively common in bladder, colon, and uterine cancers (tcga‐data.nci.nih.gov/). MECOM is amplified in 20% of ovarian cancers with mutation in less than 1% of cases. We demonstrated that the DNA copy number increase at 3q26.2 in ovarian cancer is associated with a marked accumulation of a MDS1/EVI1 intergenic “read‐through” or splice transcript (Nanjundan et al., 2007) (Figure 1A). Recently, gains in 3q26.2 with associated increased EVI1 transcripts were correlated with chemotherapeutic resistance in ovarian cancer (Osterberg et al., 2009), supporting a functional relevance of MECOM in ovarian cancer.
Figure 1.
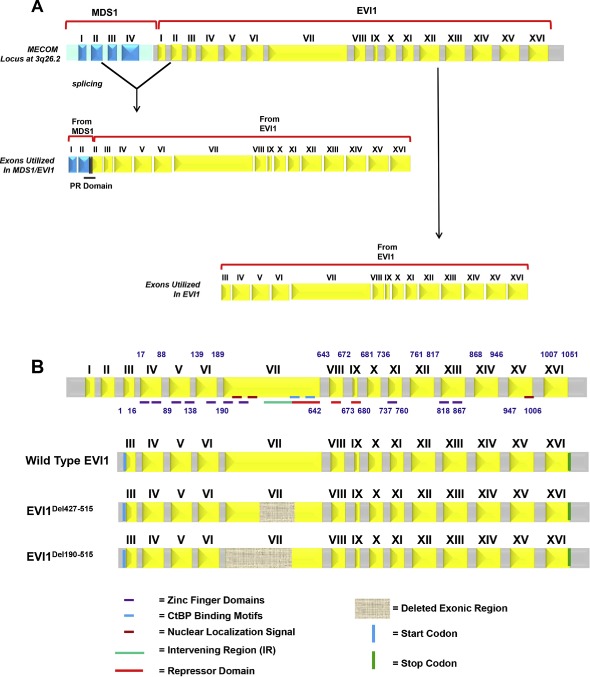
Identification of aberrant EVI1 splice forms in ovarian cancers. (A) Schematic representation of the MECOM locus displaying generation of the MDS1/EVI1 and EVI1 splice forms. MDS1 is composed of 4 exons whereas EVI1 is composed of 16 exons. MDS1/EVI1 is comprised of Exon I and II from MDS1 as well as Exon II – XVI from EVI1. EVI1 is comprised of Exon III to Exon XVI. (B) Various aberrant splice forms identified in ovarian cancer patients are shown. Exon arrangement of EVI1 (16 exons) with the various zinc finger regions, CtBP1 binding motif, repressor domain, potential nuclear localization signals (NLS), as well as start and stop codon are indicated. Regions that were found to be deleted in the splice variants identified are indicated by hatched boxes in Exon VII. (C) A sequence chromatogram for EVI1Del190–515 is shown on the left panel and the vertical line denotes the Exon VI to the cryptic internal region of Exon VII splice junction site compared to the wild type EVI1 sequence chromatograms where the vertical line denotes the Exon VI to Exon VII splice junction. The right panel depicts the exon arrangement of EVI1Del190–515 showing the donor splice site and the cryptic acceptor splice site resulting in loss of a region containing a portion of the repressor domain and the SMAD2/3 binding site. (D) A sequence chromatogram for EVI1Del427–515 is shown on the left panel and the vertical line denotes the internal cryptic donor site in internal region of Exon VII to cryptic acceptor site in internal region of Exon VII compared to the wild type EVI1 sequence chromatograms where the vertical line shows the wild type Exon VII read‐through sequence. The right panel depicts the exon arrangement of EVI1Del427–515 showing the cryptic donor splice site and cryptic acceptor splice site resulting in loss of a region containing partial of the repressor domain and the SMAD2/3 binding site.
Figure 1.
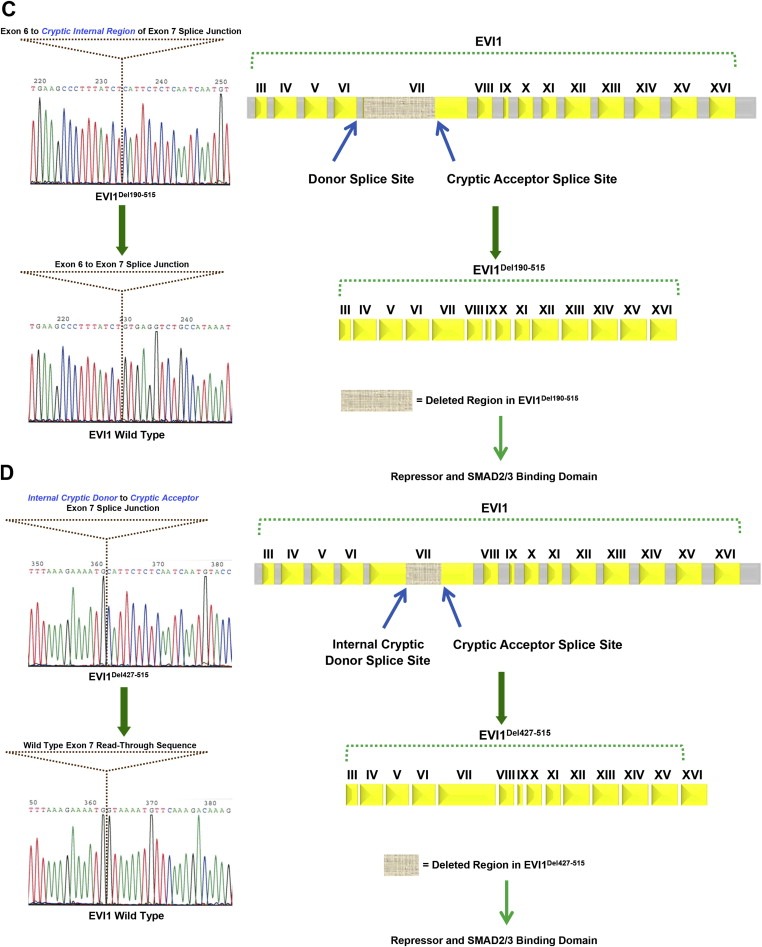
(continued).
In addition to the MDS1/EVI1 splicing variant, EVI1 has been reported to be alternatively spliced at the 5′‐termini as well as to contain an internal deletion of 324 amino acids (Δ324), which encodes a protein lacking a portion of the zinc finger domain 1 and the intervening amino acids 239–514 (IR – intervening region) and has been shown to repress transformation of Rat1 fibroblasts (Alzuherri et al., 2006; Aytekin et al., 2005; Kilbey and Bartholomew, 1998). A splice variant, EVI1s (equivalent to Δ324), was recently identified in ovarian cancer specimens (Jazaeri et al., 2010). In addition, alternative splicing can lead to C‐terminal deletion of 105 amino acids in murine but not human EVI1 (Alzuherri et al., 2006; Aytekin et al., 2005; Kilbey and Bartholomew, 1998); the function of this variant is presently unclear.
Herein, we report that there is a high frequency of aberrant splicing of EVI1 generating novel splice forms, EVI1Del190–515 (equivalent to Δ324/EVI1s) and EVI1Del427–515 (to a lesser extent), in advanced stage serous ovarian epithelial cancers. The patterns of localization of each of these EVI1 splice variants to nuclear speckles and binding to CtBP1 and SMAD3 are similar. However, EVI1Del190–515 differed markedly from wild type EVI1 in terms of gene transcription and localization to PML nuclear subdomains. Although the overall pattern of TGFβ‐mediated signaling effects were similar between T29 cells (derived from normal epithelium) and OVCAR8 cancer cells, we identified changes in signaling pathways following expression of EVI1 splice variants to levels expressed in patient samples that were more marked in OVCAR8 cancer cells. Cyclin E1 LMW and cell cycle progression was increased upon EVI1 wild type and EVI1Del427–515 expression in contrast to EVI1Del190–515 (Δ324/EVI1s) which did not alter cyclin E levels. We also now demonstrate that certain splice forms of EVI1 modulate EMT in ovarian and breast cancer cell lines by regulating claudin‐1 expression (located at 3q28). In particular, knockdown of both EVI1Del190–515 and MDS1/EVI1 dramatically increases claudin‐1 mRNA and protein concurrent with changes in EMT markers and cellular motility. These studies indicate that EVI1 is frequently aberrantly spliced in ovarian cancer with altered functions which could potentially contribute to ovarian cancer pathophysiology.
2. Materials and methods
2.1. Preparation of patient samples
Stage I–IV serous epithelial ovarian cancers (OVCA) were obtained (Ovarian Cancer Tumor Bank, MD Anderson Cancer Center). Benign ovarian tumors and stage III/IV serous epithelial ovarian cancers were also obtained (Basic Biology of Ovarian Cancer Program Project Grant Bank Tissue and Pathology Core at the University of California San Francisco). Normal ovarian epithelial scrapings (OSE) were obtained (Northwestern University) and benign ovarian cysts were macrodissected as previously described (Nanjundan et al., 2007). All cancer samples were selected to contain greater than 70% tumors. Where necessary, early stage and late stage ovarian cancers were macrodissected to contain greater than 70% tumor. EVI1 and MDS1/EVI1 RNA levels in these tumors have been reported previously (Nanjundan et al., 2007). Total RNA was extracted using the RNeasy Kit (Qiagen, Valencia, CA). Institutional Review Board approval had been obtained at each participating institution prior to the initiation of this study.
2.2. Cell culture
Large T antigen/telomerase (LTg/hTERT) immortalized normal ovarian surface epithelial cells (T29 and T80), OVCAR8, HEY, MDA‐MB‐231 cells (obtained from ATCC, VA, USA) were cultured in RPMI 1640 supplemented with 8% FBS and penicillin/streptomycin. HMEC were grown in Mammary Epithelial Basal Medium with the addition of Bulletkit (Cambrex, NJ, USA). All cells were maintained in a 37 °C humidified incubator containing 95% air and 5% CO2.
2.3. Quantitative PCR analysis
Quantitative PCR was performed using RNA isolated from normal, benign, and OVCA (stage I to IV) patient samples and one‐step RT‐PCR Taqman master mix (Applied Biosystems, CA, USA) with the following custom‐designed primers and probe sets:
EVI1 (Exon VII, detects wild type EVI1 forms): Forward primer, CCTCATGACACATCCTCAGATACTG; Reverse primer, GATGGGTGTTTAGATAGTGAATTCA; and the probe sequence is: CCAGCTACACAGGATATT.
EVI1Del190–515 (detects EVI1Del190–515): Forward primer, AGCACATCCACAGCAGTGT; Reverse primer, TCAAGTCTC‐TATCAGGAAATGGGTACA; and the probe sequence is: AAGCCCTTTATCTCATTCTC.
EVI1Del427–515 (detects EVI1Del427–515): Forward primer, GCTCTGATCTGGAAAGTGACATTGAA; Reverse primer, TCAA‐GTCTCTATCAGGAAATGGGTACA; and the probe sequence is: ATTGAGAGAATGCATTTTC.
Quantitative PCR was also performed using assays‐on‐demand primers and probe sets including: Snail (Hs00195591), Slug (Hs00950344), Zeb1 (Hs00232783), Zeb2 (Hs00207691), N‐Cadherin (Hs00983056), E‐Cadherin (Hs01023894), Claudin 1 (Hs00221623), and Twist (Hs00361186).
Using the correlative method, RNA‐fold increase in expression was calculated as Ct of gene – Ct of β‐actin to generate delta Ct from which delta Ct of the normal sample was subtracted. These values were then converted to log2 values. Absolute RNA levels of wild type EVI1 (using Exon VII probe) and Del190–515 were determined using plasmid DNA for wild type EVI1 and EVI1 Del190–515 to generate standard curves.
2.4. miRNA isolation and quantitative PCR for miRNA
Total RNA isolation was carried out according to the manufacturer's protocol, provided with the mirVana miRNA isolation kit (Life Technologies, CA, USA). The TaqMan miRNA probe‐based reverse transcriptase PCR reaction was followed according to manufacturer's protocol (MicroRNA Assays, Applied Biosystems, CA, USA). Relative miRNA levels were determined using the correlative method.
2.5. RT‐PCR cloning and plasmid construction
Full length EVI1, zinc finger deletion mutant 1–7 (Zn Del 1–7), and zinc finger deletion mutant 8–10 (Zn Del 8–10) constructs were kindly provided by Dr. Hisamaru Hirai (Kurokawa et al., 1998) and Dr. Mineo Kurokawa (Kurokawa et al., 1998). RT–PCR was performed on RNA isolated from Stage I–IV ovarian cancer patients as well as RNA isolated from ovarian cell lines isolated by Trizol method. One‐step RT‐PCR (Invitrogen, NY, USA) for long fragments (3 kb–10 kb) was used to amplify EVI1, splice variants (EVI1Del190–515 and EVI1Del427–515), and deletion mutant PCR products (Zn Del 1–7, Zn Del 8–10, and EVI1 1–268), which were gel purified, cloned into pTOPO‐XL vector, and sequenced. EcoRI was used to release the full‐length insert and used for ligation into pEGFP‐C1 and pLEGFP‐C1 vectors for functional expression studies. All constructs were sequenced prior to use. The following primers were used for RT‐PCR to amplify EVI1: EVI1 forward primer: 5′‐CGG AAC AAG GGC CAC CAT GAA GAG CGA AGA CTA TC; EVI1 reverse primer: 5′‐TGA GTC AAG GGT CAT ACG TGG CTT ATG GAC.
2.6. Co‐immunoprecipitation of CtBP1 and SMAD3 with EVI1 and splice/mutant forms
To assess co‐immunoprecipitation of CtBP1 with EVI1 forms, T29 cells were transiently transfected by nucleofector method with control pEGFP‐C1 or EVI1 forms fused with EGFP (wild type EVI1, EVI1Del427–515, EVI1Del190–515, EVI1 Zn Del 1–7, EVI1 Zn Del 8–10, and EVI1 1–268). Twenty four hours post transfection, cell lysates were prepared and incubated with rabbit polyclonal GFP antibody (Clontech, CA, USA) for 4 h at 4 °C followed by 1 h incubation with protein G Sepharose beads. The bead‐complex was washed twice with lysis buffer and phosphate‐buffered saline (PBS) and analyzed by SDS‐PAGE. To assess co‐immunoprecipitation of SMAD3 with EVI1 forms, T29 cells were transiently transfected with SMAD3‐FLAG (a kind gift from Dr. Rik Derynk, UCSF). Twenty four hours post transfection, cell lysates were prepared and incubated with FLAG‐M2 antibody (Sigma, MO, USA) for 4 h at 4 °C followed by 1 h incubation with protein G Sepharose beads. The bead‐complex was washed twice with lysis buffer and PBS and analyzed by SDS‐PAGE. As immunoprecipitation control, cell lysates from vector only transfected T29 cells were subjected to immunoprecipitation of FLAG in order to assess background binding of EVI1 to SMAD3‐FLAG.
2.7. Transcriptional assays
Nucleofector transfection (Amaxa, MD, USA) was performed in T29 cells with EVI1, EVI1Del427–515, or EVI1Del190–515 (5 μg) in combination with p(CAGA)12‐Lux, a reporter gene containing 12 repeats of Smad binding sequences from the PAI‐1 promoter (obtained from Dr. Carlos Arteaga (Vanderbilt University)) (1 μg), or the AP‐1 cis‐reporter plasmid (Stratagene, CA, USA) using Renilla luciferase to normalize (0.05 μg). Cells were re‐seeded 6 h post‐transfection, allowed to adhere for 6 h, and serum starved/treated with 50 pM TGFβ (Calbiochem, MA, USA), which was chosen as being on the linear portion of the dose response curve. The following day (24 h post‐transfection), cells were harvested in passive lysis buffer and assessed for luciferase activity using Dual Luciferase Assay kit (Promega, WI, USA).
2.8. Direct and indirect immunofluorescence microscopy
T29 cells were nucleofector transfected with EVI1 variants fused with EGFP control using the pEGFP‐C1 vector (Invitrogen, NY, USA) and plated onto glass coverslips for 24 h. The cells were then fixed in 4% paraformaldehyde in PBS for 30 min at room temperature, washed twice in PBS, and blocked for 1 h at room temperature in PBS containing 5% goat serum and 0.1% Triton X‐100. Primary antibodies (PML, sc‐35, and CtBP1 were used at 1:1000 dilution) were incubated in PBS containing 1% goat serum and 0.1% Triton X‐100 overnight at 4 °C. The cells were washed 3 times for 5 min in PBS and then incubated with the appropriate cy3‐fluorescent conjugated antibody for 1 h in PBS containing 1% goat serum and 0.1% Triton X‐100. The cells were washed 3 times for 5 min in PBS, mounted onto glass slides, and viewed under a fluorescence microscope.
2.9. Retrovirus production, infection of T29 and OVCAR8 cells, and generation of EVI1 splice variant retroviral cell lines
Retrovirus was produced in 293T packaging cells seeded at a density of 2 million cells in 6 well plates. The following day, cells were transfected by Fugene HD with an equal ratio of pCGP and pVSVG plasmids with empty pLEGFP‐C1 vector or that containing an EVI1 variant (1:1:1). The following day, the media was changed and virus was collected at 48 and 72 h post‐transfection. T29 as well as OVCAR8 ovarian carcinoma target cells were plated in 6 well plates at 40% confluency and infected twice (24 h apart) with virus:media (1:1) in polybrene (8 μg/ml–16 μg/ml, respectively). Following cell passaging, cells were selected with G418 (1 mg/ml for T29 and 0.1 mg/ml for OVCAR8 cells) to select for EVI1 and variant expressing cells. Parental cell populations (from two independent infections) were utilized for the functional analyses. Cell lines were then assessed for RNA expression (qPCR) and protein expression (western analysis).
2.10. Knockdown using siRNA targeting EVI1 splice forms in HEY and MDA‐MB‐231 cells
The siRNA transfection method was followed according to our previously published studies (Smith et al., 2010). We utilized non‐targeting control siRNA (D‐001810‐10) (ThermoScientific, PA, USA) and siRNA targeting EVI1 splice variants designed according to published reports (Jazaeri et al., 2010).
2.11. Protein isolation
Cells were lysed in buffer (1% Triton X‐100, 50 mM HEPES, 150 mM NaCl, 1 mM MgCl2, 1 mM EGTA, 10% glycerol, and protease inhibitor cocktail (Roche, WI, USA)) for 1 h at 4 °C. Lysates were harvested and centrifuged at 14,000 rpm for 10 min at 4 °C. Quantification of total protein was performed using the Bicinchoninic Acid assay (Fisher Scientific, PA, USA) and samples were then normalized to a minimum concentration of 1 mg/ml.
2.12. Triton X‐100 soluble and insoluble fractionation
HEY and MDA‐MB‐231 cells were seeded at 325,000 cells or 1 million cells, respectively, in each well of a 6‐well plate. Cells were washed and harvested in phosphate‐buffered saline (PBS). Samples were centrifuged at 1,000 rpm for 5 min at room temperature followed by resuspension of the cell pellet in buffer (50 mM Tris–HCl (pH 7.3), 150 mM NaCl, 3 mM MgCl2, 1 mM DTT, 1 mM EDTA, 1 mM EGTA, 1% Triton X‐100, 300 mM sucrose, and protein inhibitor cocktail). Cells were incubated for 20 min at 4 °C followed by centrifugation at 15,000 g for 30 min at 4 °C. The supernatant, Triton X‐100 soluble fraction, was retained. The pellet, Triton X‐100 insoluble fraction, was washed with the above‐described lysis buffer followed by the addition of 5% SDS sample buffer. This fraction was then heated at 95 °C for 10 min.
2.13. SDS‐PAGE and western blot analyses
Proteins were resolved on appropriate percentage SDS‐PAGE gels (8, 10, or 12%) and transferred to polyvinylidene difluoride (PVDF) membranes. Briefly, membranes were blocked with 5% (w/v) milk, incubated overnight with primary antibody, incubated for 1 h with appropriate horseradish peroxidase‐conjugated secondary antibodies, and developed using chemiluminescence substrates. Polyclonal EVI1 antibodies were from Dr. James Ihle (Morishita et al., 1990) and from Cell Signaling Technology (#2593). Antibodies against cyclin E1 (HE‐12, mouse monoclonal) were from Santa Cruz Biotechnology (CA, USA). Antibodies against GFP were from Clontech (rabbit polyclonal) as well as from Santa Cruz Biotechnology (mouse monoclonal). Antibodies against FLAG (clone M2, monoclonal antibody) were from Sigma. CtBP1 mouse monoclonal antibodies (#612042) were obtained from BD Bioscience (CA, USA). PML mouse monoclonal antibodies (#sc‐966) were obtained from Santa Cruz Biotechnology.
2.14. Reverse phase protein arrays (RPPA)
T29 and OVCAR8 retrovirally infected cells expressing wild type EVI1, EVI1Del427–515, EVI1Del190–515, and control were treated with 50 pM TGFβ across a series of time points including 5 min, 1 h, 3 h, 6 h, and 24 h. Protein lysate was prepared from the retrovirally infected OVCAR8 and T29 cell populations using lysis buffer (1% Triton X‐100, 50 mM HEPES [pH 7.4], 150 mM NaCl, 1.5 mM MgCl2, 1 mM EGTA, 100 mM NaF, 1 mM Na3VO4, 10% glycerol) followed by 1 h incubation at 4 °C. Cell lysates were cleared by centrifugation at 14,000 rpm for 10 min. Protein quantification was performed by Bicinchoninic Acid assay. All samples were normalized to 1 mg/ml.
The RPPA was performed as previously described (Nanjundan et al., 2010). Briefly, protein lysate arrays were printed using an Aushon arrayer on nitrocellulose‐coated glass FAST Slides. Antibody staining of each array was performed using an automated Dako autostainer. Details for antibody optimization and validation can be found in Tibes et al. (2006). The primary antibodies were validated in the key signaling pathways via western blotting. Supercurve method was used to quantify RPPA data and processed as previously described (Nanjundan et al., 2010).
2.15. Cell cycle analysis
Cells grown in T25 flasks were pelleted by first trypsinizing the cells followed by resuspension in PBS and dropwise addition to 70% ethanol. Cells were then stained with propidium iodide/Triton X‐100/DNAse‐free RNAse A solution. Samples were analyzed by flow cytometry (College of Medicine, University of South Florida).
2.16. Cell migration
OVCAR8, HEY, and MDA‐MB‐231 (25,000 cells) were trypsinized, counted, and seeded into Boyden chamber inserts (BD Biosciences, San Jose, CA) in serum‐free media. FBS was utilized in the lower chamber as the chemoattractant. The migrating cells (on the lower membrane) were stained with crystal violet, photographed, and counted.
2.17. Statistical analyses
The number of replicates conducted for each experiment is indicated in the figure legends. Error bars displayed on the bar graphs represent standard deviations. Data represented in tabular format (Figure 5D) are displayed as averages ± standard deviations. P‐values were determined according to student's T‐test (* refers to p < 0.05; ** refers to p < 0.01; *** refers to p < 0.0001). Western blots were analyzed by densitometric analyses using Image J program (Image Processing and Analysis in Java, NIH Image Software, http://rsb/info/nioh/gov.ij/).
Figure 5.
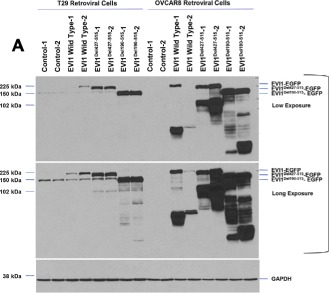
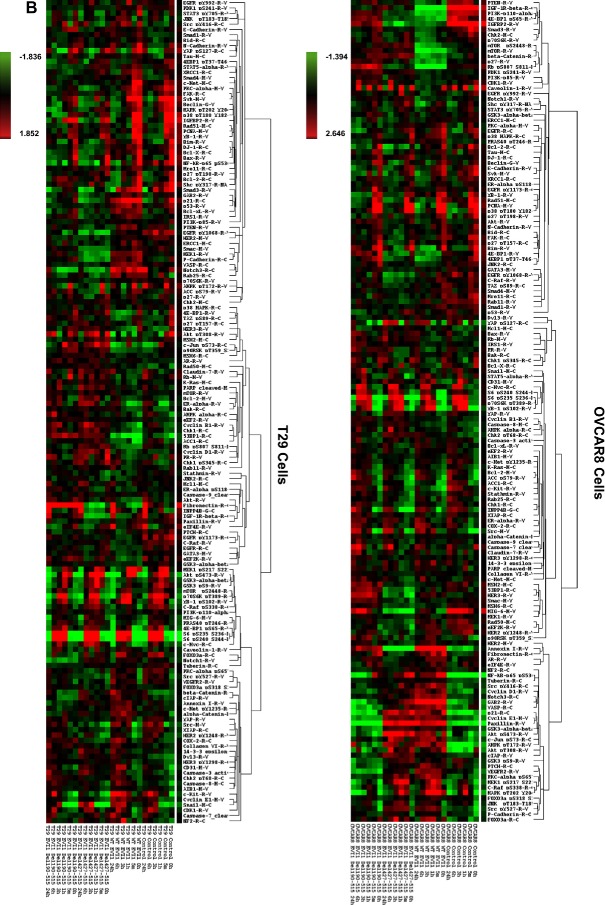
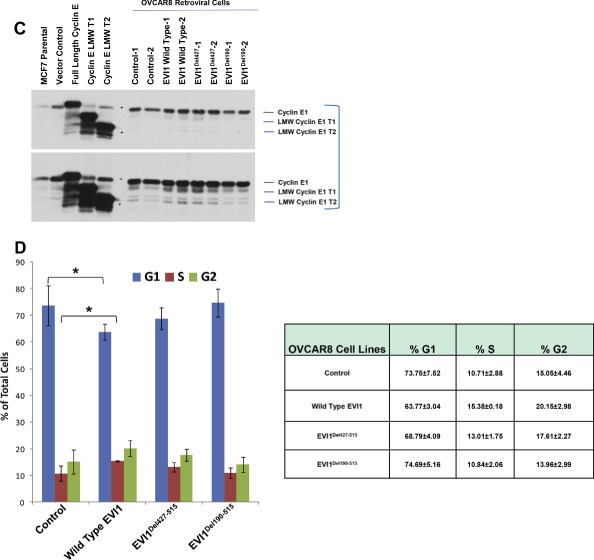
High expressing EVI1 and EVI1Del427–515 modulate cyclin E1 expression. (A) Western analyses is shown from lysates isolated from overexpressed EVI1 splice variants in T29 and OVCAR8 cells (retrovirally infected to generate two independent parental cell populations). (B) Reverse phase protein array results displayed as heatmaps with T29 (left panel) and OVCAR8 (right panel). (C) Western analysis of cyclin E1 levels in OVCAR8 retroviral cell lines together with positive controls in MCF7 cells overexpressing full length cyclin E1, cyclin E1 LMW T1, and cyclin E1 LMW T2. (D) Cell cycle analyses results are shown graphically (left panel) and in tabular format (right panel) as a combination of two independent experiments.
3. Results
3.1. Identification and quantitation of EVI1 splice forms in serous epithelial ovarian cancers
We previously reported that EVI1 and to a greater extent, MDS1/EVI1, are elevated in advanced stage serous epithelial ovarian cancers at the DNA, RNA, and protein levels (Nanjundan et al., 2007). Further, we observed that increased DNA copy number of the peak amplification at 3q26.2 and increased RNA levels for MDS1/EVI1 were correlated with favorable patient prognosis in contrast to increased RNA for EVI1, which was correlated with worsened patient outcomes (Nanjundan et al., 2007). Although EVI1 and MDS1/EVI1 appeared to be functionally similar, we addressed whether there may exist additional aberrant splice forms of EVI1 that could contribute to the observed functional responses and patient outcomes (Nanjundan et al., 2007). Indeed, a number of alternative splice forms of EVI1 including transcripts with variation in the 5′‐ends (Aytekin et al., 2005), a Δ324 (EVI1s) EVI1 splice form (Jazaeri et al., 2010; Kilbey and Bartholomew, 1998), as well as a C‐terminal deletion (Δ105) (Alzuherri et al., 2006) have been identified.
Based on the potential that alternate or aberrant splicing and/or mutation of MDS1/EVI1 or EVI1 could contribute to altered functions and patient outcomes, we performed RT‐PCR and sequencing using primers designed against exon III and exon XVI that amplified EVI1 from both MDS1/EVI1 and EVI1 (see Figure 1B). We analyzed 117 transcripts from 3 ovarian cancer cell lines, normal ovarian epithelial cells (including HMEC, a normal human mammary epithelial cell line), and 15 advanced stage serous epithelial ovarian cancers isolated directly from the patient. Sequencing demonstrated the presence of multiple aberrant transcripts in all patient samples analyzed. In particular aberrant splicing of exon VII (Del190–515 and Del427–515) was common with the Del190–515 form being the dominant alternately spliced transcript. Of the 117 transcripts, 12% were wild type, 16% were EVI1Del427–515, 60% were EVI1Del190–515 forms, and the remainder were a composition of rarer forms (Supplementary Figure 1). In particular, EVI1Del190–515 was identified in all stages of ovarian cancer (stage I, stage II, stage III, stage IV) as well as normal and malignant ovarian cell lines (T29 and SKOV3 cells). EVI1Del190–515 results from the donor site at the end of exon VI and the use of a cryptic splice acceptor site within exon VII (Figure 1C). The protein product of this splice would lack zinc fingers 6 and 7 of the 1st zinc finger domain and the intervening repressor domain (Kilbey and Bartholomew, 1998) implicated in EVI1 function (Figure 1C). EVI1Del427–515 is generated by splicing from an internal cryptic splice donor site within exon VII and an internal cryptic splice acceptor site within exon VII (Figure 1D).
To determine the potential relevance of the cryptic splice sites of EVI1 in ovarian cancer pathophysiology, we created qPCR probes specific to novel sequences in the two splice variants as well as wild type EVI1 similar to our previously used approach to quantitate MDS1/EVI1 and EVI1 (Nanjundan et al., 2007). It is important to note that the probes do not distinguish between EVI1 and MDS1/EVI1 (Figure 2A). Using immortalized normal ovarian epithelial cells (T29), which have low levels of endogenous EVI1 transcripts, we assessed the specificity of these probes by transfecting expression constructs containing wild type EVI1, EVI1Del190–515, as well as EVI1Del427–515. As shown in Figure 2A, the qPCR probes detect each of the splice forms with high specificity. Thus, these probes can distinguish between EVI1Del190–515, EVI1Del427–515, and wild type EVI1 (exon VII).
Figure 2.
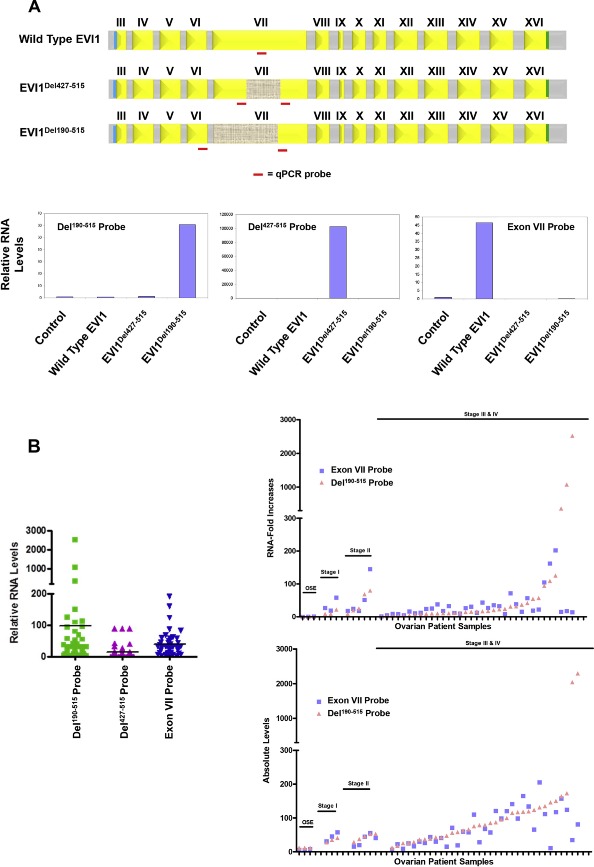
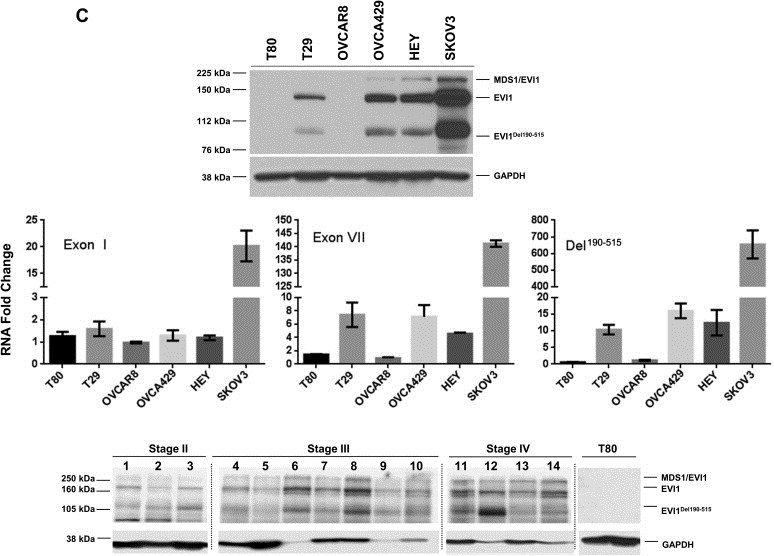
Increased EVI1Del190–515 splice variant in advanced stage serous epithelial ovarian cancers. (A) The location of the qPCR probes specific for wild type EVI1, EVI1Del427–515, and EVI1Del190–515 are shown (top panel). Validation of the custom‐made qPCR probes was performed using RNA isolated from stable retrovirally infected T29 cells with control pLEGFP‐C1, wild type EVI1 EGFP, EVI1Del190–515 EGFP, or EVI1Del427–515 EGFP (bottom panels). (B) Measurement of wild type EVI1, EVI1Del190–515, and EVI1Del427–515 in serous epithelial ovarian cancers was performed by qPCR with the specific qPCR probes/primers. Results are expressed as RNA fold increases relative to normal ovarian surface epithelium (OSE) (left panel). In the top right panel, the same data is presented but ungrouped to indicate stage I, stage II, stage III, and stage IV serous epithelial ovarian cancers as well as relative expression changes in individual cancers. The bottom right panel represents the absolute RNA quantitation of wild type EVI1 (using Exon VII probe) and Del190–515 for OSE, stage I, stage II, stage III, and stage IV ovarian serous epithelial carcinomas. (C) Western analysis of ovarian cell lines (T80, T29, OVCAR8, OVCA429, HEY, and SKOV3 cells) using a rabbit polyclonal antibody against EVI1 detecting multiple forms of EVI1 including Del190–515 (upper panel). Real‐time PCR analyses of EVI1 splice forms in the ovarian cell lines (middle panel). Western analysis of various stages of ovarian cancer (stage II, stage III, and stage IV serous epithelial ovarian cancers) using a rabbit polyclonal EVI1 antibody (generated by Dr. James Ihle). Irrelevant lanes were deletes as marked in gray dotted vertical lines (bottom panel).
Figure 2.
(continued).
Next, we assessed the mRNA transcript levels in patient specimens of wild type EVI1 (Exon VII) probe, as well as the splice variants, EVI1Del190–515 and EVI1Del427–515, using normal ovarian surface epithelium (OSE) as a comparator for each of the probes. Based on the qPCR analysis, EVI1Del190–515 is increased with greater frequency (>90% using 5‐fold as cut off) and to greater levels in ovarian cancer (>than 50‐fold) than other EVI1 transcripts in serous epithelial advanced stage ovarian cancers as compared to normal ovarian surface epithelium (OSE) (Figure 2B, left panel). In contrast, the EVI1Del427–515 splice variant was increased to a far lesser extent (p < 0.001) in advanced stage serous epithelial ovarian cancers compared to normal epithelium (Figure 2B (left panel), the transverse line indicates average). There was no significant difference between levels of wild type EVI1 and EVI1Del190–515 transcripts; however, a subset of cancers had a greater increase in EVI1Del190–515 (Figure 2B, top right panel). These observations are also consistent with absolute transcript levels which demonstrate that wild type EVI1 and EVI1Del190–515 are increased to similar levels in most tumors, with a subpopulation having greater increase in EVI1Del190–515 (see Figure 2B, bottom right panel).
As indicated in Figure 2C (top and middle panel), we also observe bands at the expected molecular weight in a number of ovarian cell lines by western blotting (as reported in our earlier manuscript (Nanjundan et al., 2007)). In particular, we observed appropriate size bands in a series of ovarian cancer cell lines, which were absent in OVCAR8, which has a deletion of the EVI1 gene and T80 which has low levels of EVI1 RNA. Thus, EVI1Del190–515 is translated into a protein that could contribute to the pathophysiology of ovarian cancers. As shown in Figure 2C (bottom panel), we observe multiple splice variants of EVI1 across the various stages of serous epithelial ovarian cancers. Although the numbers of early stage ovarian cancers are relatively low, there appears to be a relative increase in EVI1Del190–515 and wild type EVI1 as tumors progress. While transcript levels of EVI1Del190–515 and wild type EVI1 are elevated in the majority of advanced ovarian cancers, the increase in EVI1Del190–515 and wild type EVI1 are markedly different in a subset of patient samples (Figure 2C) suggesting that splicing and transcriptional levels can be differentially regulated. Moreover, the relative expression pattern of the various EVI1 forms is quite variable amongst the different patients. The EVI1Del190–515 form is markedly expressed in patient 3 and patient 12. MDS1/EVI1 is generally of lower expression relative to EVI1 and EVI1Del190–515 although the antibody may bind selectively to particular isoforms. In patient 1 and 4, EVI1 and EVI1Del190–515 levels are equivalent. Patient 6 and 8 have the highest expression of EVI1 wild type. Thus, the pattern of EVI1 splice forms appears to be quite heterogenous and variable relative to each other in patient specimens.
3.2. Altered localization of EVI1Del190–515 splice variant to PML domains in ovarian cells
The generation of aberrantly spliced forms of proteins in diseases including cancer may affect protein localization and thus, functional consequences. We next investigated whether the EVI1Del190–515 splice variant may have aberrant or altered localization through which it could possibly alter functional outcomes. We first assessed the localization in T29 cells (with low endogenous EVI1) of the identified splice variants as well as engineered deletions [deletion of the first 7 zinc fingers (Zn Del 1–7), zinc finger 8–10 (Zn Del 8–10), and EVI1 1–268 which contains only the first zinc finger region] in order to identify the regions of EVI1 that may be important for appropriate localization. We expressed these EVI1 forms as EGFP‐fusion proteins (as shown in Figure 3A), with expression verified using antibodies targeting GFP and EVI1 (top and bottom panels, respectively). The N‐terminal EVI1 antibody recognizes wild type EVI1, EVI1Del427–515, EVI1Del190–515, EVI1 Del Zn 8–10, as well as EVI1 1–268 but not EVI1 Del Zn 1–7; in contrast, the mouse monoclonal GFP antibody detected the expression of all EVI1 splice forms and deletion constructs.
Figure 3.
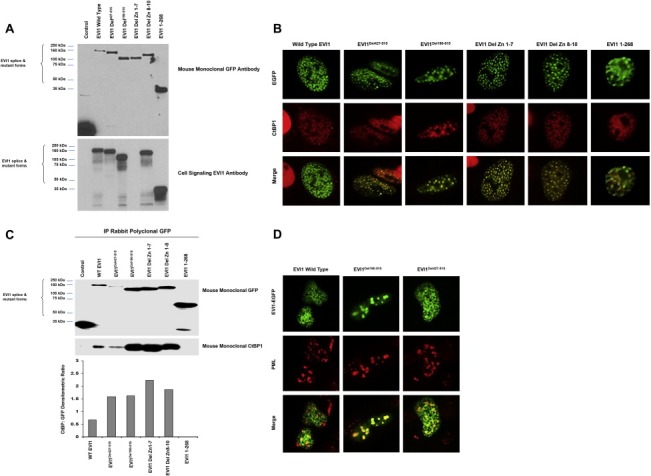
EVI1Del190–515 binds CtBP1 and SMAD3 with increased localization to PML nuclear subdomains in ovarian cells. (A) Western analysis of transient overexpression of EGFP fusion proteins of wild type EVI1, EVI1Del427–515, EVI1Del190–515, EVI1 Zn Del 1–7, EVI1 Zn Del 8–10, and EVI1 1–268 (expressing amino acids 268) mutants in T29 cells was performed using GFP mouse monoclonal antibody (top panel) and an N‐terminal EVI1 antibody (bottom panel). (B) Localization of EVI1 and splice/deletion forms in T29 cells by immunofluorescence staining for CtBP1. (C) Co‐immunoprecipitation of CtBP1 with EGFP‐tagged EVI1 was performed using an anti‐GFP polyclonal antibody with lysates from cells expressing EVI1 and deletion/mutant EVI1 forms (as EGFP fusions) followed by western blotting analyses using monoclonal antibody against GFP and CtBP1 monoclonal antibodies. (D) Overexpression of PML4 and EVI1 splice variants in T29 cells and immunofluorescence staining for PML4.
EVI1 has been reported as a predominantly nuclear localized protein (Matsugi et al., 1990). Thus, we assessed whether the aberrant splice variants of EVI1 (expressed as EGFP‐fusions) may have altered localization. As shown in Figure 3B, in addition to wild type EVI1, the splice variants (EVI1Del190–515 and EVI1Del427–515) as well as all mutants localized to the nucleus. However, we noted that several of the deletion mutants and splice variants had a greater tendency to localize into nuclear speckles or nuclear subdomains, in particular the EVI1Del190–515 splice variants.
Since EVI1 behaves as a transcriptional co‐repressor interacting with the nuclear co‐repressor CtBP1 (Chakraborty et al., 2001; Verger et al., 2006), we investigated whether the splice variants or deletion mutants colocalized with CtBP1 or altered CtBP1 localization. In T29 cells transfected with EVI1 wild type or any of the splice variants or deletion mutants, CtBP1 colocalized to nuclear subdomains with EVI1 and splice/deletion mutant forms (Figure 3B). In contrast, EVI1 1–268, which has increased diffuse nuclear distribution, CtBP1 localization also had increased diffuse nuclear localization (Figure 3B). These results indicate that amino acid 268–1050 appears necessary for EVI1 to colocalize with CtBP1 to nuclear speckles. While EVI1 1–268 could not be detected in co‐immunoprecipitates, wild type EVI1 and the other splice variants/mutant forms investigated were readily detected in CtBP1 co‐immunoprecipitates (Figure 3C). Thus, this region (amino acids 268–1050) may be responsible for eliciting repression of CtBP1 regulated TGFβ‐responsive target genes including plasminogen activator inhibitor 1 (PAI‐1) which is regulated by CtBP1.
Since nuclear splicing factors are also localized to such nuclear subdomains (Hall et al., 2006), we investigated whether the EVI1 splice variants may be localized to nuclear splicing speckles as indicated by the presence of sc‐35 domains (Hall et al., 2006), which marks a major nuclear subregion highly enriched in pre‐mRNA splicing components and poly(A) RNA. However, we failed to observe significant colocalization of sc‐35 with any of the EVI1 deletion mutants or splice variants, indicating that EVI1 does not colocalize significantly to nuclear splicing speckles (results not shown).
PML bodies containing the PML protein (promyelocytic leukemia protein) identify another group of distinct nuclear subregions (Chelbi‐Alix et al., 1995). PML nuclear bodies are implicated in the regulation of transcription, apoptosis, senescence, and anti‐viral responses (Dellaire and Bazett‐Jones, 2004). We assessed whether EVI1 splice variants may localize to PML bodies by co‐expressing PML4 with specific EVI1 splice variants. Strikingly, we observed that in contrast to wild type EVI1, EVI1Del190–515 dramatically (to a lesser extent with EVI1Del427–515) colocalized with PML4 in large nuclear subregions indicative of a potential interaction (Figure 3D). However, we were not able to co‐immunoprecipitate PML4 with EVI1 (results not shown). PML subdomains represent large clusters of proteins that do not necessarily associate physically but rather are required for the function of the PML subdomains, suggesting that PML and EVI1 may be functionally related due to being localized in a single compartment.
3.3. EVI1Del190–515 alters TGFβ‐mediated transcriptional induction
EVI1 has been shown to block TGFβ‐mediated signaling by inhibiting SMAD‐induced gene transcription through binding directly to SMAD3 and recruiting CtBP1 and HDAC to TGFβ responsive promoters (Hirai et al., 2001; Izutsu et al., 2001). It has been reported that EVI1 binds with SMAD3 upon TGFβ activation in various cell types (Hirai et al., 2001; Izutsu et al., 2001). This interaction is dependent on the presence of the first zinc finger domain (spanning exons 4–7). Since EVI1Del190–515 is lacking the last 2 zinc fingers of the first zinc finger domain, we investigated whether this splice variant may have altered binding to SMAD3. In order to address this possibility, we expressed wild type EVI1 and EVI1Del190–515 (as EGFP fusions) with FLAG‐SMAD3 in T29 cells and performed co‐immunoprecipitation with FLAG antibodies. This was followed by western analysis using EVI1 polyclonal antibodies and SMAD3 antibodies (Figure 4A). We observed that both wild type EVI1 and EVI1Del190–515 bound SMAD3, suggesting that EVI1Del190–515, although lacking the last 2 zinc fingers in the first zinc finger domain, retains the ability to bind SMAD3 similar to wild type EVI1.
Figure 4.
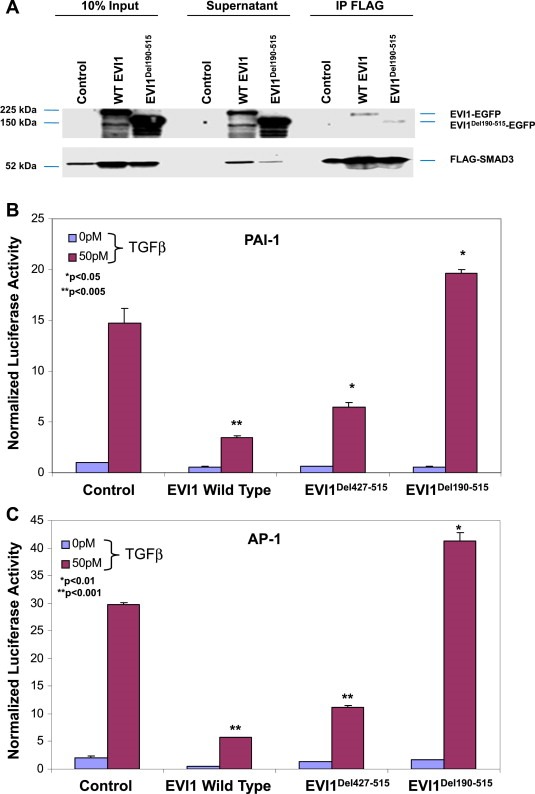
EVI1Del190–515 alters TGFβ‐mediated transcriptional regulation of the PAI‐1 promoter in ovarian cells. (A) Co‐immunoprecipitation of SMAD3 with EVI1 was performed using an anti‐FLAG antibody with lysates from cells expressing EVI1 and EVI1Del190–515 (as EGFP fusions) and FLAG‐SMAD3 followed by western analysis using EVI1 and SMAD3 polyclonal antibodies. The inputs represent 10% of the total. Based on densitometric analyses, between 1 and 5% of SMAD2/3 immunoprecipitated with EVI1. (B–C) Nucleofector transfection was performed on T29 cells with EVI1, EVI1Del427–515, or EVI1Del190–515 (5 μg) in combination with CAGA (1 μg) (B) or AP‐1 (1 μg) (C) using Renilla luciferase to normalize (0.05 μg). Cells were re‐seeded 6 h post‐transfection, allowed to adhere for 6 h, and serum starved/treated with 50 pM TGFβ. 50 pM TGFβ was chosen as being on the linear portion of the dose curve. The following day (24 h post‐transfection), cells were harvested in passive lysis buffer and assessed for luciferase activity using Dual Luciferase Assay kit.
TGFβ regulates motility and invasion, in part, by inducing expression of PAI‐1. Indeed, Nanjundan et al. (2007) and others (Sunde et al., 2006) have reported that EVI1 represses TGFβ‐induced PAI‐1 promoter activity. In order to address whether EVI1 splice variants may differentially affect PAI‐1 promoter activity, we examined whether EVI1 and EVI1Del190–515 could modulate PAI‐1 expression using p(CAGA)12‐Lux, a reporter construct containing 12 repeats of the SMAD binding sequences from the PAI‐1 promoter. As shown in Figure 4B, wild type EVI1 (similar to our previous report (Nanjundan et al., 2007)) and EVI1Del427–515 repress basal and TGFβ‐induced PAI‐1 promoter activity. In contrast, EVI1Del190–515 not only failed to repress the PAI‐1 promoter but modestly and reproducibly increased PAI‐1 promoter activity upon TGFβ treatment compared to control cells. As EVI1Del190–515 binds both CtBP1 and SMAD3, the EVI1Del190–515 variant appears to inactivate the function of CtBP1 and SMAD3. These results demonstrate that expression of wild type EVI1 decreases the ability of TGFβ to induce PAI‐1 promoter activity while EVI1Del190–515 expression was sufficient to increase TGFβ‐mediated PAI‐1 promoter activity.
We also determined whether there were differential effects of wild type EVI1 and EVI1Del190–515 on the activator protein 1 (AP‐1) inducible cis‐enhancer element. AP‐1 is reported to function as both a positive and negative regulator in a variety of cellular differentiation processes (Kang et al., 1998). Similar to the PAI‐1 reporter, both wild type and EVI1Del427–515 repress TGFβ‐induced AP‐1 promoter activity, whereas EVI1Del190–515 expression modestly increased TGFβ‐induced AP‐1 activity (Figure 4C). These results suggest that a region between amino acid 190 and 427 of EVI1, potentially the sixth and seventh zinc finger of zinc finger region 1 are critical for repression of TGFβ signaling.
3.4. EVI1 wild type and EVI1Del427–515 but not EVI1Del190–515 alter cyclin E1 and cell cycle progression
We had previously reported that wild type EVI1 expression failed to result in the generation of long‐term stable cell clones (Nanjundan et al., 2007). In particular, we previously attempted T29, T80, OVCA420, and OVCAR8 cells using plasmid‐based systems as well as retroviral mediated stable cell line generation in T29 and OVCAR8 cells upon puromycin selection (Nanjundan et al., 2007). Clones could only be passaged 2–3 times following clone isolation and expansion since the cells underwent cell death and senescence (Nanjundan et al., 2007).
We next investigated the effects of transient retroviral expression of EVI1 to levels present in patient tumors in OVCAR8 and T29 cells expressing wild type EVI1, EVI1Del427–515, EVI1Del190–515 under short‐term antibiotic selection. As shown in Figure 5A, successful expression of EVI1 and splice variants was obtained in both T29 and OVCAR8 cells with generation of low and high wild type EVI1 expressing cells. Western analyses of OVCAR8 cells demonstrated multiple bands with the EVI1 antibody which could potentially represent EVI1 proteolytic or degradation products (Figure 5A). In order to identify signaling pathways that were altered following EVI1 expression and TGFβ treatment in these cell lines, we performed reverse phase protein array (RPPA) analyses on T29 and OVCAR8 cells treated with TGFβ across a time course (0–24 h) (Figure 5B). The two independent infected parental cell populations were averaged to generate the heatmaps presented in Figure 5B (Supplementary File 1 and 2). TGFβ induced similar changes in specific signaling mediators in both T29 and OVCAR8 cells (Supplementary File 3). Although the majority of the pathway mediators and downstream effectors of TGFβ appeared to be unaltered by EVI1 as well as splice variant overexpression, we noted reproducible increases in cyclin E1 protein levels in wild type EVI1 and EVI1Del427–515 but not EVI1Del190–515 expressing OVCAR8 cell lines. The effects on cyclin E1 were validated by western analysis which detected increased abundance of low molecular weight forms of cyclin E1 validated via the use of positive controls (MCF7 overexpression of wild type cyclin E1 and LMW forms) (Nanos‐Webb et al., 2012; Wingate et al., 2003) (Figure 5C). We next determined whether this increase in cyclin E1 expression was associated with functional responses. Although cell motility was not altered, we identified that only the high expressing wild type EVI1 and EVI1Del427–515 showed a small but significant increase in the percentage of cells in the S phase with a corresponding reduction in cell numbers in the G1 phase of the cell cycle (Figure 5D). No changes in cell cycle, cyclin E1 expression, or cell motility was noted with EVI1Del190–515 expression in OVCAR8 cells. We also assessed changes in cell cycle regulatory functions of cyclin E. However, we did not observe any reproducible changes in the phosphorylation status of CDK2 and Rb. Furthermore, the kinase activity of CDK2 and cyclin E1 were unchanged by EVI1 splice form overexpression (results not shown). Collectively, these observations suggest that the increased LMW cyclin E1 expression is likely mediating its effects independently of cell cycle deregulation.
Figure 5.
(continued).
Figure 5.
(continued).
3.5. Knockdown of MDS/EVI1 and EVI1Del190–515 alters claudin‐1 expression, EMT markers, and cellular motility
In order to determine the functional consequence of EVI1 splice variants in cancer cells, we performed knockdown of EVI1 forms using siRNAs designed by Jazaeri et al. (2010): (1) siB targets exon XIV of wild type EVI1 which reduces expression of MDS/EVI1, wild type EVI1, and EVI1Del190–515; (2) si2kb targets the exon VI–VII junction and reduces expression of only EVI1Del190–515; (3) si04 targets exon VII and reduces expression of MDS1/EVI1 and EVI1; and (4) siME targets the splice junction site between MDS1 and EVI1 which reduces expression of both MDS1/EVI1 and EVI1Del190–515. We have validated these knockdowns by western analyses (see Figure 6A and C).
Figure 6.
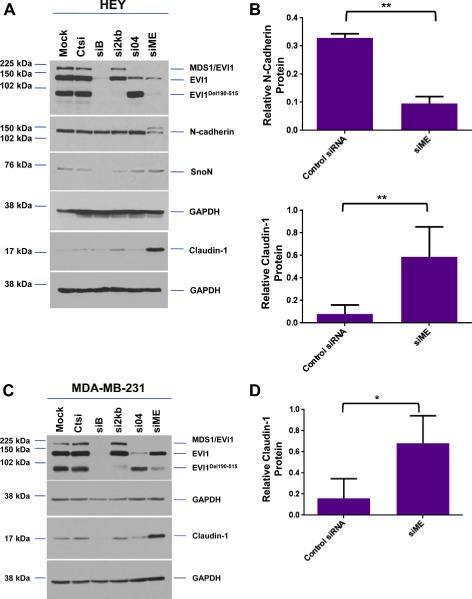
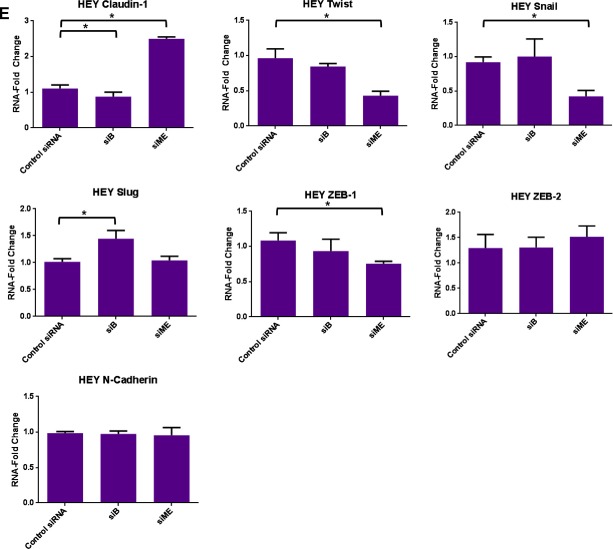
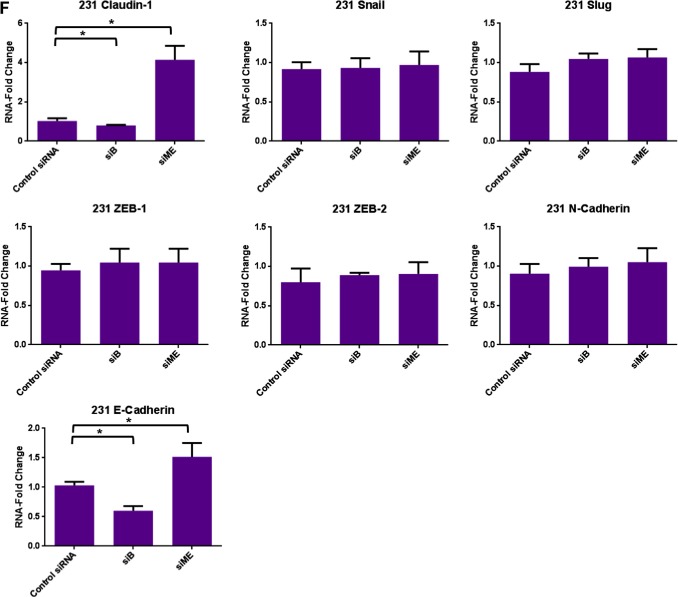
Knockdown of specific splice variants of EVI1 via siRNAs. (A) HEY cells were seeded at 325,000 cells/well and transfected with (1) non‐targeting (control) siRNA (Ctsi), (2) siB, (3) si2kb, (4) si04, or (5) siME. Following 72 h post‐transfection, cell lysates were collected and western analyses performed using the indicated antibodies. The data shown are representative of three independent experiments. (B) Densitometric analyses of N‐cadherin and claudin‐1 westerns presented in (A). (C) MDA‐MB‐231 cells were seeded at 1 million cells/well and transfected with (1) non‐targeting (control) siRNA (Ctsi), (2) siB, (3) si2kb, (4) si04, or (5) siME. Following 72 h post‐transfection, cell lysates were collected and western analyses performed using the indicated antibodies. The data shown are representative of three independent experiments. (D) Densitometric analyses of claudin‐1 westerns presented in (C). (E) RNA was isolated from HEY cells transfected with control siRNA, siB, or siME for real‐time PCR analyses for claudin‐1, Twist, Snail, Slug, ZEB‐1, ZEB‐2, and N‐cadherin. The data shown are representative of three independent experiments. (F) RNA was isolated from MDA‐MB‐231 cells transfected with control siRNA, siB, or siME for real‐time PCR analyses for claudin‐1, Snail, Slug, ZEB‐1, ZEB‐2, N‐cadherin, and E‐cadherin. The data shown are representative of three independent experiments.
Figure 6.
(continued).
Figure 6.
(continued).
Using HEY ovarian and MDA‐MB‐231 breast cancer cells (which express high levels of EVI1 and its splice variants), we performed the above described siRNA knockdown and noted marked changes in claudin‐1 expression. Claudin‐1 is an essential protein required for the formation of tight junctions and maintaining epithelial polarity (Ikenouchi et al., 2003). Specifically, we observed a dramatic increase in claudin‐1 protein (epithelial marker) with siME (knockdown of both MDS1/EVI1 and EVI1Del190–515) in both HEY and MDA‐MB‐231 cells (7‐fold and 4‐fold increase, respectively) (Figure 6A–D). Additionally, we observed a significant decrease in N‐cadherin protein levels (mesenchymal marker) with siME in HEY cells (3‐fold) (Figure 6A and B). Next, we assessed whether knockdown of both MDS1/EVI1 and EVI1Del190–515 could modulate claudin‐1 RNA levels. Thus, we performed real‐time PCR in HEY and MDA‐MB‐231 cells transfected with siB and siME. Strikingly, we noted a marked 6‐fold increase in claudin‐1 mRNA upon knockdown of both MDS1/EVI1 and EVI1Del190–515 (Figures 6E and F).
Since EVI1 can modulate miRNA expression (De Weer et al., 2011; Dickstein et al., 2010; Gao et al., 2011; Gomez‐Benito et al., 2010; Vazquez et al., 2010) and notably, the miRNA 200 family members alter EMT markers (Gregory et al., 2008a, 2008b; Korpal et al., 2008; Park et al., 2008; Paterson et al., 2008), we next assessed whether altered expression of EVI1 splice variants can modulate miRNA 200 family member expression. However, in both HEY and MDA‐MB‐231 cells, we did not detect reproducible changes in miRNA‐200a, b, c expression (results not shown). These results indicate that EVI1 splice forms do not modulate expression of a miRNA‐200 family member which could lead to the observed changes in claudin‐1 and EMT marker expression.
In cancer, the assembly of tight junctions may be dysregulated leading to internalization or cytoplasmic distribution of such protein complexes. In order to determine whether the distribution of claudin‐1 may be disrupted due to altered EVI1 expression, we prepared Triton X‐100 soluble and insoluble extracts from HEY and MDA‐MB‐231 cells. As shown in Figure 7A and B, we noted that claudin‐1 was primarily found in the detergent soluble fractions of both HEY and MDA‐MB‐231 cells, regardless of the presence of absence of MDS1/EVI1 and EVI1Del190–515.
Figure 7.
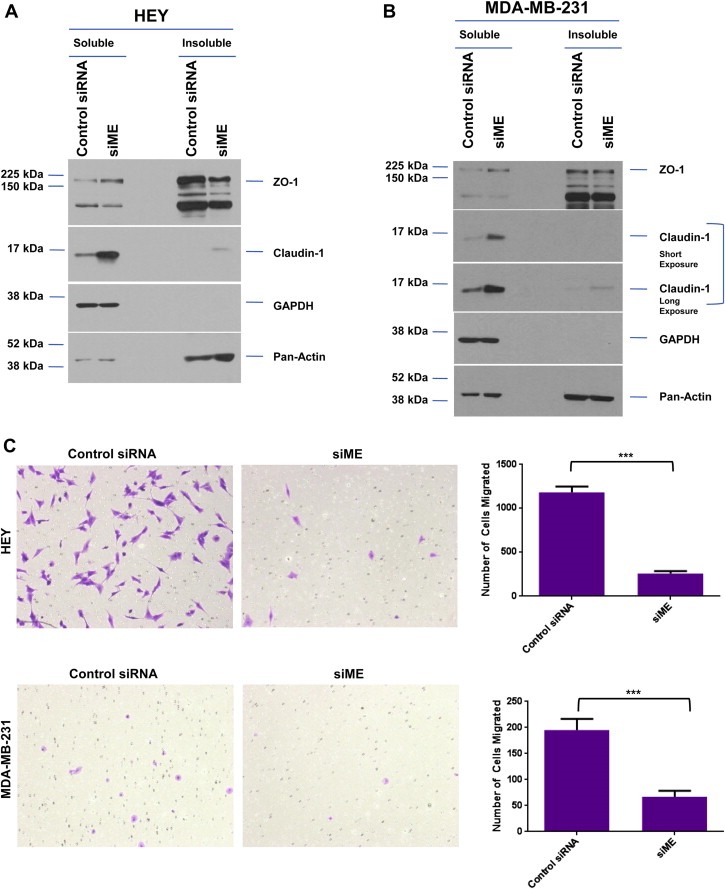
Reduced expression of MDS1/EVI1 and EVI1Del190–515 modulates cellular motility in HEY and MDA‐MB‐231 cells. (A) HEY cells were transfected with control siRNA or siME. Seventy‐two hours post‐transfection, Triton X‐100 soluble and insoluble fractions were extracted and western analyses performed using indicated antibodies. The data shown are representative of two independent experiments. (B) MDA‐MB‐231 cells were transfected with control siRNA or siME. Seventy‐two hours post‐transfection, Triton X‐100 soluble and insoluble fractions were extracted and western analyses performed using indicated antibodies. The data shown are representative of two independent experiments. (C) HEY and MDA‐MB‐231 cells were treated with control siRNA or siME followed by seeding into Boyden chambers to assess migratory potential. Following 18 h, migrated cells were stained with crystal violet and counted.
We next assessed whether the increase in claudin‐1 expression observed with siME alters the migratory potential of HEY and MDA‐MB‐231 cells. As shown in Figure 7C, we observed a significant reduction in cells that migrated toward the chemoattractant (FBS) in both cancer cell lines implicating a role for specific EVI1 splice variants in modulating cellular motility. These results suggest that in the high‐expressing EVI1 splice form HEY cancer cell line, the presence of wild type EVI1 or loss of MDS1/EVI1 together with EVI1Del190–515 positively regulates claudin‐1 expression to modulate cellular motility.
4. Discussion
The 3q26.2 amplification is one of the earliest and most consistent aberrations in epithelial ovarian cancers. We have previously demonstrated by high resolution CGH analysis that EVI1 is located in the minimal 3q26.2 amplicon and is associated with a marked accumulation of MDS1/EVI1 (PRDM3, MECOM) transcripts (Nanjundan et al., 2007). Herein, we present evidence that there exist aberrant EVI1 transcripts with Del190–515 being the most abundant form of aberrantly spliced EVI1 in ovarian cancers. The primers used to explore splice variants in EVI1 would be expected to amplify products present in both EVI1 and MDS1/EVI1. Thus, we propose that the EVI1Del190–515 form likely represents the most common aberrantly spliced and MDS1/EVI1 transcript. The role of this variant in normal cells is presently unknown and requires further investigations. An alternative splice variant of EVI1, designated Δ324 (EVI1s) (Alzuherri et al., 2006; Aytekin et al., 2005; Kilbey and Bartholomew, 1998), originally cloned from HEC‐1 cells (an endometrial carcinoma cell line), encodes a protein which lacks a portion of the first zinc finger DNA binding domain, the intervening amino acids 239–514 (intervening region (IR)) located between the first zinc finger domain and the repressor domain (Kilbey and Bartholomew, 1998). This isoform was reported to be deficient in its transformation ability when assayed in Rat1 fibroblasts and was reported to be present in ovarian carcinomas (Jazaeri et al., 2010). It is likely that Δ324 (and Del190–515) and Del427–515 utilize the same cryptic splice acceptor site in exon VII. However, each of the variants appear to initiate from a different splice donor site and to delete different regions of exon VII.
We have previously reported that short‐term EVI1 overexpression promotes ovarian cell proliferation and that both, EVI1 and MDS1/EVI1 promoted ovarian cell migration (Nanjundan et al., 2007). Indeed, EVI1 may contribute to epithelial‐mesenchymal transition (EMT) by opposing TGFβ signaling which is well established to promote EMT during the latter stages of cancer development (Elliott and Blobe, 2005). Notably, in Caenorhabditis elegans, the EVI1 homolog (Egl‐43) appeared to be essential for Notch‐mediated cell fate specification and regulation of cell invasion (Rimann and Hajnal, 2007). Furthermore, EVI1 synergizes with FOS in invasive ovarian tumors (Bard‐Chapeau et al., 2012). FOS is a critical mediator in the regulation of cell adhesion, proliferation, and colony formation in late‐stage ovarian carcinomas (Bard‐Chapeau et al., 2012). We now demonstrate that knockdown of MDS1/EVI1 and EVI1Del190–515 leads to acquisition of an epithelial phenotype, associated with upregulation of claudin‐1 and altered expression of other EMT markers. Human claudin‐1 is located at 3q28, downstream of the EVI1 amplification site (3q26.2) and is an essential component of the tight junctions. Thus, our studies now demonstrate potential cross‐talk between these two regions of interest.
Based on the knockdown with si04 and siME (observed between HEY and MDA‐MB‐231 cells), the relative levels of wild type EVI1 and EVI1Del190–515 may potentially be responsible for mediating the changes observed in claudin‐1 and thus cellular motility. Thus, we propose that EVI1Del190–515 may mediate a dominant‐negative effect on wild type EVI1 function. Indeed, although EVI1Del190–515 binds CtBP1 and SMAD3, it is unable to repress PAI‐1/AP‐1 promoter activity. Although EVI1Del190–515 modestly increased the effects of TGFβ in PAI‐1/AP‐1 promoter‐based assays, this modest increase did not appear to translate into significant functional changes or alterations in signaling pathways in OVCAR8 or T29 cells as detected by RPPA analysis.
There are several possible mechanisms for generation of EVI1 splice forms. One possibility is the presence of mutations in cis‐regulatory elements (Cooper, 2005; Singh and Cooper, 2006). However, we previously reported that we failed to identify mutations by sequencing of genomic EVI1 (across its 16 exons) including splice site junction sites as well as 150 bp of adjacent intronic regions in advanced stage serous epithelial ovarian cancer patients (Nanjundan et al., 2007), an observation that has been confirmed by the TCGA analysis. A second possibility is that copy number increases cause an imbalance with the splicing machinery (i.e. if the splicing machinery is rate limiting, this would alter splicing). In addition, alterations in splicing regulating pathways including RAS and PI3K/AKT pathways that are frequently activated in ovarian cancer (Patel et al., 2004, 2005; Pelisch et al., 2005) have been shown to alter activities of SR (serine/arginine‐rich) pre‐splicing factors which may result in aberrant splice variants. Alternatively, altered levels of trans‐acting regulatory factors (snRNPs, spliceosome complex, and SR proteins) (Pajares et al., 2007) may lead to production of these aberrant splice variants. In particular, the trans‐acting splicing factor, SF2/ASF (SFRS1), is upregulated in human tumors due to genomic amplification and is sufficient to transform cells (Karni et al., 2007). Indeed, Krainer's group demonstrate that SF2/ASF appears to control the splicing pattern of several proteins in the PI3K/AKT and RAS pathways that could lead to altered splicing (Karni et al., 2007). However, our results do not reproducibly demonstrate that siRNA to SF2/ASF alters the pattern of EVI1 splice variants in ovarian cancer cells (results not shown).
Recently, it was described that EVI1 and EVI1s (short form) mRNAs are expressed in ovarian cancers with highest expression in the cancer specimens (Jazaeri et al., 2010). Further, expression of EVI1 or EVI1s did not increase ovarian cell proliferation when expressed in EVI1‐null OVCAR8 cells (Jazaeri et al., 2010) and furthermore, we previously reported that stable expression of EVI1 in OVCAR8 cells leads to growth inhibition and loss of expression (Nanjundan et al., 2007). Herein, we report that short‐term retroviral expression of wild type EVI1 and EVI1Del427–515 in OVCAR8 cells does lead to increased cyclin E1 expression. Changes in cyclin E1 and the observed cell cycle changes appeared to require high‐level expression of wild type EVI1 and EVI1Del427–515. Indeed, expression of cyclin E1 is well known to promote S phase entry and promote proliferation (Spruck et al., 2006). This is reminiscent of the effect of protein kinase C iota (PKCι), another member of the 3q26.2 amplicon on cyclin E overexpression in ovarian cancers (Eder et al., 2005). Overexpression of atypical PKC results in not only defects in apical‐basal polarity but also in increased cyclin E expression with corresponding increases in cellular proliferation using a Drosophila eye model as well as in ovarian cancer specimens (Eder et al., 2005). In cancer, cyclin E1 can be dysregulated via multiple mechanisms including overexpression and production of low molecular weight (LMW) forms which are generated via the action of a protease (Spruck et al., 2006). Detection of LMW forms of cyclin E1 appears to be correlated with the total level of cyclin E1 protein and both forms are associated with poor patient outcomes in various cancers including breast (Spruck et al., 2006). The nature of the functional effect of LMW cyclin E1 in the EVI1 OVCAR8 overexpressing cells needs further investigation.
Both Del190–515 and Del427–515 disrupt a portion of exon VII (see Figure 1B), implicated in transformation (Kilbey and Bartholomew, 1998) and Del190–515 additionally disrupts zinc fingers 6 and 7 of the 1st zinc finger complex, implicated in SMAD binding, recruitment of CtBP, p300/PCAF, and HDAC, JNK regulation, transformation, and transcription (Hirai, 1999; Hirai et al., 2001). Thus, it is expected that the Del190–515 transcript may potentially disrupt a number of EVI1 functions. However, the first five zinc fingers in the first zinc finger domain and the complete second zinc finger domain are intact in Del190–515, thus, some EVI1 functions may remain intact. Our results suggest that the EVI1Del190–515 splice variant still retains the ability to bind SMADs and CtBP1; however, this variant lacks function due to the absence of Zn domain 6 and 7. Furthermore, the localization of this splice variant is altered from nuclear speckles to PML nuclear bodies which are nuclear subregions implicated in altering protein stability, transcriptional regulation, and sequestration of various proteins. Further investigation is needed to determine whether AP‐1 and/or CtBP1 may move to these nuclear subcompartments with the EVI1Del190–515 which may, in part, account for the potential dominant effects of the EVI1Del190–515. Furthermore, processes leading to selection of a context in which Del190–515 is the dominant EVI1 form could result due to inactivation of selective EVI1 and potential TGFβ functions during ovarian tumorigenesis.
Authorship contributions
MN and GBM participated in the conception of this study. MN, PD, GBM, TB, and KK participated in experimental design and data interpretation. MN, PD, KB, TB, and KK participated in conducting experiments. MN, PD, and GBM participated in the writing of the final manuscript.
Conflict of interest
None declared.
Supporting information
The following are the supplementary data related to this article:
Supplementary Figure 1 Analysis of 117 transcripts from SKOV3, HMEC, T29, and stage I–IV OVCA are shown in schematic format. The clones obtained (clone A–G), their deleted/altered regions, the source from which they were identified, and their frequency are presented.
Supplementary File 1 RPPA heat‐map results obtained for TGFβ‐treated control, wild type EVI1, EVI1Del427–515, and EVI1Del190–515 OVCAR8 cells.
Supplementary File 2 RPPA heat‐map results obtained for TGFβ‐treated control, wild type EVI1, EVI1Del427–515, and EVI1Del190–515 T29 cells.
Supplementary File 3 List of signaling mediators identified by RPPA analyses with similar expression profiles between TGFb treated T29 and OVCAR8 cells.
Acknowledgments
This work was supported by the NCI RO1 123219 to GBM and MN, University of South Florida Departmental Start‐up Funds to MN, and a University of South Florida New Researcher Grant to MN. We also acknowledge the assistance of Christie Campla and Anila Rao on the studies described in this manuscript.
Supplementary data 1.
1.1.
Supplementary data related to this article can be found at http://dx.doi.org/10.1016/j.molonc.2013.02.008.
Dutta Punashi, Bui Tuyen, Bauckman Kyle A., Keyomarsi Khandan, Mills Gordon B., Nanjundan Meera, (2013), EVI1 splice variants modulate functional responses in ovarian cancer cells, Molecular Oncology, 7, doi: 10.1016/j.molonc.2013.02.008.
References
- Alzuherri, H. , McGilvray, R. , Kilbey, A. , Bartholomew, C. , 2006. Conservation and expression of a novel alternatively spliced Evi1 exon. Gene 384, 154–162. [DOI] [PubMed] [Google Scholar]
- Aytekin, M. , Vinatzer, U. , Musteanu, M. , Raynaud, S. , Wieser, R. , 2005. Regulation of the expression of the oncogene EVI1 through the use of alternative mRNA 5'-ends. Gene 356, 160–168. [DOI] [PubMed] [Google Scholar]
- Bard-Chapeau, E.A. , Jeyakani, J. , Kok, C.H. , Muller, J. , Chua, B.Q. , Gunaratne, J. , 2012. Ecotopic viral integration site 1 (EVI1) regulates multiple cellular processes important for cancer and is a synergistic partner for FOS protein in invasive tumors. Proc. Natl. Acad. Sci. U.S.A. 109, 2168–2173. [DOI] [PMC free article] [PubMed] [Google Scholar]
- Beroukhim, R. , Mermel, C.H. , Porter, D. , Wei, G. , Raychaudhuri, S. , Donovan, J. , 2010. The landscape of somatic copy-number alteration across human cancers. Nature 463, 899–905. [DOI] [PMC free article] [PubMed] [Google Scholar]
- Chakraborty, S. , Senyuk, V. , Sitailo, S. , Chi, Y. , Nucifora, G. , 2001. Interaction of EVI1 with cAMP-responsive element-binding protein-binding protein (CBP) and p300/CBP-associated factor (P/CAF) results in reversible acetylation of EVI1 and in co-localization in nuclear speckles. J. Biol. Chem. 276, 44936–44943. [DOI] [PubMed] [Google Scholar]
- Chelbi-Alix, M.K. , Pelicano, L. , Quignon, F. , Koken, M.H. , Venturini, L. , Stadler, M. , 1995. Induction of the PML protein by interferons in normal and APL cells. Leukemia 9, 2027–2033. [PubMed] [Google Scholar]
- Cooper, T.A. , 2005. Use of minigene systems to dissect alternative splicing elements. Methods 37, 331–340. [DOI] [PubMed] [Google Scholar]
- De Weer, A. , Van der Meulen, J. , Rondou, P. , Taghon, T. , Konrad, T.A. , De Preter, K. , 2011. EVI1-mediated down regulation of MIR449A is essential for the survival of EVI1 positive leukaemic cells. Br. J. Haematol. 154, 337–348. [DOI] [PubMed] [Google Scholar]
- Dellaire, G. , Bazett-Jones, D.P. , 2004. PML nuclear bodies: dynamic sensors of DNA damage and cellular stress. Bioessays 26, 963–977. [DOI] [PubMed] [Google Scholar]
- Dickstein, J. , Senyuk, V. , Premanand, K. , Laricchia-Robbio, L. , Xu, P. , Cattaneo, F. , 2010. Methylation and silencing of miRNA-124 by EVI1 and self-renewal exhaustion of hematopoietic stem cells in murine myelodysplastic syndrome. Proc. Natl. Acad. Sci. U.S.A. 107, 9783–9788. [DOI] [PMC free article] [PubMed] [Google Scholar]
- Eder, A.M. , Sui, X. , Rosen, D.G. , Nolden, L.K. , Cheng, K.W. , Lahad, J.P. , 2005. Atypical PKCiota contributes to poor prognosis through loss of apical-basal polarity and cyclin E overexpression in ovarian cancer. Proc. Natl. Acad. Sci. U.S.A. 102, 12519–12524. [DOI] [PMC free article] [PubMed] [Google Scholar]
- Elliott, R.L. , Blobe, G.C. , 2005. Role of transforming growth factor Beta in human cancer. J. Clin. Oncol. 23, 2078–2093. [DOI] [PubMed] [Google Scholar]
- Gao, J.S. , Zhang, Y. , Tang, X. , Tucker, L.D. , Tarwater, P.M. , Quesenberry, P.J. , 2011. The Evi1, microRNA-143, K-Ras axis in colon cancer. FEBS Lett. 585, 693–699. [DOI] [PMC free article] [PubMed] [Google Scholar]
- Gomez-Benito, M. , Conchillo, A. , Garcia, M.A. , Vazquez, I. , Maicas, M. , Vicente, C. , 2010. EVI1 controls proliferation in acute myeloid leukaemia through modulation of miR-1-2. Br. J. Cancer 103, 1292–1296. [DOI] [PMC free article] [PubMed] [Google Scholar]
- Gregory, P.A. , Bert, A.G. , Paterson, E.L. , Barry, S.C. , Tsykin, A. , Farshid, G. , 2008. The miR-200 family and miR-205 regulate epithelial to mesenchymal transition by targeting ZEB1 and SIP1. Nat. Cell. Biol. 10, 593–601. [DOI] [PubMed] [Google Scholar]
- Gregory, P.A. , Bracken, C.P. , Bert, A.G. , Goodall, G.J. , 2008. MicroRNAs as regulators of epithelial-mesenchymal transition. Cell Cycle 7, 3112–3118. [DOI] [PubMed] [Google Scholar]
- Hall, L.L. , Smith, K.P. , Byron, M. , Lawrence, J.B. , 2006. Molecular anatomy of a speckle. Anat. Rec. A Discov. Mol. Cell. Evol. Biol. 288, 664–675. [DOI] [PMC free article] [PubMed] [Google Scholar]
- Hirai, H. , 1999. The transcription factor Evi-1. Int. J. Biochem. Cell. Biol. 31, 1367–1371. [DOI] [PubMed] [Google Scholar]
- Hirai, H. , Izutsu, K. , Kurokawa, M. , Mitani, K. , 2001. Oncogenic mechanisms of Evi-1 protein. Cancer Chemother. Pharmacol. 48, (Suppl. 1) S35–S40. [DOI] [PubMed] [Google Scholar]
- Ikenouchi, J. , Matsuda, M. , Furuse, M. , Tsukita, S. , 2003. Regulation of tight junctions during the epithelium-mesenchyme transition: direct repression of the gene expression of claudins/occludin by Snail. J. Cell. Sci. 116, 1959–1967. [DOI] [PubMed] [Google Scholar]
- Izutsu, K. , Kurokawa, M. , Imai, Y. , Maki, K. , Mitani, K. , Hirai, H. , 2001. The corepressor CtBP interacts with Evi-1 to repress transforming growth factor beta signaling. Blood 97, 2815–2822. [DOI] [PubMed] [Google Scholar]
- Jazaeri, A.A. , Ferriss, J.S. , Bryant, J.L. , Dalton, M.S. , Dutta, A. , 2010. Evaluation of EVI1 and EVI1s (Delta324) as potential therapeutic targets in ovarian cancer. Gynecol. Oncol. 118, 189–195. [DOI] [PubMed] [Google Scholar]
- Kang, D.C. , Motwani, M. , Fisher, P.B. , 1998. Role of the transcription factor AP-1 in melanoma differentiation (review). Int. J. Oncol. 13, 1117–1126. [DOI] [PubMed] [Google Scholar]
- Karni, R. , de Stanchina, E. , Lowe, S.W. , Sinha, R. , Mu, D. , Krainer, A.R. , 2007. The gene encoding the splicing factor SF2/ASF is a proto-oncogene. Nat. Struct. Mol. Biol. 14, 185–193. [DOI] [PMC free article] [PubMed] [Google Scholar]
- Kilbey, A. , Bartholomew, C. , 1998. Evi-1 ZF1 DNA binding activity and a second distinct transcriptional repressor region are both required for optimal transformation of Rat1 fibroblasts. Oncogene 16, 2287–2291. [DOI] [PubMed] [Google Scholar]
- Korpal, M. , Lee, E.S. , Hu, G. , Kang, Y. , 2008. The miR-200 family inhibits epithelial-mesenchymal transition and cancer cell migration by direct targeting of E-cadherin transcriptional repressors ZEB1 and ZEB2. J. Biol. Chem. 283, 14910–14914. [DOI] [PMC free article] [PubMed] [Google Scholar]
- Kurokawa, M. , Mitani, K. , Irie, K. , Matsuyama, T. , Takahashi, T. , Chiba, S. , 1998. The oncoprotein Evi-1 represses TGF-beta signalling by inhibiting Smad3. Nature 394, 92–96. [DOI] [PubMed] [Google Scholar]
- Levy, E.R. , Parganas, E. , Morishita, K. , Fichelson, S. , James, L. , Oscier, D. , 1994. DNA rearrangements proximal to the EVI1 locus associated with the 3q21q26 syndrome. Blood 83, 1348–1354. [PubMed] [Google Scholar]
- Matsugi, T. , Morishita, K. , Ihle, J.N. , 1990. Identification, nuclear localization, and DNA-binding activity of the zinc finger protein encoded by the Evi-1 myeloid transforming gene. Mol. Cell. Biol. 10, 1259–1264. [DOI] [PMC free article] [PubMed] [Google Scholar]
- Mitani, K. , Ogawa, S. , Tanaka, T. , Kurokawa, M. , Yazaki, Y. , Hirai, H. , 1995. Growth inhibition of leukaemic cells carrying the t(3;21) by the AML1/EVI-1-specific antisense oligonucleotide. Br. J. Haematol. 90, 711–714. [DOI] [PubMed] [Google Scholar]
- Morishita, K. , Parganas, E. , Douglass, E.C. , Ihle, J.N. , 1990. Unique expression of the human Evi-1 gene in an endometrial carcinoma cell line: sequence of cDNAs and structure of alternatively spliced transcripts. Oncogene 5, 963–971. [PubMed] [Google Scholar]
- Morishita, K. , Parganas, E. , Matsugi, T. , Ihle, J.N. , 1992. Expression of the Evi-1 zinc finger gene in 32Dc13 myeloid cells blocks granulocytic differentiation in response to granulocyte colony-stimulating factor. Mol. Cell. Biol. 12, 183–189. [DOI] [PMC free article] [PubMed] [Google Scholar]
- Morishita, K. , Parganas, E. , William, C.L. , Whittaker, M.H. , Drabkin, H. , Oval, J. , 1992. Activation of EVI1 gene expression in human acute myelogenous leukemias by translocations spanning 300-400 kilobases on chromosome band 3q26. Proc. Natl. Acad. Sci. U.S.A. 89, 3937–3941. [DOI] [PMC free article] [PubMed] [Google Scholar]
- Nanjundan, M. , Nakayama, Y. , Cheng, K.W. , Lahad, J. , Liu, J. , Lu, K. , 2007. Amplification of MDS1/EVI1 and EVI1, located in the 3q26.2 amplicon, is associated with favorable patient prognosis in ovarian cancer. Cancer Res. 67, 3074–3084. [DOI] [PubMed] [Google Scholar]
- Nanjundan, M. , Byers, L.A. , Carey, M.S. , Siwak, D.R. , Raso, M.G. , Diao, L. , 2010. Proteomic profiling identifies pathways dysregulated in non-small cell lung cancer and an inverse association of AMPK and adhesion pathways with recurrence. J. Thorac. Oncol. 5, 1894–1904. [DOI] [PMC free article] [PubMed] [Google Scholar]
- Nanos-Webb, A. , Jabbour, N.A. , Multani, A.S. , Wingate, H. , Oumata, N. , Galons, H. , 2012. Targeting low molecular weight cyclin E (LMW-E) in breast cancer. Breast Cancer Res. Treat. 132, 575–588. [DOI] [PMC free article] [PubMed] [Google Scholar]
- Osterberg, L. , Levan, K. , Partheen, K. , Delle, U. , Olsson, B. , Sundfeldt, K. , 2009. Potential predictive markers of chemotherapy resistance in stage III ovarian serous carcinomas. BMC Cancer 9, 368 [DOI] [PMC free article] [PubMed] [Google Scholar]
- Pajares, M.J. , Ezponda, T. , Catena, R. , Calvo, A. , Pio, R. , Montuenga, L.M. , 2007. Alternative splicing: an emerging topic in molecular and clinical oncology. Lancet Oncol. 8, 349–357. [DOI] [PubMed] [Google Scholar]
- Park, S.M. , Gaur, A.B. , Lengyel, E. , Peter, M.E. , 2008. The miR-200 family determines the epithelial phenotype of cancer cells by targeting the E-cadherin repressors ZEB1 and ZEB2. Genes Dev. 22, 894–907. [DOI] [PMC free article] [PubMed] [Google Scholar]
- Patel, N.A. , Apostolatos, H.S. , Mebert, K. , Chalfant, C.E. , Watson, J.E. , Pillay, T.S. , 2004. Insulin regulates protein kinase CbetaII alternative splicing in multiple target tissues: development of a hormonally responsive heterologous minigene. Mol. Endocrinol. 18, 899–911. [DOI] [PubMed] [Google Scholar]
- Patel, N.A. , Kaneko, S. , Apostolatos, H.S. , Bae, S.S. , Watson, J.E. , Davidowitz, K. , 2005. Molecular and genetic studies imply Akt-mediated signaling promotes protein kinase CbetaII alternative splicing via phosphorylation of serine/arginine-rich splicing factor SRp40. J. Biol. Chem. 280, 14302–14309. [DOI] [PubMed] [Google Scholar]
- Paterson, E.L. , Kolesnikoff, N. , Gregory, P.A. , Bert, A.G. , Khew-Goodall, Y. , Goodall, G.J. , 2008. The microRNA-200 family regulates epithelial to mesenchymal transition. Sci. World J. 8, 901–904. [DOI] [PMC free article] [PubMed] [Google Scholar]
- Pelisch, F. , Blaustein, M. , Kornblihtt, A.R. , Srebrow, A. , 2005. Cross-talk between signaling pathways regulates alternative splicing: a novel role for JNK. J. Biol. Chem. 280, 25461–25469. [DOI] [PubMed] [Google Scholar]
- Rimann, I. , Hajnal, A. , 2007. Regulation of anchor cell invasion and uterine cell fates by the egl-43 Evi-1 proto-oncogene in Caenorhabditis elegans . Dev. Biol. 308, 187–195. [DOI] [PubMed] [Google Scholar]
- Singh, G. , Cooper, T.A. , 2006. Minigene reporter for identification and analysis of cis elements and trans factors affecting pre-mRNA splicing. Biotechniques 41, 177–181. [DOI] [PubMed] [Google Scholar]
- Smith, D.M. , Patel, S. , Raffoul, F. , Haller, E. , Mills, G.B. , Nanjundan, M. , 2010. Arsenic trioxide induces a beclin-1-independent autophagic pathway via modulation of SnoN/SkiL expression in ovarian carcinoma cells. Cell Death Differ. 17, 1867–1881. [DOI] [PMC free article] [PubMed] [Google Scholar]
- Spruck, C. , Sun, D. , Fiegl, H. , Marth, C. , Mueller-Holzner, E. , Goebel, G. , 2006. Detection of low molecular weight derivatives of cyclin E1 is a function of cyclin E1 protein levels in breast cancer. Cancer Res. 66, 7355–7360. [DOI] [PubMed] [Google Scholar]
- Sunde, J.S. , Donninger, H. , Wu, K. , Johnson, M.E. , Pestell, R.G. , Rose, G.S. , 2006. Expression profiling identifies altered expression of genes that contribute to the inhibition of transforming growth factor-{beta} signaling in ovarian cancer. Cancer Res. 66, 8404–8412. [DOI] [PubMed] [Google Scholar]
- Tibes, R. , Qiu, Y. , Lu, Y. , Hennessy, B. , Andreeff, M. , Mills, G.B. , 2006. Reverse phase protein array: validation of a novel proteomic technology and utility for analysis of primary leukemia specimens and hematopoietic stem cells. Mol. Cancer Ther. 5, 2512–2521. [DOI] [PubMed] [Google Scholar]
- Vazquez, I. , Maicas, M. , Marcotegui, N. , Conchillo, A. , Guruceaga, E. , Roman-Gomez, J. , 2010. Silencing of hsa-miR-124 by EVI1 in cell lines and patients with acute myeloid leukemia. Proc. Natl. Acad. Sci. U.S.A. 107, E167–E168. author reply E169–170 [DOI] [PMC free article] [PubMed] [Google Scholar]
- Verger, A. , Quinlan, K.G. , Crofts, L.A. , Spano, S. , Corda, D. , Kable, E.P. , 2006. Mechanisms directing the nuclear localization of the CtBP family proteins. Mol. Cell. Biol. 26, 4882–4894. [DOI] [PMC free article] [PubMed] [Google Scholar]
- Wingate, H. , Bedrosian, I. , Akli, S. , Keyomarsi, K. , 2003. The low molecular weight (LMW) isoforms of cyclin E deregulate the cell cycle of mammary epithelial cells. Cell Cycle 2, 461–466. [PubMed] [Google Scholar]
Associated Data
This section collects any data citations, data availability statements, or supplementary materials included in this article.
Supplementary Materials
The following are the supplementary data related to this article:
Supplementary Figure 1 Analysis of 117 transcripts from SKOV3, HMEC, T29, and stage I–IV OVCA are shown in schematic format. The clones obtained (clone A–G), their deleted/altered regions, the source from which they were identified, and their frequency are presented.
Supplementary File 1 RPPA heat‐map results obtained for TGFβ‐treated control, wild type EVI1, EVI1Del427–515, and EVI1Del190–515 OVCAR8 cells.
Supplementary File 2 RPPA heat‐map results obtained for TGFβ‐treated control, wild type EVI1, EVI1Del427–515, and EVI1Del190–515 T29 cells.
Supplementary File 3 List of signaling mediators identified by RPPA analyses with similar expression profiles between TGFb treated T29 and OVCAR8 cells.


