

Summary
Background and objectives
Achieving and maintaining optimal fluid status remains a major challenge in hemodialysis therapy. The aim of this interventional study was to assess the feasibility and clinical consequences of active fluid management guided by bioimpedance spectroscopy in chronic hemodialysis patients.
Design, setting, participants, & measurements
Fluid status was optimized prospectively in 55 chronic hemodialysis patients over 3 months (November 2011 to February 2012). Predialysis fluid overload was measured weekly using the Fresenius Body Composition Monitor. Time-averaged fluid overload was calculated as the average between pre- and postdialysis fluid overload. The study aimed to bring the time-averaged fluid overload of all patients into a target range of 0.5±0.75 L within the first month and maintain optimal fluid status until study end. Postweight was adjusted weekly according to a predefined protocol.
Results
Time-averaged fluid overload in the complete study cohort was 0.9±1.6 L at baseline and 0.6±1.1 L at study end. Time-averaged fluid overload decreased by −1.20±1.32 L (P<0.01) in the fluid-overloaded group (n=17), remained unchanged in the normovolemic group (n=26, P=0.59), and increased by 0.59±0.76 L (P=0.02) in the dehydrated group (n=12). Every 1 L change in fluid overload was accompanied by a 9.9 mmHg/L change in predialysis systolic BP (r=0.55, P<0.001). At study end, 76% of all patients were either on time-averaged fluid overload target or at least closer to target than at study start. The number of intradialytic symptoms did not change significantly in any of the subgroups.
Conclusions
Active fluid management guided by bioimpedance spectroscopy was associated with an improvement in overall fluid status and BP.
Introduction
Fluid management is central to the treatment of chronic renal failure. Sustained fluid overload damages the cardiovascular system and leads to hypertension and left ventricular hypertrophy (1). Wizemann et al. (2) and Chazot et al. (3) have shown that mortality increases beyond a predialysis fluid overload level of around 2.5 L. Dehydration, however, leads to intradialytic symptoms and cardiac stunning (4). Controlling fluid status within an optimal range is, therefore, crucial to improve cardiovascular tolerance, quality of life, and survival.
In clinical routine, fluid management is largely based on subjective clinical assessment and the probing for dry weight procedure (5). Tracking the optimal dry weight, particularly during periods when patients undergo changes in body composition, requires a substantial amount of physician time and skill. New noninvasive bedside tools, such as bioimpedance spectroscopy (BIS), facilitate objective assessment of fluid status. Fluid status can be expressed as pre- or postdialytic fluid overload, but to assess the cardiovascular condition of a patient, the time-averaged fluid overload (TAFO) seems to better reflect the long-term cardiovascular load (6).
Recent studies investigating BIS-guided fluid management observed significant improvements in cardiovascular parameters, but each trial used different BIS measurement schedules, targets, and protocols for active fluid management (7–10). In addition, none of these trials considered the concept of TAFO as a target for individual fluid management in a representative dialysis population.
This trial is the first trial combining active BIS-guided fluid management with a TAFO target using weekly bioimpedance measurements in all patients. Furthermore, not only were the long-term targets for each patient provided, but also, weekly recommendations for individual postweight adjustments were presented to the clinician by a graphical fluid balance plan.
It was the aim to (1) demonstrate that, by using an integrated fluid management system, the fluid status was modifiable toward a normovolemic range, (2) show that optimized fluid status could be maintained in the long term, and (3) assess the improvements in cardiovascular parameters associated with fluid status optimization.
Materials and Methods
This study was registered at clinicaltrials.gov (NCT 01492634) on December 7, 2011.
Study Design
Fifty-six clinically stable hemodialysis patients were included in this prospective interventional trial lasting 3 months in two different locations (Centre de Diálisi I Recerca Aplicada Clínic, and the Dialysis Unit in the Hospital Clinic in Barcelona, Spain). It was the aim to normalize the fluid status of all patients within the first month and maintain this status until study end. Ethical approval was granted by the local ethics committee, and all patients gave their written informed consent. The study adhered to the Declaration of Helsinki.
Primary outcome was the intraindividual difference in TAFO between baseline and study end. Secondary outcomes were changes in predialysis fluid overload (FOpre), number of patients in target range, Short-Form (SF-36) Health Survey, brain natriuretic peptide, BP, laboratory parameters, medication, intradialytic events (hypotension or cramps), residual renal function, and hospitalization.
Eligible patients were all CKD-5 patients older than 18 years who underwent three times per week in-center dialysis treatments for at least 6 months before study start. Exclusion criteria were acute or chronic infections, severe diseases (malignant tumors, tuberculosis, etc.), access problems, severe intradialytic BP instabilities in the month before study start, major amputations, or pacemakers. No control group was established, because it would have been unethical not to treat severe FO if detected during the study. All patients underwent standard 4–5 hours of online hemodiafiltration treatments on Fresenius 5008 machines.
Pre- and postdialysis body weights and BPs were collected every treatment. Standard laboratory parameters were determined on a monthly basis. Brain natriuretic peptide and SF-36 quality of life indexes were assessed at baseline and study end. Intradialytic symptoms were noted in each treatment and classified as hypotension, cramps, or other.
Measurement of FO
FO in terms of excess extracellular water was measured weekly in each patient using a BIS device (Body Composition Monitor [BCM]; Fresenius Medical Care, Germany). In addition, extra- and intracellular volumes and body composition (adipose and lean tissue mass) were determined with the same device. Patients were measured before dialysis in a semirecumbent position in their dialysis chair with at least 2 minutes of equilibration time before the measurement. Details about the technique and validation have been published elsewhere (11–13). None of the patients had been measured with the BCM for at least 6 months before study start. FO was measured predialysis in all patients between Monday and Thursday each week using five BCM devices (Supplemental Appendix, section 1). To increase the number of samples, FO was additionally estimated for each of the other two treatment days of the week by using differences in predialysis body weight (preweight) according to Equation 1 (subscripts BCM and BCM_day indicate real measurements and the days on which they were performed):
 |
This approach assumes that treatment-to-treatment changes in preweight over a few days reflect mainly changes in FO and that body composition remains stable within this short time period. Postdialysis FO was calculated by subtracting ultrafiltration volume from the predialysis measurement.
Definition of TAFO
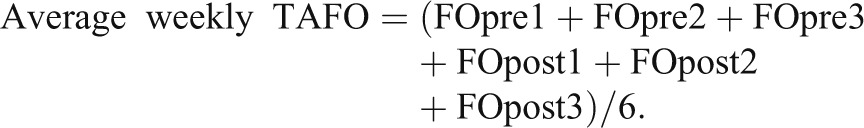
Fluid status in patients on intermittent ultrafiltration therapy is time-dependent, being lowest just after dialysis and reaching a maximum before the next dialysis session. In addition, fluid status is usually higher after the long interdialytic interval. To make different measurements of fluid status during the week comparable, the concept of weekly TAFO was introduced. It represents the average cardiovascular fluid load over 1 complete week, assuming linear fluid accumulation in the interdialytic period (Figure 1). It is defined as the average between all three FOpre and postdialysis FO (FOpost) values of the week (Equation 2):
Figure 1.
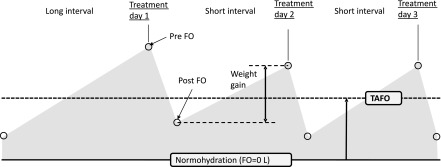
Fluid overload (FO) over 1 week in three times per week ultrafiltration treatment. Pre- and post-FO is typically higher after the long interval and lower after the short intervals. Weekly time-averaged fluid overload (TAFO) is defined as the average fluid overload throughout 1 complete week.
 |
Note that TAFO combines a weekly BCM measurement with the patients’ weights on 3 dialysis days.
TAFO Target Range
To achieve optimal fluid status, it was the aim to guide all patients to a TAFO of 0.5 L. This target was chosen for representing the median TAFO of >17,000 patients from Fresenius Nephrocare centers in 18 different countries (Supplemental Appendix, section 2). Additionally, a range of ±0.75 L around the target TAFO of 0.5 L was introduced to avoid a large number of unnecessary small postweight adjustments.
Postweight Adjustment Protocol
At the end of each week, the postweight targets for the next week were calculated according to the following rules:
TAFO>2.8 L: decrease postweight by 1 kg/wk.
TAFO between 1.25 and 2.8 L: decrease postweight by 0.5 kg/wk.
TAFO between −0.25 and 1.25 L (on target): maintain current dry weight prescription.
TAFO<−0.25 L: increase postweight by 0.5 kg/wk.
To take into account differences in body size, these adjustment steps were further normalized to a 65-kg patient (e.g., a 130-kg patient would have two times the reduction steps in kilograms) (Supplemental Appendix, section 3).
Graphical Fluid Management Plan
To assist fluid management, a graphical fluid status overview of all patients (Supplemental Appendix, section 4) was produced every week to allow easy identification of critical patients. In addition, a fluid management plan (Supplemental Appendix, section 5) was provided weekly for each patient, displaying 3-month trends in fluid status, preweight/postweight, BP, and hemoglobin (measured by the Fresenius Blood Volume Monitor to detect severe hemoconcentration during postweight reduction). To better reflect clinical routine, the TAFO target range was translated into a postweight target range by subtracting one half of the patient’s typical intradialytic weight loss from the TAFO target (by definition, TAFO is halfway between the preweight and postweight). It was the aim to bring the patient’s postweight into the postweight target range. The fluid management plan also included postweight proposals in kilograms, which were calculated according to the predefined rules and requested to be reached by the end of the following week. The specific day-to-day steps to reach the new target were managed at the clinician’s discretion. Supplemental Appendix, section 6 and Supplemental Figure 6 show four individual examples of fluid management plans and give some explanation on how these patients were treated.
Statistical Analyses
Data were reported as mean ± SD or median (minimum, maximum) if not normally distributed. Intervention effects were evaluated using a paired t test or a rank-sum test if normal distribution could not be assumed. For comparison of SDs, a statistical test using Fisher’s transformation on correlation coefficients was applied. Correlations were calculated according to Pearson. Slopes were determined by linear regression analysis. All statistical analyses were performed using SAS V9.2 and MATLAB R2012a.
Results
Patients and Treatment
Of 56 patients who were enrolled in the study (44 patients from Centre de Diálisi I Recerca Aplicada Clínic and 12 patients from the Hospital Clinic), 54 patients completed the whole study period. One patient died 3 weeks before study end for nonstudy-related reasons (this patient was included in the analysis using the intention-to-treat principle). Another patient who changed to a different center after 3 weeks was excluded from analysis, because only baseline data were available; therefore, analysis was based on 55 patients (study flow diagram is shown in Figure 2). A total of 10 nonfatal adverse events was recorded, of which 7 events led to hospitalization. Three events were related to study procedures (two events of postdialytic hypotension and one event of dyspnea/edema). All nonfatal events were completely resolved. At baseline and study end, 5 of 110 BCM measurements were excluded because of bad data quality (criterion was a >20% step in intracellular water from 1 week to the next) and replaced by results from the previous/following week. Patient characteristics are reported in Table 1.
Figure 2.

Study flow diagram.
Table 1.
Patient characteristics
| Parameter | All Patients |
|---|---|
| Age (yr) | 65±12 |
| Sex | 37 men, 18 women |
| Height (cm) | 167±8 |
| Anuric patients | 40 of 55 (72%; defined as RRF=0 versus >0) |
| Dialysis vintage (mo) | 26 (6–180) |
| Patients with diabetes | 17 of 55 (31%) |
| Patients on AHT medication | 33 of 55 (60%) |
| Patients on ESAs | 51 (mean dose at baseline: Mircera=129 µg/mo; Darbepoietin=38 µg/wk; study end: Mircera=129 µg/mo; Darbepoietin=40 µg/wk) |
| Patients receiving iron | 49 (mean dose at baseline=75 mg/wk; study end=71 mg/wk) |
| Vascular access | Catheter: 8; graft: 2; fistula: 45 |
| Underlying renal disease (no. of patients) | Diabetes: 17; hypertensive large vessel disease: 13; cystic hereditary disease: 10; GN: 3; unknown: 8; other diseases: 13 |
| Medical history | Metabolic disease: 26; surgeries: 21; cardiovascular disease: 20; other disease: 20; psychiatric disease: 15; gastrointestinal disease: 9; endocrine disease: 9; respiratory disease: 7; dermal disease: 6; hepatic biliary disease: 4 |
Results are provided as mean±SD. RRF, residual renal function; AHT, antihypertensive; ESA, erythropoietin-stimulating agent.
Primary Outcomes
TAFO in the complete population decreased by 0.28±1.14 L (P=0.08). Patients were stratified into three subgroups according to their baseline fluid status in respect to the TAFO target range. The underhydrated group was defined by TAFO<−0.25 L, the normovolemic group was defined by TAFO between −0.25 and +1.25 L, and the overloaded group was defined by TAFO>1.25 L. At baseline, 17 (31%) patients were found to be fluid-overloaded, 26 (47%) patients were normovolemic, and 12 (22%) patients were dehydrated. TAFO decreased by 1.20±1.32 L (P<0.01) in the fluid-overloaded group, remained unchanged in the normovolemic group (P=0.59), and increased by 0.59±0.76 L (P=0.02) in the dehydrated group.
Secondary Outcomes
The changes in fluid status, BP, and other parameters are summarized in Table 2.
Table 2.
Summary of study results for all patients and subgroups stratified according to their baseline fluid status
| All Patients (n=55) | Subgroup Analysis | |||||||||||
|---|---|---|---|---|---|---|---|---|---|---|---|---|
| Dehydrated at Baseline (TAFO<−0.25 L; n=12) | Normovolemic at Baseline (TAFO=−0.25 to 1.25 L; n=26) | Overloaded at Baseline (TAFO>1.25 L; n=17) | ||||||||||
| Age (yr) | 64.5±12.2 | 64.8±13.1 | 63.6±14.2 | 65.6±8.0 | ||||||||
| Sex | 37 men, 18 women | 6 men, 6 women | 16 men, 10 women | 15 men, 2 women | ||||||||
| Vintage (mo) | 26 (6–180) | 27 (6–46) | 25.5 (6–180) | 29 (8–123) | ||||||||
| Body mass index (kg/m2) | 25.8±3.8 | 28.5±2.9 | 24.9±4.1 | 25.4±3.3 | ||||||||
| Baseline | End | P | Baseline | End | P | Baseline | End | P | Baseline | End | P | |
| TAFO (L) | 0.90±1.64 | 0.62±1.10 | 0.08 | −1.06±0.67 | −0.48±0.67 | 0.02 | 0.58±0.42 | 0.51±0.77 | 0.59 | 2.76±1.31 | 1.57±0.99 | <0.01 |
| FO predialysis (L) | 2.12±1.63 | 1.77±1.09 | 0.03 | 0.27±0.64 | 0.66±0.57 | 0.13 | 1.73±0.45 | 1.68±0.76 | 0.70 | 4.01±1.33 | 2.71±1.00 | <0.01 |
| FO postdialysis (L) | −0.32±1.77 | −0.53±1.22 | 0.22 | −2.40±0.92 | −1.61±0.92 | <0.01 | −0.56±0.68 | −0.65±0.91 | 0.53 | 1.51±1.53 | 0.42±1.12 | <0.01 |
| ECW (L) | 16.7±3.0 | 16.9±2.7 | 0.51 | 16.0±2.9 | 16.8±2.9 | <0.01 | 16.1±3.2 | 16.5±3.0 | 0.06 | 18.3±2.1 | 17.5±1.8 | 0.06 |
| ICW (L) | 16.3±3.8 | 16.9±3.4 | 0.02 | 16.7±3.9 | 17.5±4.2 | 0.03 | 16.4±4.4 | 16.9±3.6 | 0.24 | 15.9±2.6 | 16.5±2.4 | 0.22 |
| LTM (kg) | 31.5±9.5 | 33.1±8.4 | 0.02 | 30.7±9.4 | 32.7±10.5 | 0.05 | 32.5±10.9 | 33.9±8.8 | 0.25 | 30.4±7.1 | 32.3±6.2 | 0.20 |
| ATM (kg) | 37.5±12.9 | 36.1±12.5 | 0.06 | 46.3±11.5 | 45.4±11.9 | 0.37 | 33.4±13.7 | 32.1±13.4 | 0.30 | 37.6±9.6 | 35.5±7.9 | 0.15 |
| BPsys pre (mmHg) | 137±26 | 137±25 | 0.95 | 116±30 | 127±34 | 0.20 | 137±19 | 139±20 | 0.56 | 150±23 | 139±26 | 0.02 |
| BPsys post (mmHg) | 135±28 | 137±26 | 0.37 | 111±25 | 130±34 | <0.01 | 136±23 | 140±22 | 0.32 | 149±27 | 138±27 | 0.02 |
| BPdia pre (mmHg) | 63±12 | 66±14 | 0.04 | 54±11 | 60±17 | 0.12 | 65±11 | 69±13 | 0.02 | 66±12 | 65±12 | 0.39 |
| BPdia post (mmHg) | 66±12 | 66±12 | 0.59 | 56±10 | 60±13 | 0.21 | 68±14 | 70±12 | 0.41 | 69±8 | 66±11 | 0.31 |
| Preweight (kg) | 71.8±12.9 | 71.9±12.8 | 0.81 | 78.1±13.0 | 79.5±12.5 | 0.01 | 68.3±14.8 | 68.6±14.6 | 0.21 | 72.8±7.5 | 71.5±7.5 | 0.08 |
| Postweight (kg) | 69.4±12.7 | 69.6±12.7 | 0.50 | 75.4±12.7 | 77.3±12.3 | <0.01 | 66.0±14.4 | 66.3±14.4 | 0.29 | 70.2±7.7 | 69.2±7.4 | 0.15 |
| Intradialytic weight loss (kg) | 2.44±0.92 | 2.31±0.71 | 0.15 | 2.67±0.84 | 2.27±0.75 | 0.07 | 2.29±0.79 | 2.33±0.68 | 0.65 | 2.51±1.16 | 2.29±0.77 | 0.34 |
| Hb (g/L) | 117±17 | 115±15 | 0.35 | 120±16 | 110±16 | 0.02 | 119±15 | 116±14 | 0.21 | 113±21 | 118±17 | 0.51 |
| Albumin (g/L) | 37.2±3.3 | 36.5±3.4 | 0.06 | 38.2±3.9 | 37.2±5.0 | 0.19 | 37.2±3.1 | 36.0±2.9 | 0.02 | 36.5±3.3 | 36.6±3.0 | 0.89 |
| Creatinine (mg/dl) | 6.9±1.9 | 6.6±1.7 | 0.03 | 7.7±1.8 | 6.8±1.7 | <0.01 | 6.7±2.1 | 6.4±1.9 | 0.07 | 6.6±1.7 | 6.7±1.4 | 0.63 |
| BNP (pg/ml) | 185 (9–4636) | 193 (20–3393) | 0.78 | 64 (15–518) | 111 (20–1578) | 0.003 | 134 (9–4636) | 160 (25–2872) | 0.97 | 472 (129–2209) | 265 (58–3393) | 0.31 |
| RRF (ml; n=15) | 500 (350–1000) | 500 (70–1600) | 0.92 | 500 (350–600) | 750 (70–1600) | n.a. | 500 (400–1000) | 500 (150–1100) | 0.80 | 600 (500–800) | 300 (155–700) | n.a. |
| SF-36 mental health | 64±23 | 68±18 | 0.14 | 65±28 | 66±20 | 0.76 | 63±21 | 65±17 | 0.75 | 64±24 | 74±19 | 0.06 |
| Body mass index (kg/m2) | 25.8±3.8 | 25.9±3.8 | 0.77 | 28.5±2.9 | 29.1±2.7 | 0.01 | 24.9±4.1 | 25.0±4.0 | 0.26 | 25.4±3.3 | 24.9±3.3 | 0.08 |
| Diabetic patients | 17 of 55 (31%) | 4 of 12 (33%) | 11 of 26 (42%) | 2 of 17 (12%) | ||||||||
| Patients receiving AHT | 33 of 55 (60%) | 2 of 12 (17%) | 17 of 26 (65%) | 14 of 17 (82%) | ||||||||
Results are provided as mean ± SD or median (minimum–maximum) if data were not normally distributed. All P values were derived from paired t tests comparing pre- and postintervention data and set to n.a. if not enough data were available for the respective comparison. TAFO, time-averaged fluid overload; FO, fluid overload; ECW, extracellular water; ICW, intracellular water; LTM, lean tissue mass; ATM, adipose tissue mass; BPsys pre, predialysis systolic BP; BPsys post, postdialysis systolic BP; BPdia pre, predialysis diastolic BP; BPdia post, postdialysis diastolic BP; Hb, hemoglobin; BNP, brain natriuretic peptide; RRF, residual renal function; SF-36, Short-Form Health Survey; AHT, antihypertensive medication.
The weekly fluid status variability (±SD) decreased continuously from baseline (±1.6 L) until week 7 (±1.1 L) and remained at this level until study end, except for a slight increase over the Christmas holiday period (Supplemental Appendix, section 6). The change in SD from ±1.64 L at baseline to ±1.10 L at study end was significant (P<0.001) (Figure 3). Of 12 baseline dehydrated subjects, 5 subjects were on target at study end, and 7 subjects remained dehydrated (but closer to the target by 0.2±0.6 L). Of 17 baseline overloaded patients, 4 patients were on target at study end, 1 patient was dehydrated, and 12 patients remained in the overloaded range (but closer to target by 0.8±1.2 L). At study end, 42 of 55 (76%) patients were either on target or at least closer to target compared with baseline.
Figure 3.

Development of TAFO over the study period. Bars indicate median, 95% confidence interval for the median (dark gray), and 1 SD (light gray). The range in the background depicts the TAFO target range of 0.5±0.75 L. The change in SD from ±1.6 L at baseline to ±1.1 L at study end was significant (P<0.001).
Systolic BP (BPsys) changes between baseline and study end were significantly correlated with changes in TAFO (r=0.55, P<0.001, slope=9.9 mmHg/L, 95% confidence interval for slope=5.7 to 14.0 mmHg/L) (Figure 4), FOpre (r=0.54, P<0.001, slope=8.8 mmHg/L), extracellular water (ECW; r=0.49, P<0.001, slope=6.6 mmHg/L), preweight (r=0.41, P<0.01, slope=3.8 mmHg/kg), and postweight (r=0.40, P<0.01, slope=3.6 mmHg/kg) but not intracellular water (P=0.87) or intradialytic weight loss (P=0.82).
Figure 4.

Change in predialysis systolic BP (BPsys) over change in TAFO between baseline and study end.
Fifteen patients had intradialytic symptoms in the baseline week (one patient with cramps, nine patients with hypotensive episodes, and nine patients with other symptoms). Fourteen patients had intradialytic symptoms in the last study week (two patients with cramps, seven patients with hypotensive episodes, and six patients with other symptoms). The number of patients with intradialytic symptoms increased from three to six in the overloaded group and decreased from five to four in the dehydrated group, but these symptom rates were not significantly different at a level of P<0.05. If a patient presented symptoms before reaching the target range, additional information (e.g., from blood volume monitoring) was used to assess whether the clinical picture supported the BCM recommendation. In this case, effort was undertaken to convince the patient to further adjust the dry weight. If symptoms persisted in two or three consecutive treatments, postweight was not further changed. More details on the occurrence of symptoms are provided in Supplemental Appendix, section 8.
No significant change in SF-36 quality of life indexes was found, except for a potential improvement in mental health from 64±24 to 74±19 (P=0.06) in patients from the overloaded group. Iron dose changed in 9 patients (baseline=75 mg/wk), dose of erythropoietin-stimulating agents changed in 21 patients, and dose of antihypertensive drugs changed in 2 patients throughout the study.
Discussion
In this study, we had several findings, seven of which are reported here. (1) It was possible to improve fluid status in fluid-overloaded and dehydrated patients according to BIS. (2) Improvements in FO were linked with BP changes. (3) BPsys changes were better correlated to FO changes than any other marker (weights, ECW, and extra- to intracellular water ratio), indicating that FO is more independent of body composition variations. (4) Mental health may have improved in the fluid-overloaded group after reducing FO (P=0.06). (5) The number of intradialytic symptoms did not change. (6) Nine patients (16%) presented repeated intradialytic morbid events before reaching the target range and therefore, could not be brought further to the target. (7) Intradialytic weight loss may have decreased in the dehydrated group after increasing fluid status (P=0.07).
BIS has been identified as a promising technology to provide an objective target for dry weight prescription (4), and an ever-growing number of measurements is being performed every month. However, no common standard has been established yet on how to include BIS-based FO measurements into clinical decision-making. Therefore, wide variations of fluid status are present throughout centers. It has been shown that mortality increases significantly above an FO level of 2.5 L (2). Investigating the prevalence of FO, data from 1500 chronic hemodialysis patients in 22 European centers revealed that more than 25% of all patients are fluid-overloaded by more than 2.5 L before dialysis and that about 5% of patients are dehydrated. These results suggest that a large proportion of patients could benefit from properly assisted fluid management.
Trials on bioimpedance-guided fluid management have observed improvements in BP control and other cardiovascular parameters (7–9). However, the important question of the most appropriate/optimal target for fluid management remains under debate. The novelty of this study is its use of the concept of average weekly TAFO, which has many practical advantages over FOpre or FOpost thresholds. It takes into account differences in weight gain, makes fluid status comparable in different treatment modalities, like normal hemodialysis, short daily dialysis, nocturnal hemodialysis, peritoneal dialysis, and even nonrenal diseases, and can be determined any day during the week, because the effects of different interdialytic intervals are eliminated. Other than TAFO improving these practical aspects, we hypothesize that TAFO may also be a better prognostic factor than FOpre, because it includes a measure of the long-term cardiovascular fluid load; however, additional study on this issue is required.
A large amount of the TAFO improvements in this study were already achieved after the first month (Figure 3) and maintained until study end. Changes in fluid status were significantly correlated with changes in BP (r=0.55, P<0.001) (Figure 4). On average, every 1 L change in TAFO resulted in a 9.9 mmHg change in BPsys. Agarwal et al. (14) found a comparable value of −6.6 mmHg for every 1 kg postweight reduction in the Dry-Weight Reduction in Hypertensive Patients (DRIP) Trial. Interestingly, we found the BP sensitivity to fluid status changes to be much more pronounced in patients who were dehydrated at baseline and whose fluid status was increased compared with overloaded patients whose fluid status was reduced (+23.9 mmHg/L versus −8.0 mmHg/L, respectively). One may speculate that this finding reflects the attenuating effect of antihypertensive medication, which was prescribed in 82% of overloaded patients but only 17% of dehydrated patients.
It is also interesting to note that changes in BPsys were better correlated with changes in FO than any other parameter (e.g., postweight, intradialytic weight loss, or ECW/total body water ratios), suggesting that BIS-derived FO is a better marker of fluid status than traditionally used surrogates, presumably because it is, by design, independent of body composition changes.
In the study by Machek et al. (7) on BIS-guided fluid status optimization, patients were defined as hyperhydrated if their relative FOpre/ECW was greater than 15%. The overloaded patients in the study were younger (60 versus 65 years), but average TAFO (3.0 L and 2.8 L, Machek et al. and this study, respectively) and BPsys (153 mmHg and 150 mmHg, Machek et al. and this study, respectively) at baseline were comparable. It was the target of the study by Machek et al. to get all patients below a relative FOpre of 15%. After 6 months, the hyperhydrated patients in the study by Machek and colleagues reached a TAFO of 1.0 L (BPsys: 139 mmHg), and after 12 months, the hyperhydrated patients in that study reached a TAFO of 0.7 L (BPsys: 128 mmHg). In this study, we achieved a TAFO of 1.6 L after 3 months (BPsys: 139 mmHg), indicating that additional time may have led to further but slower decreases in FO and BP. The patients in the study by Machek et al. (7), however, presented an increase in intradialytic weight loss from 2.6% to 3.8% of body weight, which we did not observe (3.5% to 3.2%), suggesting that some of his patients may have become too dry after dialysis and thirst increased.
Hur et al. (10) were able to show an improvement in left ventricular mass index and vascular stiffness in a randomized controlled trial on BIS-guided fluid management. Average TAFO in the intervention group was already very low at baseline (0.3 L) and further decreased to −0.2 L after 12 months, representing a fluid status even slightly lower than the fluid status of healthy subjects. Average age in the study cohort was only 51.6 years, and only 17% of patients suffered from diabetes. These results may explain patients’ tolerance to such a low fluid status without increasing intradialytic symptoms, but it is doubtful if these results can be achieved in a typically much older and more comorbid average dialysis population. Furthermore, patients may have become too volume-depleted postdialysis as residual urine volume decreased significantly from 377 to 71 ml/d, and percentage of anuric patients increased from 79% to 90% in the intervention group.
An important aspect in fluid management other than survival improvement is to maintain or even increase patients’ quality of life. We found no significant changes in SF-36 quality of life parameters, except for a potential improvement in mental health in the overloaded patient group (P=0.06). The latter is interesting in the light of a recent publication reporting an improvement in mental wellbeing after patients switched from conventional hemodialysis to short daily or nocturnal dialysis (15), which may be linked to better volume control in daily dialysis.
Lowering dry weight in dialysis patients can lead to intradialytic complications (14). We did not observe a significant change in intradialytic symptoms (apart from a potential increase of symptoms in the middle of the study) (Supplemental Table 1) as reported in the study by Machek et al. (7) after they increased fluid status in dehydrated subjects, but the tendency that the number of symptoms was related to fluid status was the same. In this respect, it will be interesting to see the results of an ongoing trial by Hecking et al. (16) on blood volume-regulated ultrafiltration in fluid-overloaded patients, in which they investigate whether the combination of intradialytic blood volume monitoring and a BIS-derived fluid status target can improve hemodynamic stability during hemodialysis.
Residual function may have improved in the dehydrated group, which was indicated by a decrease in average weight gain by 400 ml (from 2.7 to 2.3 L) over the study, even if we cannot exclude that this result may have occurred by chance (P=0.07). In fact, one dehydrated patient gradually increased residual function from 500 to 1600 ml/d after his fluid status was normalized. However, another explanation for an improvement in weight gain may be that some patients were so dehydrated after dialysis that they fell below a thirst threshold and had to drink more. After optimizing their fluid status, thirst may have disappeared, normalizing weight gain.
Using one common target for all patients is certainly an oversimplification. It was foreseeable that not all patients would be able to achieve normovolemia because of various comorbid conditions. In fact, 9 of 55 patients could not be brought into the target range for clinical reasons (Supplemental Figure 6, example d). Increasing treatment time, additional treatments, nutritional support, and smaller postweight reduction steps may have been beneficial for these patients, but additional investigations were outside the scope of this study. We do not believe that using online hemodiafiltration had an effect on the fluid status achieved and would expect to see the same results with standard hemodialysis.
Among all dehydrated patients, six patients were not willing to increase their postweight, although the BCM clearly indicated dehydration and regular hypotension occurred. A possible explanation is that some patients try to lose weight for either personal reasons or improved chance of transplantation. The group of baseline dehydrated patients was found to have much higher body mass index, preweight, and adipose tissue mass than the other groups, supporting the hypothesis that dehydration was driven by motivation to lose weight. In other patients, the use of an objective device to measure fluid status clearly improved compliance, and changes to dry weight were much better accepted.
There were limitations to this study. Patients were not randomized into control and intervention groups, because it seemed unethical not to treat severe over- or underhydration after being detected by BIS. Furthermore, there is no clinical evidence yet that using the new TAFO concept improves survival or hospitalization rates. However, most patients who achieve the TAFO target at the same time obtain a FOpre of less than 2.5 L, for which a survival benefit has been shown (2). Future studies adopting the TAFO concept should be designed to show improvements in survival and hospitalization rates and aim at identifying common characteristics of patients who cannot reach the normovolemic target for clinical reasons.
Disclosures
U.M. and P.W. are employees of Fresenius Medical Care. None of the other authors have any financial or proprietary interest in the devices or products used in this study.
Supplementary Material
Acknowledgments
The authors would like to express special thanks to the clinical staff for their dedicated work and contributions.
This study was financially supported by Fresenius Medical Care, Bad Homburg, Germany.
F.M. acted as principal investigator, with full responsibility over the study procedures, dry weight adjustment steps protocol, and all clinical actions.
Footnotes
Published online ahead of print. Publication date available at www.cjasn.org.
This article contains supplemental material online at http://cjasn.asnjournals.org/lookup/suppl/doi:10.2215/CJN.12411212/-/DCSupplemental.
See related editorial, “Time to Improve Fluid Management in Hemodialysis: Should We Abandon Clinical Assessment and Routinely Use Bioimpedance?,” on pages 1474–1475.
References
- 1.Kalantar-Zadeh K, Regidor DL, Kovesdy CP, Van Wyck D, Bunnapradist S, Horwich TB, Fonarow GC: Fluid retention is associated with cardiovascular mortality in patients undergoing long-term hemodialysis. Circulation 119: 671–679, 2009 [DOI] [PMC free article] [PubMed] [Google Scholar]
- 2.Wizemann V, Wabel P, Chamney P, Zaluska W, Moissl U, Rode C, Malecka-Masalska T, Marcelli D: The mortality risk of overhydration in haemodialysis patients. Nephrol Dial Transplant 24: 1574–1579, 2009 [DOI] [PMC free article] [PubMed] [Google Scholar]
- 3.Chazot C, Wabel P, Chamney P, Moissl U, Wieskotten S, Wizemann V: Importance of normohydration for the long-term survival of haemodialysis patients. Nephrol Dial Transplant 27: 2404–2410, 2012 [DOI] [PubMed] [Google Scholar]
- 4.Odudu A, McIntyre C: Volume is not the only key to hypertension control in dialysis patients. Nephron Clin Pract 120: c173–c177, 2012 [DOI] [PubMed] [Google Scholar]
- 5.Canaud B, Lertdumrongluk P: Probing ‘dry weight’ in haemodialysis patients: ‘Back to the future’. Nephrol Dial Transplant 27: 2140–2143, 2012 [DOI] [PubMed] [Google Scholar]
- 6.Velasco N, Chamney P, Wabel P, Moissl U, Imtiaz T, Spalding E, McGregor M, Innes A, MacKay I, Patel R, Jardine A: Optimal fluid control can normalize cardiovascular risk markers and limit left ventricular hypertrophy in thrice weekly dialysis patients. Hemodial Int 16: 465–472, 2012 [DOI] [PubMed] [Google Scholar]
- 7.Machek P, Jirka T, Moissl U, Chamney P, Wabel P: Guided optimization of fluid status in haemodialysis patients. Nephrol Dial Transplant 25: 538–544, 2010 [DOI] [PMC free article] [PubMed] [Google Scholar]
- 8.Luo YJ, Lu XH, Woods F, Wang T: Volume control in peritoneal dialysis patients guided by bioimpedance spectroscopy assessment. Blood Purif 31: 296–302, 2011 [DOI] [PubMed] [Google Scholar]
- 9.Onofriescu M, Mardare NG, Segall L, Voroneanu L, Cuşai C, Hogaş S, Ardeleanu S, Nistor I, Prisadă OV, Sascău R, Covic A: Randomized trial of bioelectrical impedance analysis versus clinical criteria for guiding ultrafiltration in hemodialysis patients: Effects on blood pressure, hydration status, and arterial stiffness. Int Urol Nephrol 44: 583–591, 2012 [DOI] [PubMed] [Google Scholar]
- 10.Hur E, Usta M, Toz H, Asci G, Wabel P, Kahvecioglu S, Kayikcioglu M, Demirci MS, Ozkahya M, Duman S, Ok E: Effect of fluid management guided by bioimpedance spectroscopy on cardiovascular parameters in hemodialysis patients: A randomized controlled trial [published online ahead of print February 15, 2013]. Am J Kidney Dis 10.1053/j.ajkd.2012.12.017 [DOI] [PubMed] [Google Scholar]
- 11.Chamney PW, Wabel P, Moissl UM, Müller MJ, Bosy-Westphal A, Korth O, Fuller NJ: A whole-body model to distinguish excess fluid from the hydration of major body tissues. Am J Clin Nutr 85: 80–89, 2007 [DOI] [PubMed] [Google Scholar]
- 12.Moissl UM, Wabel P, Chamney PW, Bosaeus I, Levin NW, Bosy-Westphal A, Korth O, Müller MJ, Ellegård L, Malmros V, Kaitwatcharachai C, Kuhlmann MK, Zhu F, Fuller NJ: Body fluid volume determination via body composition spectroscopy in health and disease. Physiol Meas 27: 921–933, 2006 [DOI] [PubMed] [Google Scholar]
- 13.Wabel P, Chamney P, Moissl U, Jirka T: Importance of whole-body bioimpedance spectroscopy for the management of fluid balance. Blood Purif 27: 75–80, 2009 [DOI] [PMC free article] [PubMed] [Google Scholar]
- 14.Agarwal R, Alborzi P, Satyan S, Light RP: Dry-weight reduction in hypertensive hemodialysis patients (DRIP): A randomized, controlled trial. Hypertension 53: 500–507, 2009 [DOI] [PMC free article] [PubMed] [Google Scholar]
- 15.Xi W, Singh PM, Harwood L, Lindsay R, Suri R, Brown JB, Moist LM: Patient experiences and preferences on short daily and nocturnal home hemodialysis. Hemodial Int 17: 201–207, 2013 [DOI] [PubMed] [Google Scholar]
- 16.Hecking M, Antlanger M, Winnicki W, Reiter T, Werzowa J, Haidinger M, Weichhart T, Polaschegg HD, Josten P, Exner I, Lorenz-Turnheim K, Eigner M, Paul G, Klauser-Braun R, Hörl WH, Sunder-Plassmann G, Säemann MD: Blood volume-monitored regulation of ultrafiltration in fluid-overloaded hemodialysis patients: Study protocol for a randomized controlled trial. Trials 13: 79, 2012 [DOI] [PMC free article] [PubMed] [Google Scholar]
Associated Data
This section collects any data citations, data availability statements, or supplementary materials included in this article.