

Abstract
Purpose.
We compared gene expression signatures in tree shrew sclera produced by three different visual conditions that all produce ocular elongation and myopia: minus-lens wear, form deprivation, and dark treatment.
Methods.
Six groups of tree shrews (n = 7 per group) were used. Starting 24 days after normal eye-opening (days of visual experience [DVE]), two minus-lens groups wore a monocular −5 diopter (D) lens for 2 days (ML-2) or 4 days (ML-4); two form-deprivation groups wore a monocular translucent diffuser for 2 days (FD-2) or 4 days (FD-4). A dark-treatment (DK) group was placed in continuous darkness for 11 days after experiencing a light/dark environment until 17 DVE. A normal colony-reared group was examined at 28 DVE. Quantitative PCR was used to measure the relative differences in mRNA levels for 55 candidate genes in the sclera that were selected, either because they showed differential expression changes in previous ML studies or because a whole-transcriptome analysis suggested they would change during myopia development.
Results.
The treated eyes in all groups responded with a significant myopic shift, indicating that the myopia was actively progressing. In the ML-2 group, 27 genes were significantly downregulated in the treated eyes, relative to control eyes. In the treated eyes of the FD-2 group, 16 of the same genes also were significantly downregulated and one was upregulated. The two gene expression patterns were significantly correlated (r2 = 0.90, P < 0.001). After 4 days of treatment, 31 genes were significantly downregulated in the treated eyes of the ML-4 group and three were upregulated. Twenty-nine of the same genes (26 down- and 3 up-regulated) and six additional genes (all downregulated) were significantly affected in the FD-4 group. The response patterns were highly correlated (r2 = 0.95, P < 0.001). When the DK group (mean of right and left eyes) was compared to the control eyes of the ML-4 group, the direction and magnitude of the gene expression patterns were similar to those of the ML-4 (r2 = 0.82, P < 0.001, excluding PENK). Similar patterns also were found when the treated eyes of the ML-4, FD-4, and DK groups were compared to the age-matched normal eyes.
Conclusions.
The very similar gene expression signatures produced in the sclera by the three different myopiagenic visual conditions at different time points suggests that there is a “scleral remodeling signature” in this mammal, closely related to primates. The scleral genes examined did not distinguish between the specific visual stimuli that initiate the signaling cascade that results in axial elongation and myopia.
Keywords: myopia, animal models, refractive error, emmetropization, axial elongation, gene expression, sclera
Three different visual conditions (minus-lens wear, form deprivation, darkness) that cause axial elongation and myopia produce very similar gene expression signatures in the sclera in 55 genes. In the sclera, the differing visual signals have merged into a single “GO” remodeling signature.
Introduction
Emmetropia is a refractive condition that occurs when the images of distant objects are focused on the retina in an eye without accommodation. Refractive error occurs when there is a mismatch between the location of the focal plane and the axial length of the eye. If the axial length is short, the retina is in front of the focal plane and the eye is hyperopic. If the axial length is long, the retina is behind the focal plane and the eye is myopic. Myopia, the most prevalent type of refractive error, affects approximately 25% to 40% of adults in North America, Europe, and Australia.1–5 In urban populations in East Asia, myopia prevalence can reach as high as 80% to 96.5%.6–10 In juvenile-onset myopia, the vitreous chamber is elongated, relative to emmetropic eyes11; myopia progression in children is accompanied by an increase in vitreous chamber depth,12 suggesting that remodeling of the sclera, the outer shell of the globe, may be involved.
Studies in animal models (fish, chicks, monkeys, guinea pigs, tree shrews, and other species) have shown that there is a visually-guided emmetropization feedback mechanism that uses refractive error to guide axial elongation and achieve a match of the retinal location to the focal plane.13–17 In these species, as in most humans, eyes initially are hyperopic and achieve emmetropia by increasing the axial length until only a small hyperopia remains.18–21 The power distribution of the cornea, crystalline lens, and anterior chamber depth appear to be determined primarily by genetics and are not adjusted by visual guidance.22–25 It is primarily vitreous chamber depth, which is determined by the size and shape of the scleral shell, that is modulated by the emmetropization mechanism.26,27
In animal models, two visual conditions, minus-lens wear and form deprivation, have been used frequently to manipulate the emmetropization mechanism. A minus (negative-power) lens, held in place in front of an eye with a goggle frame, produces a hyperopic shift in the eye's refractive state, moving the focal plane behind the retinal photoreceptors. This creates a refractive target and triggers axial (vitreous chamber) elongation, which continues until the induced refractive error is eliminated. The eye elongates only until the increase in axial length reestablishes age-appropriate emmetropia with the lens in place. This process is described commonly as minus-lens compensation, and the myopia that is present when the lens is removed is referred to as lens-induced myopia (LIM). Form deprivation, produced with a translucent diffuser that eliminates focused images, creates an open-loop situation that causes the eye to maintain an increased elongation rate as long as the diffuser is in place. Measured with the diffuser removed, the eye has a form-deprivation myopia (FDM).
In minus lens (ML) and form deprivation (FD) treatments, the retina detects the hyperopic refractive state or the absence of focused visual images. Which retinal neurons are involved and how they encode the visual cues is not well understood. The net result, however, is that one or more neural signals are generated by the retinal neurons. Studies have shown that central communication via ganglion cell axons is not required.28–30 Rather, as shown schematically in Figure 1, the information can pass via a signaling cascade through the RPE and choroid to the sclera, where it produces biochemical remodeling of the scleral extracellular matrix.31,32 This, in the tree shrew, increases the viscoelasticity of the sclera,22 allowing normal IOP to elongate the eye.
Figure 1.

Information flow produced by three myopiagenic conditions (minus-lens wear, form deprivation, and dark treatment). Retinal neurons detect these stimuli, and generate signals that cascade through the RPE and choroid to produce remodeling in the sclera. The remodeled sclera has increased viscoelasticity that produces an increase in the axial elongation rate. The focus of this paper (central box) is the gene expression changes that occur in the sclera in response to these three visual conditions, including altered gene expression related to signaling, degradative enzymes and inhibitors, and extracellular matrix.
In addition to the two primary methods of inducing axial elongation and myopia in experimental animals, there is a third method—a period of continuous darkness. In juvenile tree shrews (diurnal, cone-dominated mammals closely related to primates) that have undergone emmetropization in standard animal colony conditions (100–300 lux on a light/dark cycle that establishes circadian rhythms),33 an 11-day period of continuous darkness induces an increase in axial elongation rate, an increase in scleral viscoelasticity, and a myopic shift in refraction. No significant changes are produced in corneal power, anterior segment depth, or lens thickness;19 the myopia, as in LIM and FDM, is due to vitreous chamber elongation.
Although minus-lens wear, form deprivation, and dark treatment produce similar increases in scleral viscoelasticity and axial elongation, studies have found that the way eyes respond to minus-lens wear and to form deprivation are not identical (He L, et al. IOVS 2011;52:ARVO E-Abstract 6301).34–36 Dark treatment has been studied in less detail, but appears to act more slowly than minus-lens wear or form deprivation, such that 11 days of dark treatment produce similar amounts of elongation and myopia as do 4 days of minus-lens wear or form deprivation.19 It is unknown if, or at what point in the signaling cascade, the signals produced by these different visual stimuli might merge to produce a similar scleral biomechanical response (Norton TT, et al. IOVS 2007;48:ARVO E-Abstract 1531)22 and an increase in axial elongation.
In this study we used these three different myopiagenic conditions to induce axial elongation and myopia, and examined the changes in scleral mRNA expression associated with each condition to ask whether the different visual conditions produced distinct scleral gene expression patterns. Dissimilar patterns would suggest that the differing retinal responses are preserved and passed through the signaling cascade to produce differing scleral responses. Similar scleral response patterns would suggest that the differing retinal responses to the visual conditions are, at some point in the signaling cascade, combined into a common “remodeling signal/response” before, or as, they reach the sclera.
Methods
Experimental Groups
The juvenile tree shrews (Tupaia glis belangeri) used in this study were produced in our breeding colony and raised by their mothers on a 14-hour light/10-hour dark cycle. Tree shrew pups open their eyes at approximately three weeks after birth. The day both eyes are open is the first day of visual experience (DVE). All procedures complied with the ARVO Statement for the Use of Animals in Ophthalmic and Visual Research, and were approved by the Institutional Animal Care and Use Committee of the University of Alabama at Birmingham. Experimental groups were balanced to include males and females, and avoided pups from the same parents wherever possible.
Six groups of animals (n = 7 per group) were used in this study (Fig. 2). Two minus-lens wear groups (ML-2 and ML-4) wore a monocular −5 D (spherical power) lens for either 2 or 4 days, starting at 24 ± 1 DVE. Two form deprivation groups (FD-2 and FD-4) wore a monocular translucent diffuser for either 2 or 4 days, also starting at 24 ± 1 DVE. Six of the seven animals in the ML-4 group also provided RNA for the “4-day −5 D lens wear group” reported by Gao et al.37 In all of these groups, the visual treatment induced myopia; the 4-day treatment duration was chosen to ensure that the sclera would be undergoing maximal remodeling when examined. The 2-day treatment duration was selected to examine earlier changes when the refractive changes had begun, but the axial length had changed only a little.22 In all ML and FD groups, the untreated fellow eye served as a control. The darkness (DK) group was kept in continuous darkness for 11 days, from 17 DVE until 28 DVE, because dark-induced elongation and myopia develop more slowly than ML or FD myopias.19 The treatment duration was intended to produce elongation and myopia that was nearly equivalent to the ML and FD groups. An age-matched (28 DVE) normal group also was studied.
Figure 2.
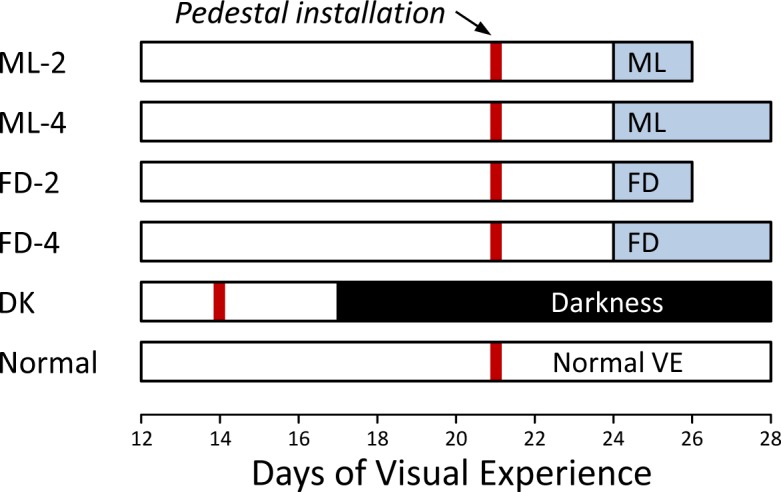
Experimental groups and duration of treatments. The red vertical bar indicates the point when a dental acrylic pedestal was installed under anesthesia. Filled regions indicate the type and duration of visual treatment. The right end of each bar indicates the time point when mRNA levels were measured.
Goggle Installation
Animals in all groups were anesthetized (17.5 mg ketamine, 1.2 mg xylazine, supplemented with 0.5%–2.0% isoflurane as needed) and received a dental acrylic pedestal following procedures described by Siegwart and Norton.38 In the ML, FD, and normal groups, the pedestal was installed at 21 ± 1 DVE (Fig. 2); in the DK group it was installed at 14 ± 1 DVE. After pedestal installation, all animals were placed in individual cages with standard colony fluorescent lighting, 100 to 300 lux on the floor of the cage. Three days later, in the ML and FD groups, a goggle frame holding either a −5 D lens (12 mm diameter PMMA contact lens; Conforma Contact Lenses, Norfolk, VA) or a translucent diffuser was clipped to the pedestal, firmly holding the lens/diffuser in front of the randomly selected treated eye. The control eye had unrestricted vision through an open goggle frame. Twice daily (approximately 9:30 AM and 4:30 PM), the goggles were briefly (<3 minutes) removed to clean the lens/diffuser under dim illumination. During goggle cleaning, animals were kept in a darkened nest box to minimize exposure to visual stimuli. Animals in the DK group began dark treatment 3 days after pedestal installation. The normal group received a pedestal at 21 DVE, but did not wear a goggle.
Refractive and Axial Measures
Noncycloplegic refractive measures were made, in awake animals, at the start and end of the treatment period with a Nidek ARK-700A infrared autorefractor (Marco Ophthalmic, Jacksonville, FL).39 The DK animals remained in darkness during the terminal refractive measures. Normal animals were measured just before euthanasia. Cycloplegic refractive measures were omitted to prevent any interference by atropine on retinoscleral signaling.40 However, previous studies have shown that noncycloplegic measures provide a valid estimate of the refractive state and of induced myopia in tree shrews. When compared, cycloplegic refractions are approximately 0.8 D hyperopic compared to noncycloplegic refractions in myopic, control, and normal eyes.39,41 Further, treated-eye versus control-eye differences are essentially identical between noncycloplegic and cycloplegic measures.41 All refractive values were corrected for the small eye artifact,42 previously shown to be approximately +4 D in tree shrews.39
At the time the pedestal was attached, ocular component dimensions were measured while under anesthesia with A-scan ultrasound, as described by Norton and McBrien,43 to ensure that the treated, control, and normal eyes did not differ significantly in axial length before treatment began. Posttreatment A-scan measures were not made to eliminate any possibility that the anesthesia required for the A-scan procedure might alter gene expression. In the ML-2 and FD-2 groups, posttreatment axial component measures were made with a Lenstar LS-900 optical biometer (Haag-Streit USA, Mason, OH). This instrument was placed into service after the ML-4, FD-4, and DK groups were completed, and allowed measures to be made quickly, in awake animals, before euthanasia. Comparison of A-scan and Lenstar measures of the vitreous chamber in 32 animals in this laboratory, with between −1 D and −12 D of induced myopia, showed that the axial differences measured with the Lenstar were very similar to those measured with A-scan ultrasound (data not shown).
Gene Expression Analysis
On completion of the final refractive measures, approximately 2 to 4 hours into the light phase, animals were terminally anesthetized (17.5 mg ketamine and 1.2 mg xylazine, followed by 50 mg xylazine); both eyes were enucleated and placed into RNAlater solution (Life Technologies, Carlsbad, CA). Extraocular muscles, conjunctiva, and orbital fat were trimmed from the exterior surface of the eye and the cornea dissected away along the corneoscleral junction. After removing the lens, vitreous humor, and optic nerve head, both surfaces of the sclera were scraped gently to remove the retina, RPE, choroid, and any residual extraocular tissue, before freezing the tissue in liquid nitrogen. Animals in the DK group were euthanized in the dark and the scleral tissue collected rapidly under minimal illumination.
Frozen sclera was pulverized to a fine powder in a chilled Teflon freezer mill (Sartorius Stedim, Bohemia, NY) from which total RNA was isolated using a RiboPure kit (Life Technologies) according to the manufacturer's instructions, with the addition of an on-filter DNase treatment. The purified RNA was quantified (NanoDrop Technologies, Wilmington, DE) and the quality confirmed by denaturing gel electrophoresis (RNA FlashGel; Lonza, Rockland, ME). cDNA was synthesized from 1 μg total RNA in a final reaction volume of 20 μL using a Superscript III RT kit (Life Technologies) with minor modifications (2.5 μM anchored oligo [dT]20 primers and DTT omitted). The resultant cDNA was diluted 5-fold and stored at −20°C until use.
Tree shrew-specific quantitative PCR (qPCR) primers were designed for 55 genes of interest (Table 1) and the reference gene RNA polymerase II (POLR2A) using Beacon Designer 7 (Premier Biosoft International, Palo Alto, CA). None of the treatment conditions affected the expression of the reference gene. Primer sequences, amplicon size, and efficiencies are listed in Supplementary Table S1. The selected candidate genes included representatives of three major groupings: signaling, metallopeptidases and TIMPs, and extracellular matrix (ECM) proteins. They were selected from genes that were found to change in previous studies of tree shrew sclera during LIM (He L, et al. IOVS 2010;51:ARVO E-Abstract 3681),37,44 along with additional genes that were suggested by studies in other species and by a whole-transcriptome analysis of three of the ML-4 animals. All primers were designed to work under the same cycling conditions. All amplicons were located within the coding region and most spanned at least one intron; amplicon identity was verified by gel electrophoresis and sequencing.
Table 1.
Genes Examined, Divided Into Functional Categories, With Cellular Location of the Protein Encoded by the Gene
|
Gene Symbol |
Protein Name |
Location |
| Signaling−cell surface receptors | ||
| ACVRL1 | Activin A receptor 2-like 1 | Cell surface |
| FGFR2 | FGF receptor 2 | Cell surface |
| NPR3 | Atrial natriuretic peptide receptor 3 | Cell surface |
| SDC2 | Syndecan 2 | Cell surface |
| TGFBR3 | TGF-β receptor III | Cell surface |
| TRPV4 | Transient receptor potential cation channel V4 | Cell surface |
| UNC5B | Netrin receptor UNC5B | Cell surface |
| EFNA1 | Ephrin A1 | Cell surface |
| Signaling−cytoskeleton related | ||
| ANXA1 | Annexin A1 | Cell surface |
| ANXA2 | Annexin A2 | Cell surface |
| CAPN2 | Calpain 2 | Cell surface |
| CAPNS1 | Calpain small subunit 1 | Cell surface |
| GJA1 | Connexin 43 | Cell surface |
| ACTA2 | Smooth muscle actin | Intracellular |
| NGEF | Ephexin 1 | Intracellular |
| Signaling−transcription regulators | ||
| HIF1A | Hypoxia-inducible factor 1α | Intracellular |
| RARB | Retinoic acid receptor β | Intracellular |
| RXRB | Retinoid X receptor β | Intracellular |
| VDR | Vitamin D receptor | Intracellular |
| Signaling−secreted | ||
| ANGPTL7 | Angiopoietin-related protein 7 | Extracellular |
| IGF1 | Insulin-like growth factor 1 | Extracellular |
| IGF2 | Insulin-like growth factor 2 | Extracellular |
| IL18 | Interleukin 18 | Extracellular |
| PENK | Proenkephalin A | Extracellular |
| TGFB1 | TGF-β1 | Extracellular |
| TGFB2 | TGF-β2 | Extracellular |
| TGFBI | TGF-β–induced protein | Extracellular |
| Signaling−matricellular | ||
| CTGF | Connective tissue growth factor | Extracellular |
| CYR61 | Protein CYR61 | Extracellular |
| FBLN1 | Fibulin 1 | Extracellular |
| NOV | Nephroblastoma overexpressed gene | Extracellular |
| SPARC | Secreted protein acidic and rich in cysteine | Extracellular |
| SPP1 | Osteopontin | Extracellular |
| THBS1 | Thrombospondin 1 | Extracellular |
| THBS2 | Thrombospondin 2 | Extracellular |
| TNC | Tenascin C | Extracellular |
| WISP1 | WNT1 inducible signaling pathway protein 1 | Extracellular |
| MPs/TIMPs | ||
| ADAMTS5 | ADAM metallopeptidase with thrombospondin motif, 5 | Extracellular |
| MMP2 | Matrix metallopeptidase 2 | Extracellular |
| MMP14 | Matrix metallopeptidase 14 | Cell surface |
| TIMP1 | TIMP metallopeptidase inhibitor 1 | Extracellular |
| TIMP2 | TIMP metallopeptidase inhibitor 2 | Extracellular |
| TIMP3 | TIMP metallopeptidase inhibitor 3 | Extracellular |
| Extracellular matrix−collagens | ||
| COL1A1 | Collagen type I, α1 | Extracellular |
| COL12A1 | Collagen type XII, α1 | Extracellular |
| COL14A1 | Collagen type XIV, α1 | Extracellular |
| Extracellular matrix−proteoglycans | ||
| ACAN | Aggrecan | Extracellular |
| DCN | Decorin | Extracellular |
| FMOD | Fibromodulin | Extracellular |
| KERA | Keratocan | Extracellular |
| NYX | Nyctalopin | Extracellular |
| OGN | Mimecan | Extracellular |
| PRELP | Prolargin | Extracellular |
| Extracellular matrix−other | ||
| HS6ST1 | Heparan-sulfate 6-O-sulfotransferase 1 | Cell surface |
| SERPINH1 | Serpin H1 | Intracellular |
Relative gene expression was measured by qPCR on a StepOnePlus Real-Time PCR System using Power SYBR Green PCR Master Mix (both Life Technologies). Reactions were performed in triplicate in a 15 μL volume containing 300 nM each primer and 0.4 μL cDNA template. Cycling parameters were the same for all assays: initial denaturation at 95°C for 10 minutes, followed by 40 cycles of 95°C for 15 seconds, 62°C for 60 seconds. Single gene products were obtained for all reactions as assessed by melt curve analysis. Relative gene expression was calculated using the ΔΔCt method45 first to normalize the expression level of the target gene to that of the reference gene, and then to compare the relative expression of the target gene for treated versus control eyes, treated versus normal eyes, and control versus normal eyes. The geometric group mean (for the 7 biological replicates) of these expression ratios was used to calculate the fold change in gene expression for each of the target genes.
Statistical Analysis
Paired t-tests were used to assess treated versus control eye differences; unpaired t-tests were used to test for differences between all independent groups; P < 0.05 was considered significant and no adjustment for possible false discovery rate was applied (see Discussion). One-way ANOVA (Statistica, Statsoft, Tulsa, OK) was used to compare refractive data across groups of animals. Linear regressions between expression differences were made in SigmaPlot (Systat Software, San Jose, CA).
Results
Refraction
The refractive changes produced by the three visual treatments are shown in Figure 3. As expected in tree shrews of this age, both eyes of the normal group were slightly hyperopic (right eyes, 1.4 ± 0.3 D; left eyes, 1.3 ± 0.3 D; mean ± SEM). After 2 days of treatment, the treated eyes of the ML-2 and FD-2 groups showed small, statistically significant myopic shifts (treated eyes–control eyes); the ML-2–treated eyes were −1.0 ± 0.2 D myopic in comparison with the control eyes, and the FD-2 treated eyes were −1.9 ± 0.2 D myopic. After 4 days of treatment, the myopic shift in the ML-4 group was −2.8 ± 0.3 D, while in the FD-4 group it was −3.2 ± 0.3 D; both were statistically significant. After 11 days of dark treatment, the refractions in the DK group were right eyes −2.6 ± 0.4 D and left eyes −2.5 ± 0.7 D. The difference (−3.9 ± 0.6 D) between the normal eyes (right and left eyes averaged, 1.4 ± 0.3 D) and the DK eyes (right and left eyes averaged, −2.6 ± 0.5 D) was statistically significant. The control eyes in the ML and FD groups did not differ significantly from the normal eyes (1-way ANOVA, P = 0.76). Note that the treated eyes in the ML-4 group had not fully compensated for the −5 D lens and, thus, still were actively elongating, as were the treated eyes in the FD-4 group and both eyes in the darkness group. Ocular component dimensions, measured with the Lenstar in the ML-2 and FD-2 groups, confirmed that the vitreous chamber of the treated eyes had elongated slightly, relative to the control eyes, by 0.016 ± 0.004 mm (ML-2) and by 0.038 ± 0.011 mm (FD-2). Although the axial changes were not measured in the other animals, the results of previous studies in tree shrews make it reasonable to assume that the myopic shifts after 4 days of ML or FD and 11 days of DK were due to an increase in vitreous chamber depth of approximately 0.060 to 0.075 mm.46–48
Figure 3.

End-of-treatment refractive measures for the normal, ML, FD, and DK groups. Values are the mean refraction ± SEM for the right (R) and left (L) eyes of the normal and DK groups, and for the treated (T) and control (C) eyes of the ML and FD groups. Treated eyes in all groups were significantly myopic relative to control (or normal) eyes.
Gene Expression
Normal Left Versus Right Eye Differences.
Figure 4A compares the gene expression in the right and left eyes of the normal animals, measured at 28 DVE. The fold differences (without regard to sign) were very small (1.11- ± 0.08-fold; mean ± SD) and only one of the genes in our sample, the α chain of type 1 collagen (COL1A1), was significantly different between left and right eyes (1.17 ± 0.05, P = 0.0208).
Figure 4.

Gene expression fold differences. (A) Normal eyes (right eyes versus left eyes). (B) 2 days of minus-lens wear (treated eyes versus control eyes). (C) 2 days of form deprivation (treated eyes versus control eyes). Filled bars represent statistically significant differences between the treated and control eyes (P < 0.05). Bar color is arbitrary and intended to help in comparing the same gene in the three different conditions. Error bars indicate SEM. In (B), the off-scale fold difference for NPR3 (−7.66) is indicated next to the bar.
Differential Effects–Treated Versus Control Eyes.
2-Day Treatments.
The fold differences in gene expression between the treated and control eyes in the ML and FD groups after 2 days of monocular treatment are shown in Figures 4B and 4C; expression values also are listed in Table 2. In both treatments, a pattern of gene expression differences had developed. As in previous studies of scleral gene expression in the eyes of trees shrews that were developing induced myopia (He L, et al. IOVS 2010;51:ARVO E-Abstract 3681),37,44 most of the sampled genes were downregulated in the treated eyes, relative to the control eyes. In the ML-2 group, all 27 of the genes that were significantly different between the two eyes were downregulated in the treated eyes. In the FD-2 group, 16 of the same genes were downregulated; only one gene was upregulated: the membrane-bound degradative enzyme, MMP14. The variability in expression across animals within each group was low, as evidenced by the small SEM values.
Table 2.
Gene Expression Differences Comparing Treated Versus Control and Treated Versus Normal Eyes
Unless otherwise indicated, expression difference not statistically significant. Red text indicates significant downregulation. Blue text indicates significant upregulation.
It is evident from examination of Figures 4B and 4C that the pattern of differential gene expression is very similar in the ML-2 and FD-2 groups across these 55 genes. The two patterns (Figs. 4B versus 4C) are compared quantitatively in Figure 5, which plots the fold differences in the ML-2 group (Fig. 4B) against those in the FD-2 group (Fig. 4C). The correlation was very high (r2 of 0.90, P < 0.001) with no outliers, suggesting that the examined genes responded in a way similar to these two different myopiagenic visual conditions, not only in terms of which genes showed significant differential expression, but also the magnitude of the fold changes.
Figure 5.

Comparison of the gene expression differences (treated eye versus control eye) in Figure 4B (ML-2) with the differences in Figure 4C (FD-2). The amount of differential expression in both conditions was very similar. Stars: significant fold differences for both ML and FD. Triangles: significant fold differences only for ML. Squares: significant fold differences only for FD. Circles: fold differences not significant in either treatment.
4-Day Treatments.
Figure 6 shows the fold differences in gene expression between the treated and control eyes in the ML (Fig. 6A) and FD (Fig. 6B) groups after 4 days of monocular treatment, and the DK group (Fig. 6C) after 11 days of dark treatment. Because both eyes in the DK group were in darkness, there was not an untreated control eye. Therefore, the mean gene expression of the right and left DK eyes was compared to the control eyes of the ML-4 group. Expression values also are listed in Table 2. The pattern in all three treatments is very similar; 31 genes were significantly downregulated in the ML-4–treated eyes and three were upregulated. Twenty-nine of the same genes (26 down- and 3 upregulated) and 6 additional genes (all downregulated) were significantly affected in the FD-4 group.
Figure 6.

Gene expression fold differences. (A) 4 days of minus-lens wear (treated eyes versus control eyes). (B) 4 days of form deprivation (treated eyes versus control eyes). (C) 11 days of dark treatment (mean right and left versus ML-4 control eyes).
The patterns seen in Figure 6 are compared in Figure 7. Figure 7A compares the pattern in Figures 6A (ML-4) and 6B (FD-4); Figure 7B compares the pattern in Figure 6A (ML-4) to that in Figure 6C (DK). As was the case for the 2-day ML and FD treatments, the response patterns after 4 days in the ML and FD groups (Fig. 7A) were highly correlated (Fig. 7A, r2 = 0.95, P < 0.001). Downregulated genes included ones for signaling molecules (cell surface receptors, cytoskeletal related proteins, transcription regulators, secreted signal proteins, matricellular proteins), for TIMPs, collagens, and proteoglycans. The upregulated genes included two in the signaling group (FBLN1, TGFBI) and one in the metallopeptidase group (MMP14).
Figure 7.

Comparison of the treated versus control gene expression differences in Figure 6. (A) ML-4 (Fig. 6A) versus FD-4 (Fig. 6B). (B) ML-4 (Fig. 6A) versus 11 days of continuous darkness (Fig. 6C). Stars: significant fold differences for both treatments. Triangles: significant fold differences only for ML-4. Squares: significant fold differences only for FD-4 (A) or DK (B). Circles: fold differences not significant for either treatment.
When the DK group (mean of right and left eyes) was compared to the control eyes of the ML-4 group (Fig. 6C) the direction and magnitude of the gene expression patterns were similar to those of the ML-4 and FD-4 groups, but differed in two ways: (1) fewer of the differences were statistically significant, which may reflect the fact that independent groups were compared, rather than treated and control eyes within animals, and (2) one gene in the DK group, PENK, showed a very large downregulation (−29.27-fold). In other respects, there was a pattern of gene expression similar to the ML-4 group (r2 = 0.82, P < 0.001, excluding PENK). When the pattern in Figure 6B (FD-4) was compared to that in Figure 6C (DK), the result was nearly identical to that shown in Figure 7B (r2 = 0.80, P < 0.001, excluding PENK).
Comparison of 2-Day Versus 4-Day Treatments.
The degree to which the pattern of gene expression differences that had emerged after 2 days of treatment was similar to that after 4 days of treatment is examined in Figure 8 for the ML (Fig. 8A) and FD (Fig. 8B) groups. In general, the patterns after 2 and 4 days of treatment are similar for both types of treatment in that the differential expression of all genes moved in the same direction after 4 days as after 2 days. Several genes, however, showed significant expression differences after 2 days of treatment that were not statistically different after 4 days (Table 2). For ML and FD treatments, genes that followed this pattern included a secreted protein (TGFBI), matricellular proteins (FBLN1, SPARC, and TNC), and proteoglycan core proteins (FMOD and NYX). For the ML treatment, five additional genes not significantly different at 2 days were significantly different at 4 days (DCN, KERA, MMP14, RARB, and SDC2). For the FD treatment, 12 additional genes not significantly different after 2 days of treatment were significantly different after 4 days (ANXA1, CAPN2, COL1A1, COL12A1, FGFR2, NOV, OGN, PRELP, SERPINH1, TGFB1, THBS1, and VDR).
Figure 8.

Comparison of the 4-day (Fig. 6) versus 2-day (Fig. 4) treated versus control gene expression differences produced by (A) minus-lens wear (Figs. 6A versus 4B) and (B) form deprivation (Figs. 6B versus 4C). Stars: significant fold differences for both 2- and 4-day treatments. Triangles: significant fold differences only for 4-day. Squares: significant fold differences only for 2-day. Circles: fold differences not significant at either treatment duration.
Treated Eyes Versus Normal Eyes.
Previous studies in tree shrews and other species have found refractive or mRNA changes in the control eyes that might affect treated versus control eye comparisons (Rucker FJ, et al. IOVS 2009;50:ARVO E-Abstract 3931).37,49,50 To examine the effect of treatments specifically on the treated eyes, we compared gene expression in the treated eyes of the ML-4, FD-4, and DK groups with expression in the age-matched normal eyes (28 DVE). This comparison examined the effect on gene expression in the treated eye alone. It also allowed the treated eyes in all three treatment conditions to be compared to a common reference. Figure 9 shows the fold difference in mRNA expression levels in the treated eyes versus normal eyes for the ML-4 (Fig. 9A), FD-4 (Fig. 9B), and DK groups (Fig. 9C); the expression difference values are presented in Table 2. Overall, the pattern in this figure is similar to that in Figure 6, suggesting that the treated versus control eye differences were primarily due to changes in the treated eyes. Indeed, when control-eye gene expression was compared to normal eyes, only two control-eye genes in the ML-4 group were significantly different from normal (NPR3 and RARB), five control-eye genes in the FD-4 group were significantly different from normal (ADAMTS5, IGF2, RARB, RXRB, and WISP1).
Figure 9.

Gene expression fold differences. (A) 4 days of minus-lens wear (treated eyes versus normal eyes). (B) 4 days of form deprivation (treated eyes versus normal eyes). (C) 11 days of dark treatment (mean right and left versus normal eyes).
The treated-eyes versus normal eyes patterns seen in Figure 9 are compared in Figure 10. Figure 10A compares the pattern in Figures 9A (ML-4) and 9B (FD-4); Figure 10B compares the pattern in Figure 9A (ML-4) to that in Figure 9C (DK). The response patterns after 4 days in the ML, FD, and DK groups were highly correlated. The correlations between the ML and FD groups (r2 of 0.67, P < 0.001) and the ML and DK groups (r2 = 0.76, P <0.001, excluding PENK) were similar to each other and to the correlation comparing treated with control eyes (Fig. 7). When the pattern in Figure 9B (FD-4) was compared to that in Figure 9C (DK), the result was nearly identical to that shown in Figure 10B (r2 = 0.78, P <0.001, excluding PENK).
Figure 10.

Comparison of gene expression patterns in the treated eyes of ML, FD, and DK with normal eyes as a common reference (Fig. 9). (A) minus-lens wear compared to form deprivation (Figs. 9A versus 9B). (B) minus-lens wear compared to continuous darkness (Figs. 9A versus 9C). Because the DK group treatment was binocular, the fold difference for DK eyes is the mean of values of the right and left eyes.
Discussion
The scleral gene expression patterns produced by the three myopiagenic visual conditions were very similar in terms of which genes were affected, as well as the direction and relative magnitude of each gene's response. Thus, it appears that scleral fibroblast expression of specific genes is controlled tightly when the emmetropization mechanism calls for an increase in axial elongation, even if the visual stimuli that initiate the signaling cascade are very different. In particular, the gene expression changes in the ML-4 and FD-4 groups (Fig. 7) were as close to identical (r2 = 0.95, slope = 0.86) as could be expected comparing the patterns in two groups, each containing seven animals that responded similarly, but not identically, to the visual conditions. The slightly lower correlation between the DK group and ML-4 group (r2 = 0.82, slope = 0.91, excluding PENK) may occur because the comparisons are made between eyes in different groups of animals, rather than between treated and control eyes in the same animal that normally have very similar gene expression (Fig. 4A).
When the treated eye mRNA levels in the ML-4, FD-4, and DK groups were compared to the expression in the age-matched normal group, the scleral remodeling signatures (Figs. 9, 10) were similar to the treated eye versus control eye patterns, confirming that most of the altered mRNA expression occurred in the treated eyes. Taken together, the similarity of the gene expression differences in our sample of 55 genes, produced by the three different myopiagenic conditions, lead us to conclude that these are part of a “scleral remodeling signature” that results in increased viscoelasticity and the axial (vitreous chamber) elongation that produces the myopia.
A single remodeling signature that does not differentiate between the visual conditions that produce it is consistent with the fact that all three visual conditions produce a similar increase in scleral creep rate that is related closely to the increase in vitreous chamber elongation and the myopic shift in refractive state (Norton TT, et al. IOVS 2007;48:ARVO E-Abstract 1531).22 Although there are undoubtedly differences in the patterns of retinal neural activity generated by these very different visual conditions, and there may be differences in the signaling pathways at the level of the RPE and choroid (He L, et al. IOVS 2013;54:ARVO E-Abstract 3675), these data show that by the time the signaling cascade has reached the scleral fibroblasts, the signals have converged to produce a common response by the scleral fibroblasts.
Development of the Gene Expression Signature
The availability of mRNA data from animals after 2 days of ML and FD treatment, when there has been little refractive or axial change, allowed us to examine the development of the gene expression signatures by comparing the patterns to those that were found after 4 days of treatment, when larger refractive (and presumably axial) changes had occurred. This allowed us to learn whether the signatures developed at the same pace in both visual conditions and also the extent to which the signature was related to the amount of elongation and myopia.
A previous study that examined a subset of these genes after 1 day of ML treatment found very few differences between the treated and control eyes.37 In our study, the two-day (ML-2 and FD-2) patterns generally were similar to the 4-day patterns (Fig. 8). The lower slopes (ML, 0.88; FD, 0.70) suggest that the magnitude of the mRNA differences after 2 days was less than after 4 days. This is consistent with the fold differences increasing in magnitude as a function of time, and is in agreement with measures of scleral viscoelasticity (creep rate), which is elevated after 2 days of ML or FD treatment, and is elevated more strongly after 4 days.22 Paradoxically, the amount of myopia that developed in the FD-2 group was larger than the amount in the ML-2 group, yet there were fewer large fold differences in the FD-2 group than in the ML-2 group (Fig. 5, slope = 0.65).
Comparison of the 2-day and 4-day patterns (Figs. 8A, 8B) also may help to distinguish gene expression changes that primarily are due to signals from the choroid versus changes that may occur in response to the gradual elongation of the globe. It is well known that fibroblasts can respond to mechanical deformation with changes in gene expression.51–53 The altered mechanical tension on the fibroblasts after 4 days of axial elongation may have provided mechanical stimulation. Thus, some of the gene expression differences in our study that occurred after 4 days, but were absent at 2 days, may have been related to mechanical effects of axial elongation, rather than to signals arriving from choroid; changes that occurred after 2 days were less likely to result from intrascleral changes. However, the gene expression differences after 2 days generally involved the same genes and the expression changes were in the same direction, but of smaller magnitude, as found after 4 days (Table 2). Four genes also were involved with cell-surface receptors (ACVRL1, TRPV4, and UNC5B) and cytoskeleton (CAPN2) that showed significant downregulation after 2 days of ML treatment, but nonsignificant downregulation after 4 days of ML treatment (Table 2). Changes in these genes may comprise early signaling into the sclera that initiate remodeling, but are not involved in the sustained remodeling process.
We asked if the same scleral gene expression signature has been found in cell culture, particularly in studies that subjected fibroblasts in cell culture to mechanical deformation and found changes due to the mechanical deformation itself, in the absence of potential signals arriving from another structure.54–59 However, the overall patterns in these studies do not duplicate, or even closely resemble, the pattern we have found, suggesting that the scleral response signature we found may be uniquely produced by (unknown) molecules arriving from the choroid with, perhaps, some additional changes due to the elongated axial length.
Gene Expression Differences
The focus of this study was to learn whether the sclera responded with the same remodeling response in reaction to different myopiagenic stimuli. The genes that were selected encode proteins that represent a wide range of functions, with a focus on ones involved in cell signaling. The 22 genes that had been examined in previous studies of tree shrew sclera generally responded as found previously (He L, et al. IOVS 2010;51:ARVO E-Abstract 3681).37,60 Of the 33 newly-examined genes, most showed downregulation. As we found previously, the differences in gene expression produced in the sclera generally were small, mostly less than 4-fold, with the exception of PENK, which showed a huge (−29.27-fold) unexplained binocular downregulation in the dark-treated group, compared to ML-4 control eyes.
The general pattern of downregulation is consistent with prior reports that during myopia development there is a small loss of scleral ECM, including a reduction in dry weight (approximately 3% to 5%), a small loss of collagen, hyaluronan, and glycosaminoglycans.32,61,62 It is of interest that there appeared to be selective regulation of gene expression within each of the functional groupings. Some genes within a group showed (relatively) strong differences in expression (such as NPR3, Table 2), while others (such as TGFBR3) appeared unaffected. Amongst the genes coding for matricellular proteins, most were downregulated, whereas one (FBLN1) showed upregulation. Whatever molecules, presumably arriving from choroid,63,64 produce the scleral remodeling signature, they produce effects on the expression of some mRNAs, but not others within the same class.
The differences in scleral mRNA expression, while consistent, do not directly reveal the identity of the molecule or molecules that initiate the remodeling process. However, the scleral remodeling signature found in this study could allow application of various candidate choroidal signaling molecules to scleral organ culture to learn if, either singly or in combination, they reproduce this remodeling signature.
Statistical Significance
As noted in the Methods, we assessed whether expression differences were statistically significant by applying either a paired (dependent) t-test for treated and control eyes in the same animal, or an independent t-test for eyes that were in different animals. We did not apply a correction for false discovery rate for two primary reasons. When the mRNA levels were compared between the left and right eyes of the normal animals (Fig. 4A), the fold differences and the SEMs were very small. One gene, COL1A1, had mRNA levels 1.17-fold higher in the right eyes and, because the variability in the group was small (1.11 ± 0.08, mean ± SD), the difference was statistically significant. Thus, normally, the mRNA levels in the right and left eyes are very close to identical in the 55 genes that were examined and provide a baseline against which the substantial alterations in mRNA levels could be assessed.
In addition, 2 and 4 days of ML or FD produced nearly universal downregulation of the sampled genes in the treated eyes, including ones that were significant by our t-tests and ones that were not (unfilled bars in Figs. 4, 6, 9). These “nonsignificant” mRNA levels clearly differed from the normally very similar levels in right and left eyes. Further, the pattern of differential expression was very similar across visual conditions and time-points, suggesting that the expression differences are repeatable and meaningful, whether or not the P value was less than the α of 0.05. When we examined the correlation between the visual conditions (Figs. 8A, 8B) using only the genes whose expression differences did not reach our criterion for statistical significance, the correlation among these “nonsignificant” expression differences also was statistically significant, with slopes that were very similar to the overall pattern. This suggests that there were differences in gene expression that, even when they did not meet our preselected α, were consistent across visual conditions, both after 2 and 4 days of treatment. Thus, it appears in our study, that an α of 0.05 actually may have been more conservative than needed.
Limitations
It is important to note that the remodeling signature reported here is the pattern of mRNA changes for 55 genes for which we developed primers for quantitative PCR. The expression levels of many other genes that we did not measure are likely involved in altering the biomechanical properties of the sclera. RNA-Seq (whole-transcriptome) analysis of treated and control eyes from three of the ML-4 animals suggests that perhaps 400 to 500 genes (of the more than 20,000 transcripts found to be expressed in sclera; Frost MR, et al. IOVS 2012;53:ARVO E-Abstract 3452) may be up- or downregulated by at least 1.20-fold, with approximately equal numbers changing in each direction (Frost MR, personal communication, 2013). The results of our study, along with the RNA-Seq analysis, serve as a reminder that gene expression is a complex and interactive process. Although these data show highly specific control of gene expression, a change in one or two genes in isolation may not provide a good picture of the overall process, and may reflect indirect downstream influences as well as direct responses to the signaling cascade.
We recognize that changes in mRNA levels may, or may not, produce changes in protein levels, and that proteins are the “effectors” that actually produce the scleral remodeling. We previously have examined changes in protein expression after 4 days of minus-lens wear and after 4 days of recovery from minus-lens wear to address protein levels directly.49 There were 14 genes whose protein abundance levels were found to differ significantly in the sclera after 4 days of minus-lens wear37,49 whose mRNA expression also was analyzed in our study. The correlation between the mRNA and protein differential expression was not statistically significant (r2 = 0.16, P > 0.05). This was not surprising; the correlation between mRNA and protein abundances in complex biological samples typically is poor.65–68 This is because mRNA levels reflect the activity of cells at the time the sample is collected whereas protein levels reflect the cumulative activity of synthetic and degradative processes over time, influenced by a large repertoire of systems that enhance or repress the synthesis of proteins from a specific copy number of mRNA transcripts. In our study, our focus was to learn if the scleral fibroblasts respond differently to the three different myopiagenic visual conditions. The changes in mRNA levels, as found in this study and others,37,60,69 provide a useful way to examine, and compare, the way cells respond to signals. Because the mRNA responses to the three different visual conditions are so similar, it is likely that any changes in protein levels also would be similar.
In summary, when retinally-generated signals coding an increase in axial elongation reach the sclera, the scleral fibroblasts respond with a “scleral remodeling gene expression signature” that does not distinguish between the type of visual stimulus that initiates the signaling cascade. At what point in the signaling cascade the initially very different retinal activity is integrated into a common pathway is unclear. This may have occurred by the level of the choroid, based on the fact that similar thinning of the choroid occurs in response to both form deprivation and minus-lens wear.70 However, this integration also could occur as the signals pass through the RPE. Although these scleral fibroblast responses do not specifically identify the signaling molecules that initiate the changes in gene expression, they do suggest that the sclera might become a therapeutic target for controlling axial elongation without affecting vision. Agents that selectively suppress the changes in gene expression might be applied subconjunctivally to suppress the remodeling, prevent the increase in viscoelasticity, and, thus, control axial elongation and the development of myopia.
Supplementary Material
Acknowledgments
This work was performed in partial fulfillment of the requirements for the degree of Doctor of Philosophy at the University of Alabama at Birmingham (LG). Preliminary results were presented as an ARVO abstract: Guo L, et al. IOVS 2011;52:ARVO E-Abstract 6299.
Supported by National Institutes of Health Grants EY005922 and EY003039 (P30).
Disclosure: L. Guo, None; M.R. Frost, None; L. He, None; J.T. Siegwart Jr, None; T.T. Norton, None
References
- 1. Sperduto RD, Seigel D, Roberts J, Rowland M. Prevalence of myopia in the United States. Arch Ophthalmol. 1983; 101: 405–407 [DOI] [PubMed] [Google Scholar]
- 2. Fledelius HC. Myopia prevalence in Scandinavia. A survey, with emphasis on factors of relevance for epidemiological refraction studies in general. Acta Ophthalmol Suppl. 1988; 185: 44–50 [DOI] [PubMed] [Google Scholar]
- 3. Wang Q, Klein BE, Klein R, Moss SE. Refractive status in the Beaver Dam Eye Study. Invest Ophthalmol Vis Sci. 1994; 35: 4344–4347 [PubMed] [Google Scholar]
- 4. Attebo K, Ivers RQ, Mitchell P. Refractive errors in an older population: the Blue Mountains Eye Study. Ophthalmology. 1999; 106: 1066–1072 [DOI] [PubMed] [Google Scholar]
- 5. Wensor M, McCarty CA, Taylor HR. Prevalence and risk factors of myopia in Victoria, Australia. Arch Ophthalmol. 1999; 117: 658–663 [DOI] [PubMed] [Google Scholar]
- 6. Goh WSH, Lam CSY. Changes in refractive trends and optical components of Hong Kong Chinese aged 19-39 years. Ophthalmic Physiol Opt. 1994; 14: 378–382 [PubMed] [Google Scholar]
- 7. Lin LL, Shih YF, Tsai CB, et al. Epidemiologic study of ocular refraction among schoolchildren in Taiwan in 1995. Optom Vis Sci. 1999; 76: 275–281 [DOI] [PubMed] [Google Scholar]
- 8. Lu B, Congdon N, Liu X, et al. Associations between near work, outdoor activity, and myopia among adolescent students in rural China: the Xichang Pediatric Refractive Error Study report no. 2. Arch Ophthalmol. 2009; 127: 769–775 [DOI] [PubMed] [Google Scholar]
- 9. Quek TP, Chua CG, Chong CS, et al. Prevalence of refractive errors in teenage high school students in Singapore. Ophthalmic Physiol Opt. 2004; 24: 47–55 [DOI] [PubMed] [Google Scholar]
- 10. Jung SK, Lee JH, Kakizaki H, Jee D. Prevalence of myopia and its association with body stature and educational level in 19-year-old male conscripts in Seoul, South Korea. Invest Ophthalmol Vis Sci. 2012; 53: 5579–5583 [DOI] [PubMed] [Google Scholar]
- 11. Zadnik K. Myopia development in childhood. Optom Vis Sci. 1997; 74: 603–608 [PubMed] [Google Scholar]
- 12. Gwiazda J, Hyman L, Hussein M, et al. A randomized clinical trial of progressive addition lenses versus single vision lenses on the progression of myopia in children. Invest Ophthalmol Vis Sci. 2003; 44: 1492–1500 [DOI] [PubMed] [Google Scholar]
- 13. Shen W, Sivak JG. Eyes of a lower vertebrate are susceptible to the visual environment. Invest Ophthalmol Vis Sci. 2007; 48: 4829–4837 [DOI] [PubMed] [Google Scholar]
- 14. Schaeffel F, Glasser A, Howland HC. Accommodation, refractive error and eye growth in chickens. Vision Res. 1988; 28: 639–657 [DOI] [PubMed] [Google Scholar]
- 15. Smith EL III, Hung LF, Harwerth RS. Developmental visual system anomalies and the limits of emmetropization. Ophthalmic Physiol Opt. 1999; 19: 90–102 [PubMed] [Google Scholar]
- 16. Troilo D, Nickla DL, Wildsoet CF. Form deprivation myopia in mature common marmosets (Callithrix jacchus). Invest Ophthalmol Vis Sci. 2000; 41: 2043–2049 [PubMed] [Google Scholar]
- 17. Norton TT, Amedo AO, Siegwart JT Jr. The effect of age on compensation for a negative lens and recovery from lens-induced myopia in tree shrews (Tupaia glis belangeri). Vision Res. 2010; 50: 564–576 [DOI] [PMC free article] [PubMed] [Google Scholar]
- 18. Pickett-Seltner RL, Sivak JG, Paternak JJ. Experimentally induced myopia in chicks: morphometric and biochemical analysis during the first 14 days after hatching. Vision Res. 1988; 28: 323–328 [DOI] [PubMed] [Google Scholar]
- 19. Norton TT, Amedo AO, Siegwart JT Jr. Darkness causes myopia in visually experienced tree shrews. Invest Ophthalmol Vis Sci. 2006; 47: 4700–4707 [DOI] [PMC free article] [PubMed] [Google Scholar]
- 20. Bradley DV, Fernandes A, Lynn M, Tigges M, Boothe RG. Emmetropization in the rhesus monkey (Macaca mulatta): birth to young adulthood. Invest Ophthalmol Vis Sci. 1999; 40: 214–229 [PubMed] [Google Scholar]
- 21. Troilo D, Judge SJ. Ocular development and visual deprivation myopia in the common marmoset (Callithrix jacchus). Vision Res. 1993; 33: 1311–1324 [DOI] [PubMed] [Google Scholar]
- 22. Siegwart JT Jr, Norton TT. Regulation of the mechanical properties of tree shrew sclera by the visual environment. Vision Res. 1999; 39: 387–407 [DOI] [PubMed] [Google Scholar]
- 23. Sorsby A, Leary GA, Fraser GR. Family studies on ocular refraction and its components. J Med Genet. 1966; 3: 269–273 [DOI] [PMC free article] [PubMed] [Google Scholar]
- 24. Qiao-Grider Y, Hung LF, Kee CS, Ramamirtham R, Smith EL III. Nature of the refractive errors in rhesus monkeys (Macaca mulatta) with experimentally induced ametropias. Vision Res. 2010; 50: 1867–1881 [DOI] [PMC free article] [PubMed] [Google Scholar]
- 25. Stenström S, Woolf D. Investigation of the variation and the correlation of the optical elements of human eyes. Am J Optom Arch Am Acad Optom. 1948; 25: 218–232 [PubMed] [Google Scholar]
- 26. Norton TT. Animal models of myopia: learning how vision controls the size of the eye. ILAR J. 1999; 40: 59–77 [DOI] [PubMed] [Google Scholar]
- 27. Summers Rada JA, Shelton S, Norton TT The sclera and myopia. Exp Eye Res. 2006; 82: 185–200 [DOI] [PubMed] [Google Scholar]
- 28. Norton TT, Essinger JA, McBrien NA. Lid-suture myopia in tree shrews with retinal ganglion cell blockade. Vis Neurosci. 1994; 11: 143–153 [DOI] [PubMed] [Google Scholar]
- 29. Troilo D, Gottlieb MD, Wallman J. Visual deprivation causes myopia in chicks with optic nerve section. Curr Eye Res. 1987; 6: 993–999 [DOI] [PubMed] [Google Scholar]
- 30. Raviola E, Wiesel TN. An animal model of myopia. N Engl J Med. 1985; 312: 1609–1615 [DOI] [PubMed] [Google Scholar]
- 31. Rada JA, Thoft RA, Hassell JR. Increased aggrecan (cartilage proteoglycan) production in the sclera of myopic chicks. Dev Biol. 1991; 147: 303–312 [DOI] [PubMed] [Google Scholar]
- 32. Norton TT, Rada JA. Reduced extracellular matrix accumulation in mammalian sclera with induced myopia. Vision Res. 1995; 35: 1271–1281 [DOI] [PubMed] [Google Scholar]
- 33. Meijer JH, Daan S, Overkamp GJ, Hermann PM. The two-oscillator circadian system of tree shrews (Tupaia belangeri) and its response to light and dark pulses. J Biol Rhythms. 1990; 5: 1–16 [DOI] [PubMed] [Google Scholar]
- 34. Bartmann M, Schaeffel F, Hagel G, Zrenner E. Constant light affects retinal dopamine levels and blocks deprivation myopia but not lens-induced refractive errors in chickens. Vis Neurosci. 1994; 11: 199–208 [DOI] [PubMed] [Google Scholar]
- 35. Schaeffel F, Hagel G, Bartmann M, Kohler K, Zrenner E. 6-Hydroxy dopamine does not affect lens-induced refractive errors but suppresses deprivation myopia. Vision Res. 1994; 34: 143–149 [DOI] [PubMed] [Google Scholar]
- 36. Kee CS, Marzani D, Wallman J. Differences in time course and visual requirements of ocular responses to lenses and diffusers. Invest Ophthalmol Vis Sci. 2001; 42: 575–583 [PubMed] [Google Scholar]
- 37. Gao H, Frost MR, Siegwart JT Jr, Norton TT. Patterns of mRNA and protein expression during minus-lens compensation and recovery in tree shrew sclera. Mol Vis. 2011; 17: 903–919 [PMC free article] [PubMed] [Google Scholar]
- 38. Siegwart JT, Norton TT. Goggles for controlling the visual environment of small animals. Lab Animal Sci. 1994; 44: 292–294 [PubMed] [Google Scholar]
- 39. Norton TT, Wu WW, Siegwart JT Jr. Refractive state of tree shrew eyes measured with cortical visual evoked potentials. Optom Vis Sci. 2003; 80: 623–631 [DOI] [PMC free article] [PubMed] [Google Scholar]
- 40. McKanna JA, Casagrande VA. Atropine affects lid-suture myopia development. Doc Ophthalmol Proc Ser. 1981; 28: 187–192 [Google Scholar]
- 41. Norton TT, Siegwart JT Jr, Amedo AO. Effectiveness of hyperopic defocus, minimal defocus, or myopic defocus in competition with a myopiagenic stimulus in tree shrew eyes. Invest Ophthalmol Vis Sci. 2006; 47: 4687–4699 [DOI] [PMC free article] [PubMed] [Google Scholar]
- 42. Glickstein M, Millodot M. Retinoscopy and eye size. Science. 1970; 168: 605–606 [DOI] [PubMed] [Google Scholar]
- 43. Norton TT, McBrien NA. Normal development of refractive state and ocular component dimensions in the tree shrew (Tupaia belangeri). Vision Res. 1992; 32: 833–842 [DOI] [PubMed] [Google Scholar]
- 44. Siegwart JT Jr, Strang CE. Selective modulation of scleral proteoglycan mRNA levels during minus lens compensation and recovery. Mol Vis. 2007; 13: 1878–1886 [PubMed] [Google Scholar]
- 45. Livak KJ, Schmittgen TD. Analysis of relative gene expression data using real-time quantitative PCR and the 2−ΔΔCt method. Methods. 2001; 25: 402–408 [DOI] [PubMed] [Google Scholar]
- 46. McBrien NA, Norton TT. The development of experimental myopia and ocular component dimensions in monocularly lid-sutured tree shrews (Tupaia belangeri). Vision Res. 1992; 32: 843–852 [DOI] [PubMed] [Google Scholar]
- 47. Shaikh AW, Siegwart JT, Norton TT. Effect of interrupted lens wear on compensation for a minus lens in tree shrews. Optom Vis Sci. 1999; 76: 308–315 [DOI] [PubMed] [Google Scholar]
- 48. Siegwart JT Jr, Norton TT. Binocular lens treatment in tree shrews: Effect of age and comparison of plus lens wear with recovery from minus lens-induced myopia. Exp Eye Res. 2010; 91: 660–669 [DOI] [PMC free article] [PubMed] [Google Scholar]
- 49. Frost MR, Norton TT. Alterations in protein expression in tree shrew sclera during development of lens-induced myopia and recovery. Invest Ophthalmol Vis Sci. 2012; 53: 322–336 [DOI] [PMC free article] [PubMed] [Google Scholar]
- 50. Zhang Y, Liu Y, Wildsoet CF. Bidirectional, optical sign-dependent regulation of BMP2 gene expression in chick retinal pigment epithelium. Invest Ophthalmol Vis Sci. 2012; 53: 6072–6080 [DOI] [PMC free article] [PubMed] [Google Scholar]
- 51. Dreier B, Thomasy SM, Mendonsa R, Raghunathan VK, Russell P, Murphy CJ. Substratum compliance modulates corneal fibroblast to myofibroblast transformation. Invest Ophthalmol Vis Sci. 2013; 54: 5901–5907 [DOI] [PMC free article] [PubMed] [Google Scholar]
- 52. Hinz B, Mastrangelo D, Iselin CE, Chaponnier C, Gabbiani G. Mechanical tension controls granulation tissue contractile activity and myofibroblast differentiation. Am J Pathol. 2001; 159: 1009–1020 [DOI] [PMC free article] [PubMed] [Google Scholar]
- 53. Wang G, Chen W. Effects of mechanical stimulation on viscoelasticity of rabbit scleral fibroblasts after posterior scleral reinforcement. Exp Biol Med. 2012; 237: 1150–1154 [DOI] [PubMed] [Google Scholar]
- 54. Cui W, Bryant MR, Sweet PM, McDonnell PJ. Changes in gene expression in response to mechanical strain in human scleral fibroblasts. Exp Eye Res. 2004; 78: 275–284 [DOI] [PubMed] [Google Scholar]
- 55. Bing Z, Linlin L, Jianguo Y, Shenshen R, Ruifang R, Xi Z. Effect of mechanical stretch on the expressions of elastin, LOX and Fibulin-5 in rat BMSCs with ligament fibroblasts co-culture. Mol Biol Rep. 2012; 39: 6077–6085 [DOI] [PubMed] [Google Scholar]
- 56. Hsu HJ, Lee CF, Locke A, Vanderzyl SQ, Kaunas R. Stretch-induced stress fiber remodeling and the activations of JNK and ERK depend on mechanical strain rate, but not FAK. PLoS One. 2010; 5: e12470 [DOI] [PMC free article] [PubMed] [Google Scholar]
- 57. Cha MC, Purslow PP. The activities of MMP-9 and total gelatinase respond differently to substrate coating and cyclic mechanical stretching in fibroblasts and myoblasts. Cell Biol Int. 2010; 34: 587–591 [DOI] [PubMed] [Google Scholar]
- 58. Han B, Bai XH, Lodyga M, et al. Conversion of mechanical force into biochemical signaling. J Biol Chem. 2004; 279: 54793–54801 [DOI] [PubMed] [Google Scholar]
- 59. Arora PD, Narani N, McCulloch CA. The compliance of collagen gels regulates transforming growth factor-beta induction of alpha-smooth muscle actin in fibroblasts. Am J Pathol. 1999; 154: 871–882 [DOI] [PMC free article] [PubMed] [Google Scholar]
- 60. Siegwart JT Jr, Norton TT. Selective regulation of MMP and TIMP mRNA levels in tree shrew sclera during minus lens compensation and recovery. Invest Ophthalmol Vis Sci. 2005; 46: 3484–3492 [DOI] [PMC free article] [PubMed] [Google Scholar]
- 61. Gentle A, Liu Y, Martin JE, Conti GL, McBrien NA. Collagen gene expression and the altered accumulation of scleral collagen during the development of high myopia. J Biol Chem. 2003; 278: 16587–16594 [DOI] [PubMed] [Google Scholar]
- 62. Moring AG, Baker JR, Norton TT. Modulation of glycosaminoglycan levels in tree shrew sclera during lens-induced myopia development and recovery. Invest Ophthalmol Vis Sci. 2007; 48: 2947–2956 [DOI] [PMC free article] [PubMed] [Google Scholar]
- 63. Summers JA. The choroid as a sclera growth regulator. Exp Eye Res. 2013; 114: 120–127 [DOI] [PMC free article] [PubMed] [Google Scholar]
- 64. Nickla DL, Wallman J. The multifunctional choroid. Prog Retin Eye Res. 2010; 29: 144–168 [DOI] [PMC free article] [PubMed] [Google Scholar]
- 65. Maier T, Guell M, Serrano L. Correlation of mRNA and protein in complex biological samples. FEBS Lett. 2009; 583: 3966–3973 [DOI] [PubMed] [Google Scholar]
- 66. Nie L, Wu G, Zhang W. Correlation of mRNA expression and protein abundance affected by multiple sequence features related to translational efficiency in Desulfovibrio vulgaris: a quantitative analysis. Genetics. 2006; 174: 2229–2243 [DOI] [PMC free article] [PubMed] [Google Scholar]
- 67. Wang D. Discrepancy between mRNA and protein abundance: insight from information retrieval process in computers. Comput Biol Chem. 2008; 32: 462–468 [DOI] [PMC free article] [PubMed] [Google Scholar]
- 68. Lee PS, Shaw LB, Choe LH, Mehra A, Hatzimanikatis V, Lee KH. Insights into the relation between mRNA and protein expression patterns: II. Experimental observations in Escherichia coli. Biotechnol Bioeng. 2003; 84: 834–841 [DOI] [PubMed] [Google Scholar]
- 69. Rada JAS, Wiechmann AF, Hollaway LR, Baggenstoss BA, Weigel PH. Increased hyaluronan synthase-2 mRNA expression and hyaluronan accumulation with choroidal thickening: response during recovery from induced myopia. Invest Ophthalmol Vis Sci. 2010; 51: 6172–6179 [DOI] [PMC free article] [PubMed] [Google Scholar]
- 70. Wallman J, Winawer J. Homeostasis of eye growth and the question of myopia. Neuron. 2004; 43: 447–468 [DOI] [PubMed] [Google Scholar]
Associated Data
This section collects any data citations, data availability statements, or supplementary materials included in this article.