Abstract
Purpose.
To report the application of a novel imaging technique, pump-probe microscopy, to analyze patterns of pigment chemistry of conjunctival melanocytic lesion biopsies.
Methods.
Histopathologic specimens of eight previously excised conjunctival melanocytic lesions were analyzed with pump-probe microscopy. The technique uses a laser scanning microscope with a two-color pulsed laser source to distinguish hemoglobin, eumelanin, and pheomelanin pigment based on differences in transient excited state and ground state photodynamics. The pump-probe signatures of conjunctival melanins were compared with cutaneous melanins. The distributions of hemoglobin, eumelanin, and pheomelanin were analyzed, and pump-probe images were correlated with adjacent hematoxylin and eosin (H&E)-stained sections.
Results.
The pump-probe signatures of conjunctival melanins are similar, but not identical to cutaneous melanins. In addition, there are qualitative and quantitative differences in the structure and pigment chemistry of conjunctival benign nevi, primary acquired melanosis of the conjunctiva (PAM), and conjunctival melanomas. The pump-probe images correlated well with histopathologic features observed in the adjacent H&E-stained sections, and provided a label-free means of discerning conjunctival anatomic features and pathologic benign or malignant tissue.
Conclusions.
Pump-probe laser microscopy shows promise as an adjuvant diagnostic tool in evaluation of ocular melanocytic lesions based on morphologic correlation with the histopathology results and pigment chemistry. This initial study suggests systematic differences in pigmentation patterns among conjunctival benign nevi, primary acquired melanosis, and melanomas. In addition, pump-probe microscopy has the potential for use as a noninvasive “in vivo” optical biopsy technique to aid clinical and surgical management of conjunctival melanocytic lesions.
Keywords: conjunctival melanoma, primary acquired melanosis, benign conjunctival nevus, pump-probe microscopy, multiphoton microscopy
Using pump-probe microscopy, a multiphoton technique that images absorptive pigments, we analyzed the microscopic distribution of melanins in biopsy sections of conjunctival melanocytic lesions, and found differences among conjunctival benign nevi, primary acquired melanosis, and melanomas.
Introduction
Conjunctival melanocytic lesions are common and can comprise a broad spectrum of benign and, rarely, malignant conditions. They are usually divided into nevi (junctional, compound, subepithelial, and blue nevus), primary acquired melanosis (PAM) with or without atypia, and melanoma.1 Melanocytic lesions represent 53% of all excised conjunctival tumors. Nevi are the most common, found in 52% of the cases, followed by melanoma in 25%, and PAM in 21%.2
Conjunctival melanoma is responsible for only 1.6% of all noncutaneous melanomas.3 It is a rare but potentially lethal pathology with an estimated 10-year mortality rate of 13% to 30%.1 Early recognition of the clinical features allows precise diagnosis and adequate intervention, reducing potential ocular morbidity and future metastatic disease associated with conjunctival melanoma. Although the clinical diagnosis of conjunctival melanoma may be obvious in some cases, there is a clinical overlap in features among benign nevi, premalignant PAM lesions with atypia, and conjunctival melanoma. New imaging technologies, including ultrasound biomicroscopy,4 anterior segment optical coherence tomography,5,6 and laser scanning reflectance confocal microscopy,7,8 have enabled noninvasive evaluation of conjunctival lesions. Although clinical features seen with slit lamp ophthalmoscopy can be confirmed with these imaging techniques, the gold standard to differentiate between these benign and malignant conjunctival lesions is by surgical biopsy and subsequent histopathologic evaluation.1,9 However, conjunctival pathology specimens are prone to tissue folding at the cut edge, which may prevent adequate assessment of the surgical margin. Furthermore, excisional biopsy with 2- to 3-mm margins is preferred over incisional biopsy with melanocytic conjunctival lesions,10 which may lead to wide margin excision with subsequent ocular surface scarring for what is later determined to be a benign lesion on histopathology.
Adjunctive, noninvasive imaging of tumor and surgical margins may improve surgical planning and recurrence outcomes. Current techniques can visualize cross-sectional tissue anatomy, but fail to give direct histologic or biologic differentiation of these tissues. One means of assessing melanocyte behavior and tumorigenesis is by measuring melanin pigment chemistry: the balance between eumelanin and pheomelanin.11–13 Premalignant dysplastic cutaneous lesions express higher quantities of pheomelanin,14 a pigment associated with increased photosensitivity15,16 and oxidative stress.17 On the other hand, cutaneous malignant melanomas express higher quantities of eumelanin.18–20 By comparison, conjunctival melanocytic lesion pigment chemistry has received little attention, despite the clinical and biological similarities between conjunctival and cutaneous melanoma.21 Here we analyze conjunctival melanocytic lesions with a nonlinear optical technique. Although linear spectroscopy methods can distinguish eumelanin and pheomelanin,18 they suffer from extremely poor spatial resolution and lack three-dimensional optical sectioning capabilities, both issues can be addressed by nonlinear optical methods.
Nonlinear (i.e., multiphoton) microscopy using femtosecond lasers gives microscopic resolution in scattering media, better penetration depth than conventional microscopy,22 and has begun to see applications to ocular pathologies.23–25 Traditional nonlinear methods work only when the molecular target creates light of a different color (e.g., by fluorescence), which restricts imaging contrast to only a small set of endogenous molecules. In contrast, recent technological developments have made it possible to obtain chemical contrast from “dark” molecules, vastly increasing the range of endogenous targets.26 For example, two-color pump-probe microscopy can differentiate between eumelanin and pheomelanin,27,28 and oxy- and deoxy-hemoglobin.29,30 It has been successfully applied to differentiate cutaneous dysplastic nevi from melanoma in biopsy sections,20 and has been used to image animal models of melanoma in vivo.31,32 Pump-probe is a time-resolved spectroscopy technique, somewhat analogous to fluorescence lifetime methods that have been used to map endogenous fluorophores in the retina.33 Here we establish the feasibility of pump-probe microscopy on ocular tissue by examining unstained biopsy sections of conjunctival melanocytic lesions.
Methods
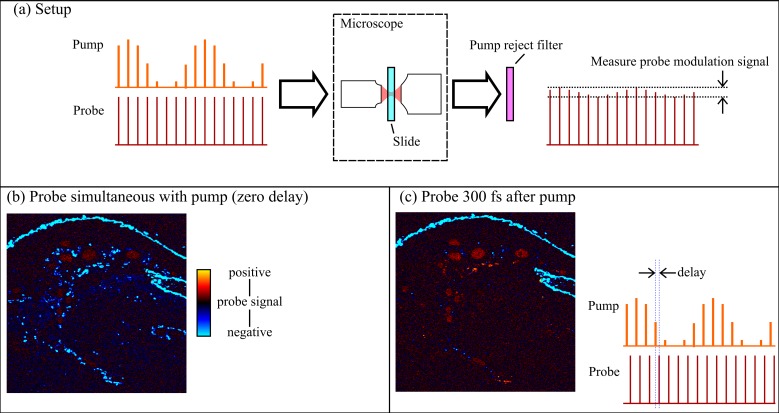
Using pump-probe microscopy, we imaged several regions of interest from eight conjunctival melanocytic lesions: three benign nevi, two PAM lesions with severe atypia (melanoma-in-situ), and three malignant melanomas. Images were acquired directly from unstained 10-μm-thick paraffin sections in a custom-built laser scanning microscope. For comparison with histopathology, adjacent step sections were stained with hematoxylin and eosin (H&E). Figure 1 shows the experimental setup; more detail is described elsewhere.20,27 In brief, we use a Coherent Mira optical parametric oscillator (OPO; Coherent, Inc., Santa Clara, CA) pumped by a Spectra-Physics Tsunami oscillator (Spectra-Physics; Santa Clara, CA) to provide a train of wavelength-tunable pulse pairs. The two lasers are tuned to 720 nm and 810 nm, respectively serving as the pump pulse and the probe pulse, because eumelanin and pheomelanin exhibit very distinct pump-probe responses at these wavelengths.20,28 The 720-nm pump is modulated at 2 MHz, whereas the 810-nm probe is left unmodulated. Then both pulse trains are directed into a laser scanning microscope, and attenuated so that approximately 3.75-mW pump and 3.75-mW probe power is incident on the specimen at the focus of the microscope objective (10×, 0.25 numeric aperture; Olympus, Center Valley, PA). There, nonlinear optical interactions between the pump and the probe (such as ground state depletion, excited state absorption, and stimulated emission) transfer the 2-MHz modulation to the probe. This signal is then detected with a photodiode and a lock-in amplifier. Different pigments are resolved by scanning the time delay between the pump pulse and the probe pulse, τ, and acquiring a stack of 55 images, each frame corresponding to a different pump-probe delay. Each pixel of the complete delay stack thus reflects the excited state photodynamics as a function of time (i.e., probe delay). These studies were conducted under a protocol approved by the Duke University School of Medicine Institutional Review Board, and in accordance with the tenets of the Declaration of Helsinki.
Figure 1.
(a) Experimental setup. Pump and probe laser pulses are directed into a scanning microscope. The detection end measures the modulation on the probe. (b) Image acquired with no delay between the pump and probe pulses. (c) Image of same slide with probe delay changed, for example, to 300 femtoseconds. The full response of the specimen is sampled by acquiring a range of probe delays, up to 16 picoseconds.
To visualize each three-dimensional delay stack as a two-dimensional map of pigment chemistry, we adapted the technique of phasor analysis from fluorescence lifetime microscopy34,35 to work with pump-probe data.36 In this approach, the photodynamic behavior from each pixel is decomposed into two parameters, g and s, given by the real and imaginary parts, respectively, of the signal's Fourier transform at a given frequency. This enabled model-free analysis of the multiexponential signals, even at low signal-to-noise levels. The key parameter is the frequency used for phasor analysis: high-frequency phasors resolve fast differences in photodynamics; low-frequency phasors resolve slow differences. We used two different phasor frequencies for our analysis: 0.25 THz was selected to optimally discriminate eumelanin and pheomelanin (and to compare with our prior studies of cutaneous melanocytic lesions20,36), and 0.7 THz was selected to discriminate between pheomelanin and surgical ink. Each image was acquired with an approximately 750 × 750-μm field of view. Larger fields of view were acquired as separate tiles, manually aligned, and composited with custom software written in MATLAB (The MathWorks, Inc. Natick, MA).
Results
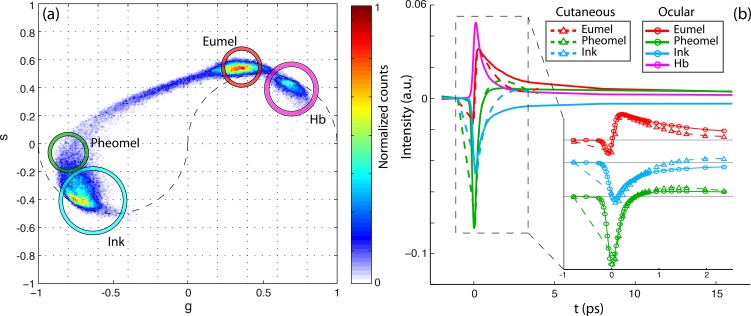
All samples were successfully imaged with pump-probe microscopy, and the pump-probe spectroscopic signatures were consistent with pigments we expected to find in conjunctival biopsy specimens (eumelanin, pheomelanin, hemoglobin, and surgical ink), as summarized in Figure 2. Figure 2a is a two-dimensional histogram of each pixel (above the noise threshold) of all images in the (g, s) phasor coordinate system at 0.25 THz. Because each image stack contains 262,144 pixels, the data in (a) represent the accumulation of millions of independent pump-probe measurements. Representative pump-probe signatures for each pigment were generated by averaging together the pixels that fell within the circled regions in Figure 2a. The resulting pump-probe signatures are shown in Figure 2b, along with a comparison to the corresponding pigments previously observed in cutaneous pigmented lesions.20,36 Although the oxygenation state of hemoglobin can be assessed by exchanging pump and probe wavelengths,30 these tissue sections are exposed to atmospheric air; therefore, all hemoglobin within is assumed to be oxygenated.
Figure 2.
(a) Cumulative 0.25-THz phasor histogram for pump-probe images from n different fields of view from eight different lesions. (b) Comparison of pump-probe responses of eumelanin, pheomelanin, hemoglobin, and surgical ink with cutaneous pigment.
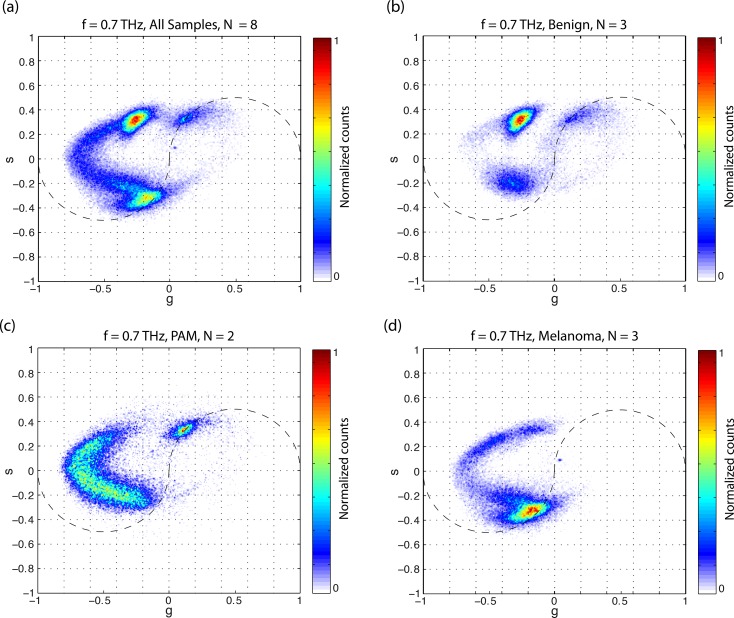
Figure 3a shows the accumulated phasor plot at 0.7 THz for all the delay stacks acquired. Compared with the 0.25-THz analysis in Figure 2a, the eumelanin-pheomelanin mixing path is more curved (characteristic of signals containing positive and negative values36); it is also easier to draw a difference between pheomelanin and surgical ink at 0.7 THz. The benign nevi (Fig. 3b) appeared to contain either eumelanin or pheomelanin, with very little mixed melanin content. The PAM lesions (Fig. 3c) were dominated by a pheomelanotic mixture, with very little pure eumelanin. The melanomas (Fig. 3d) presented a wide range of pigment mixtures.
Figure 3.
Cumulative 0.7-THz phasor histogram by lesion class: (a) all lesions imaged, (b) conjunctival nevi, (c) PAM, and (d) melanoma.
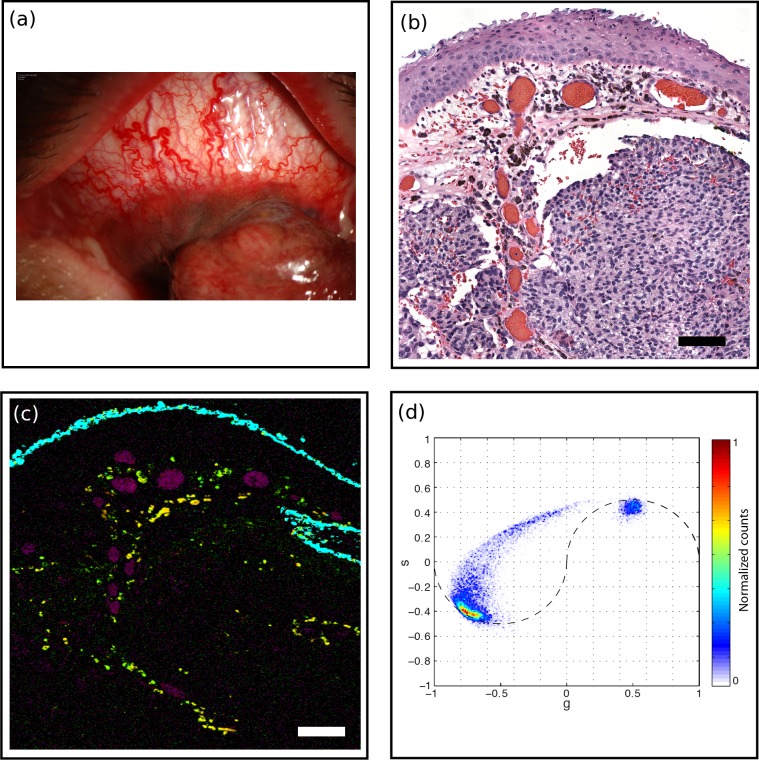
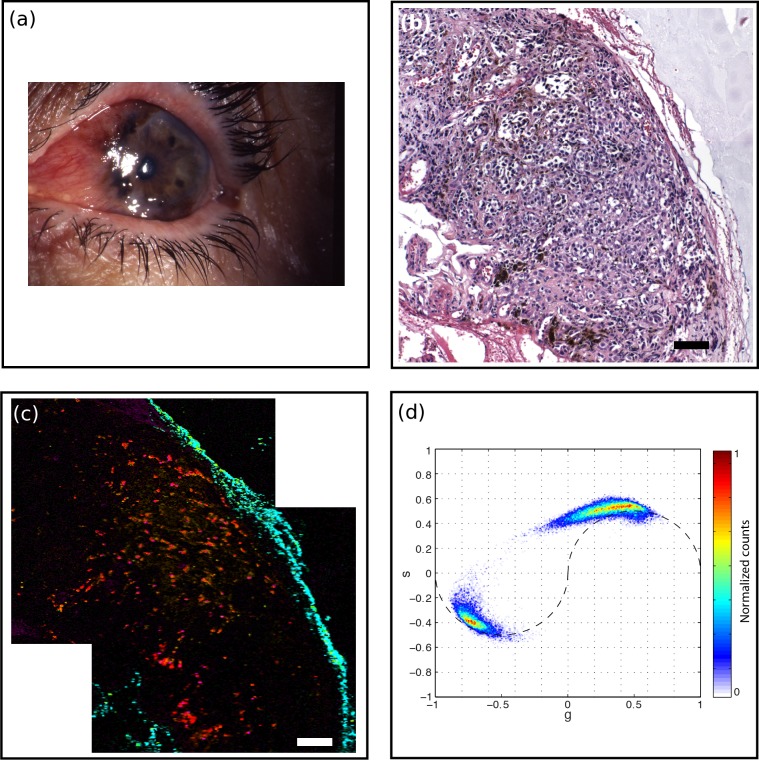
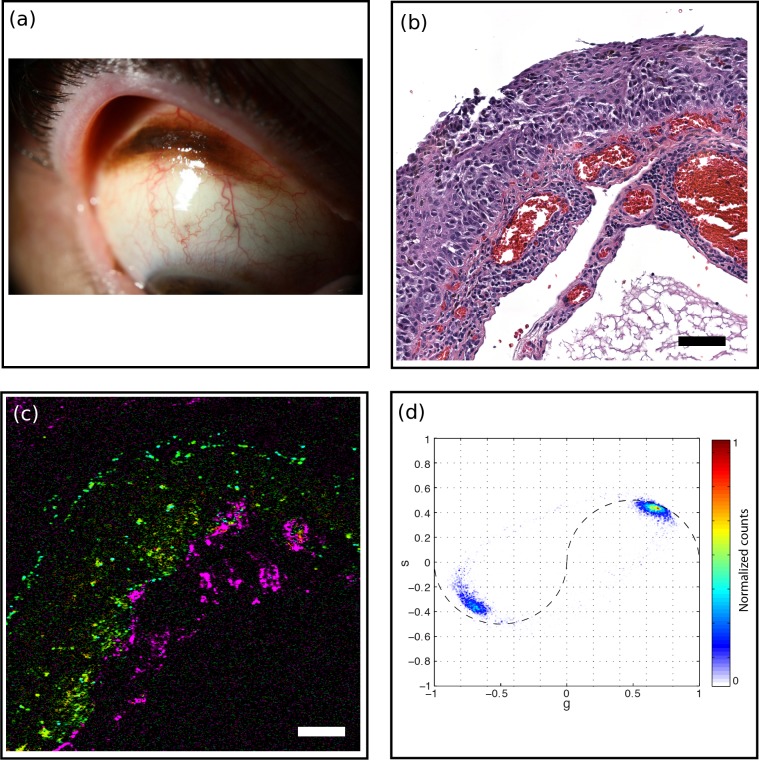
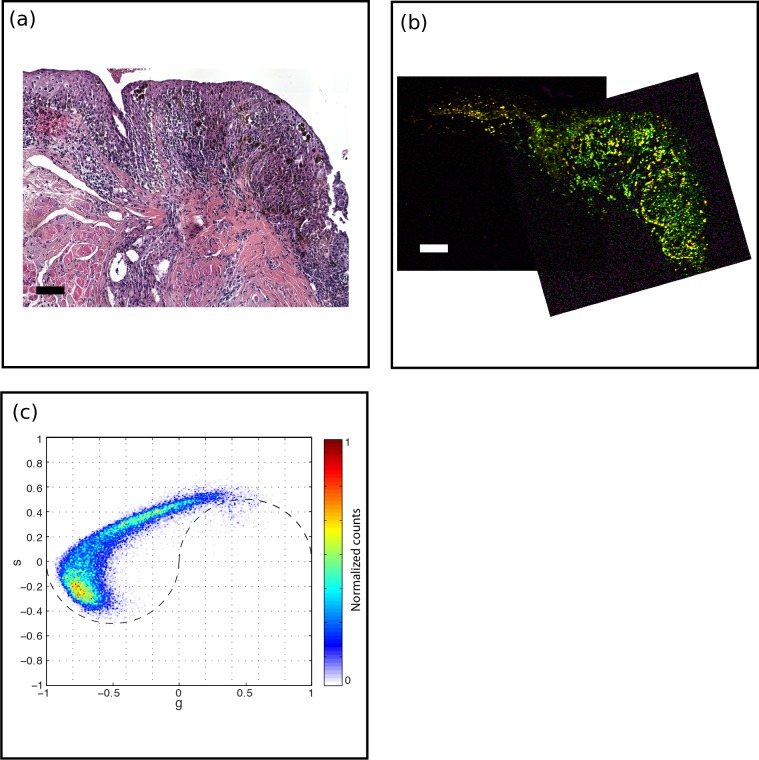
Selected pump-probe images are shown in Figures 4 through 8, alongside corresponding H&E-stained slides for comparison. Figure 4 shows a melanoma (MM1) imaged at the border of the tumor. The pump-probe image shows a clear distinction among surgical ink, hemoglobin, and melanin. The bulk of this tumor lacks pigment, whereas the melanocytes at the edge, embedded in the loose connective tissue and near congested vasculature, express varying levels of eumelanin and pheomelanin. In contrast, the melanoma shown in Figure 5 (MM2) exhibits significant pigmentation within the bulk of the tumor, and predominantly expresses eumelanin. Figure 6 shows a thin primary acquired melanosis with atypia (PAM1), with congested vasculature, expressing primarily pheomelanin. Figure 7 illustrates a primary acquired melanosis with slightly higher atypia (PAM2). Compared with PAM1, this lesion is much thicker and expresses a higher proportion of eumelanin. Figures 8a through 8d show cystic structures in benign nevi (BN1) with high eumelanin content. Figures 8e and 8f illustrate engorged vasculature in a melanoma (MM3). Figures 8g through 8j show pigmentation along reactive fibrosis and within nests of melanocytes in a melanoma (MM1).
Figure 4.
Melanoma (MM1). (a) A 61-year-old male presented with pigmented conjunctival lesion enlarging over several years. Marked vascularity of the lesion is evident clinically. (b) H&E-stained histology section, scale bar: 100 μm. Intraepithelial melanocytic hyperplasia is noted on histology while nests of atypical melanocytes invade substantia propria. Marked vascular congestion is also noted. (c) Pump-probe image demonstrated distribution of eumelanin (red) and pheomelanin (green) pigment, predominantly located near vasculature (magenta). Surgical ink in cyan. Scale bar: 100 μm. (d) Associated phasor plot.
Figure 5.
Melanoma (MM2). (a) A 79-year-old female with pigmented conjunctival lesion. (b) H&E-stained histology section, scale bar: 100 μm. Nests of markedly atypical melanocytes were seen in substantia propria consistent with invasive malignant melanoma. (c) Pump-probe image demonstrated distribution of eumelanin (red) and pheomelanin (green) pigment with predominance of eumelanin. Hemoglobin (magenta) and surgical ink (cyan) pigment are also noted. Scale bar: 100 μm. (d) Associated phasor plot.
Figure 6.
Thin PAM with vasculature (PAM1). (a) A 55-year-old male with pigmented conjunctival lesion. (b) H&E-stained histology section, scale bar: 100 μm. The epithelium was replaced in full thickness by nests of atypical melanocytes consistent with PAM with atypia. (c) Pump-probe image illustrated predominance of pheomelanin (green) along basal epithelium. Surgical ink (cyan) and hemoglobin (magenta) pigments were noted. Scale bar: 100 μm. (d) Associated phasor plot.
Figure 7.
PAM with slightly higher atypia (PAM2). (a) H&E-stained histology section, scale bar: 100 μm. A diffuse atypical melanocytic proliferation with increased cellularity and increased pigment is noted within epithelium. The epithelial thickness, cellular atypia, and pigment gradually decreased in the left portion of the specimen. (b) Pump-probe image reveals the bulk of the lesion contains pheomelanin, with an increasing eumelanin content toward the left. Scale bar: 100 μm. (c) Associated phasor plot.
Figure 8.
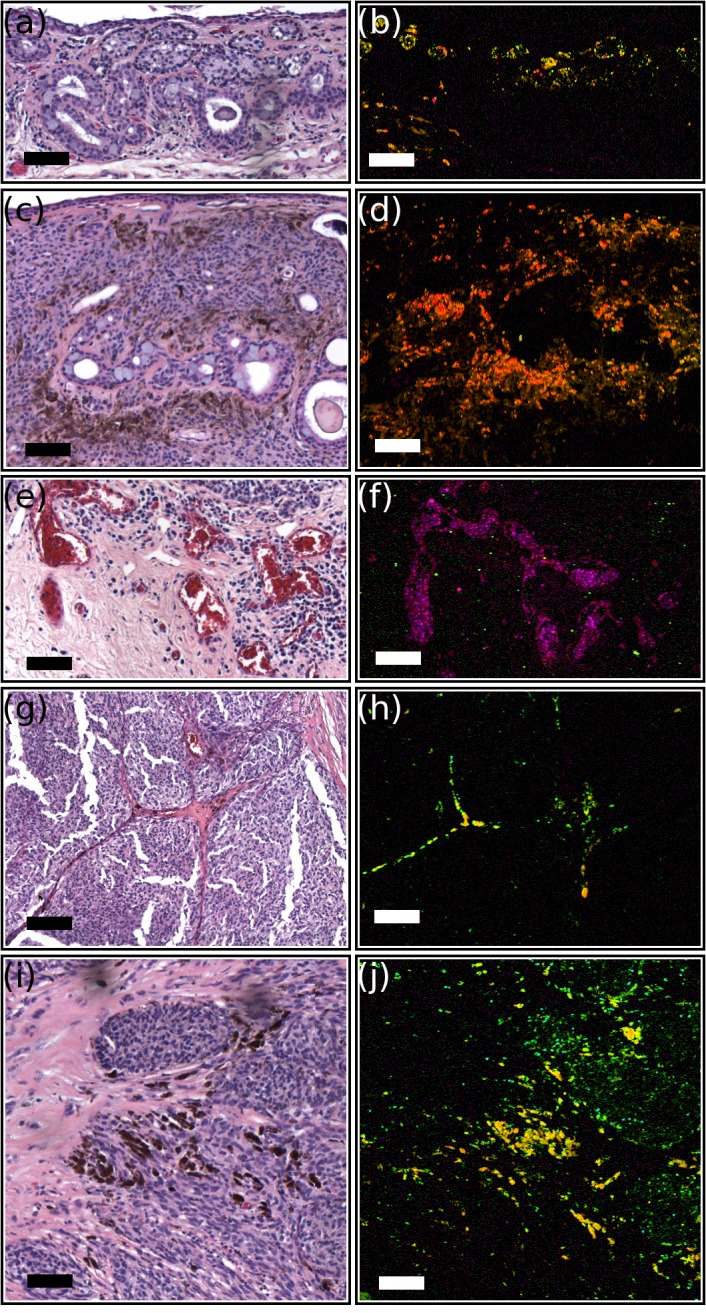
Histologic structures observable by pump-probe microscopy (false color images show eumelanin in red, pheomelanin in green, and hemoglobin in magenta). All scale bars: 100 μm. (a) H&E-stained section and (b) pump-probe image of nests of melanocytes and cysts within substantial propria consistent with benign nevus. (c) H&E-stained section and (d) pump-probe image of subepithelial melanocytic nests with associated cysts in a benign nevus. (e) H&E-stained section and (f) pump-probe image of vascular congestion associated with invasive melanoma. (g) H&E-stained section and (h) pump-probe image of pigment migration with reactive fibrosis dividing sheets of atypical melanocytes in a conjunctival melanoma. (i) H&E-stained section and (j) pump-probe image of nests of atypical melanocytes with marked pigmentation in invasive melanoma.
Discussion
We report the first application of pump-probe technology to image melanocytic conjunctival lesions. The pump-probe images reveal spatial information on chemically specific pigment distributions that are neither visible in the H&E-stained slides, nor attainable through available adjunctival tissue stains or immunohistochemical analysis. We identified differences in photodynamic response between cutaneous and conjunctival pigments (Fig. 2b). In the conjunctival samples, eumelanin exhibits a shorter excited state lifetime and pheomelanin exhibits a longer ground state recovery time. One possible reason for the differences is that melanocyte pigment expression is regulated by the signaling with neighboring epithelial cells and fibroblasts.37 Another possibility for the differences in ground state bleaching signal is variation in the iron content of eumelanin.38 A quantitative analysis of pigment composition can be done by combining delay stacks acquired with several different pump-probe wavelength combinations, which will be useful in future work.
There are qualitative differences in the pigment chemistry distributions between benign nevi, primary acquired melanosis, and melanomas (Fig. 3). For the specimens we examined here, melanomas appeared heterogeneous in eumelanin/pheomelanin content, having more eumelanin than pheomelanin. PAMs were also heterogeneous, with more pheomelanin than the melanomas. Although PAM1 expressed primarily pheomelanin, PAM2, which showed slightly more histopathologic cellular atypia, had a higher proportion of eumelanin. This shift from pheomelanin to eumelanin may indicate a biochemical marker for malignant transformation, as we previously identified with cutaneous melanoma.20 The group with the largest variance among samples was the benign nevi, where one was highly eumelanotic, another was amelanotic, and the third was pheomelanotic. Cysts were visible in both of the pigmented benign nevi. Although these benign nevi could not be distinguished from PAMs and melanomas solely on the basis of overall pigment chemistry, they differ markedly in terms of spatial heterogeneity.
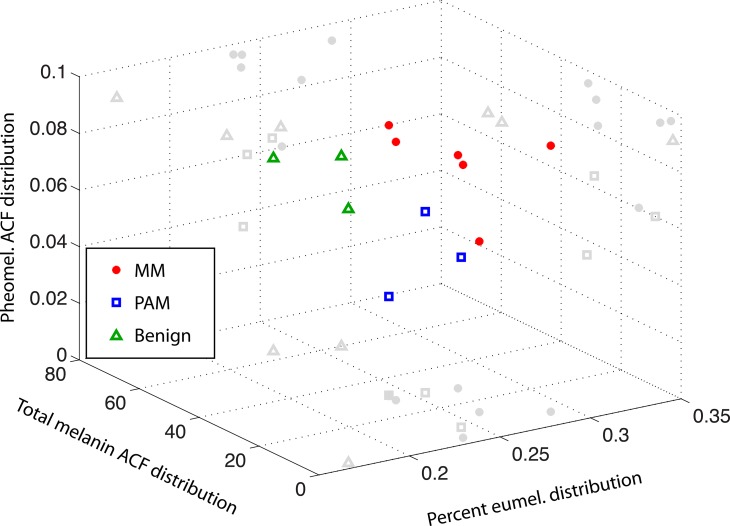
Quantitative analysis of the spatial distribution of the pigment chemistry, as determined by phasor analysis, can be done with a two-dimensional autocorrelation method (Robles FE, Wilson JW, Warren WS, manuscript in preparation). Figure 9 illustrates three structural parameters based on this analysis that correctly classify the pump-probe images we have acquired. Here, benign lesions are well separated from PAMs and melanomas, even though, as noted previously, the chemical composition of the pigment varies widely. PAMs and melanomas also group into different regions in this three-dimensional plot. Larger population studies will be necessary to define proper placement of decision lines and evaluate whether this technique can reliably separate PAMs and melanomas.
Figure 9.
Quantification of pigment spatial distribution based on a two-dimensional autocorrelation function (ACF) method. Each point corresponds to one field of view. Different lesion types group into different regions of a three-dimensional plot.
Although the results of this study are promising, this series of patients is small (n = 8) and further studies with a wider variety of lesions (including other types of PAM lesions, e.g., with and without atypia) are necessary to validate these preliminary findings and to determine the role of pump-probe imaging in management of ocular melanocytic lesions. In addition, we used higher laser powers than we previously used for cutaneous imaging, where the pigments appear quite stable. Establishing an upper limit on acceptable laser power will require further study of the photostability of ocular melanins. Of course, because pump-probe contrast is by nature limited to optically absorptive pigments (e.g., melanins and hemoglobin), it should be combined with either confocal reflectance or multiphoton autofluorescence to provide morphologic context (we have already developed a combined system for in vivo cutaneous imaging32). Although the images shown here were acquired from pathology specimens, our technique can be adapted for “in vivo” pigment imaging. We have already demonstrated pump-probe imaging of cutaneous pigmented lesions in live mice, by collecting back-scattered light.31,32 Pump-probe imaging of the retina even may be possible with the use of adaptive optics, an approach that has enabled multiphoton imaging of primate retinas “in vivo.”39
In conclusion, pump-probe laser microscopy of conjunctival melanocytic lesions demonstrated a correlation to the histopathology, highlighting its potential use in clinical and surgical management of conjunctival melanocytic lesions. It may serve as an “in vivo” optical biopsy and help distinguish, via biochemical patterns of intrinsic melanins, malignant and premalignant lesions from benign lesions. Therefore, it may lead to reduced rate of unnecessary surgical biopsies. Moreover, it may serve as a surgical adjunct to identify lesion margins in subtle cases. And, most importantly, it may allow postexcisional surveillance for tumor recurrence in melanoma cases on the molecular level.
Acknowledgments
Supported by National Institutes of Health Fellowship 1F32CA168497-01A1 (JWW); Research to Prevent Blindness 2012 Duke's Unrestricted Grant Award (LV, PM); and National Institutes of Health Grants 1RC1CA145105 and R01-CA166555 (WSW).
Disclosure: J.W. Wilson, None; L. Vajzovic, None; F.E. Robles, None; T.J. Cummings, None; P. Mruthyunjaya, None; W.S. Warren, None
References
- 1. Zembowicz A, Mandal RV, Choopong P. Melanocytic lesions of the conjunctiva. Arch Pathol Lab Med. 2010; 134: 1785–1792 [DOI] [PubMed] [Google Scholar]
- 2. Shields CL, Demirci H, Karatza E, Shields JA. Clinical survey of 1643 melanocytic and nonmelanocytic conjunctival tumors. Ophthalmology. 2004; 111: 1747–1754 [DOI] [PubMed] [Google Scholar]
- 3. Scotto J, Fraumeni JF Jr, Lee JA. Melanomas of the eye and other noncutaneous sites: epidemiologic aspects. J Natl Cancer Inst. 1976; 56: 489–491 [DOI] [PubMed] [Google Scholar]
- 4. Bianciotto C, Shields CL, Guzman JM, et al. Assessment of anterior segment tumors with ultrasound biomicroscopy versus anterior segment optical coherence tomography in 200 cases. Ophthalmology. 2011; 118: 1297–1302 [DOI] [PubMed] [Google Scholar]
- 5. Vajzovic LM, Karp CL, Haft P, et al. Ultra high-resolution anterior segment optical coherence tomography in the evaluation of anterior corneal dystrophies and degenerations. Ophthalmology. 2011; 118: 1291–1296 [DOI] [PubMed] [Google Scholar]
- 6. Kieval JZ, Karp CL, Abou Shousha M, et al. Ultra-high resolution optical coherence tomography for differentiation of ocular surface squamous neoplasia and pterygia. Ophthalmology. 2012; 119: 481–486 [DOI] [PubMed] [Google Scholar]
- 7. Messmer EM. Confocal microscopy: when is it helpful to diagnose corneal and conjunctival disease? Expert Rev Ophthalmol. 2008; 3: 177–192 [Google Scholar]
- 8. Efron N, Al-Dossari M, Pritchard N. In vivo confocal microscopy of the bulbar conjunctiva. Clin Experiment Ophthalmol. 2009; 37: 335–344 [DOI] [PubMed] [Google Scholar]
- 9. Shields CL, Shields JA. Ocular melanoma: relatively rare but requiring respect. Clin Dermatol. 2009; 27: 122–133 [DOI] [PubMed] [Google Scholar]
- 10. Shields JA, Shields CL, De Potter P. Surgical management of conjunctival tumors. Arch Ophthalmol. 1997; 115: 808–815 [DOI] [PubMed] [Google Scholar]
- 11. Jimbow K, Miyake Y, Homma K, et al. Characterization of melanogenesis and morphogenesis of melanosomes by physicochemical properties of melanin and melanosomes in malignant melanoma. Cancer Res. 1984; 44: 1128–1134 [PubMed] [Google Scholar]
- 12. Jimbow K, Reszka K, Schmitz S, Salopek T, Thomas P. Distribution of eu- and pheomelanins in human skin and melanocytic tumors, and their photoprotective vs. phototoxic properties. In: Zeise L, Chedekel MR, Fitzpatrick TB. eds Melanin: Its Role in Human Photoprotection. Overland Park, KS: Valdenmar Publishers; 1995: 155–175 [Google Scholar]
- 13. Lazova R, Pawelek JM. Why do melanomas get so dark? Exp Dermatol. 2009; 18: 934–938 [DOI] [PubMed] [Google Scholar]
- 14. Salopek TG, Yamada K, Ito S, Jimbow K. Dysplastic melanocytic nevi contain high levels of pheomelanin: quantitative comparison of pheomelanin/eumelanin levels between normal skin, common nevi, and dysplastic nevi. Pigment Cell Res. 1991; 4: 172–179 [DOI] [PubMed] [Google Scholar]
- 15. Takeuchi S, Zhang W, Wakamatsu K, et al. Melanin acts as a potent UVB photosensitizer to cause an atypical mode of cell death in murine skin. Proc Natl Acad Sci U S A. 2004; 101: 15076–15081 [DOI] [PMC free article] [PubMed] [Google Scholar]
- 16. Ye T, Pawlak A, Sarna T, Simon JD. Different molecular constituents in pheomelanin are responsible for emission, transient absorption and oxygen photoconsumption. Photochem Photobiol. 2008; 84: 437–443 [DOI] [PubMed] [Google Scholar]
- 17. Pavel S, van Nieuwpoort F, van der Meulen H, et al. Disturbed melanin synthesis and chronic oxidative stress in dysplastic naevi. Eur J Cancer. 2004; 40: 1423–1430 [DOI] [PubMed] [Google Scholar]
- 18. Marchesini R, Bono A, Carrara M. In vivo characterization of melanin in melanocytic lesions: spectroscopic study on 1671 pigmented skin lesions. J Biomed Opt. 2009; 14: 014027 [DOI] [PubMed] [Google Scholar]
- 19. Zonios G, Dimou A, Carrara M, Marchesini R. In vivo optical properties of melanocytic skin lesions: common nevi, dysplastic nevi and malignant melanoma. Photochem Photobiol. 2010; 86: 236–240 [DOI] [PubMed] [Google Scholar]
- 20. Matthews TE, Piletic IR, Selim MA, Simpson MJ, Warren WS. Pump-probe imaging differentiates melanoma from melanocytic nevi. Sci Transl Med. 2011; 3: 71ra15 [DOI] [PMC free article] [PubMed] [Google Scholar]
- 21. Hurst EA, Harbour JW, Cornelius LA. Ocular melanoma: a review and the relationship to cutaneous melanoma. Arch Dermatol. 2003; 139: 1067–1073 [DOI] [PubMed] [Google Scholar]
- 22. Zipfel WR, Williams RM, Webb WW. Nonlinear magic: multiphoton microscopy in the biosciences. Nat Biotechnol. 2003; 21: 1369–1377 [DOI] [PubMed] [Google Scholar]
- 23. Steven P, Müller M, Koop N, Rose C, Hüttmann G. Comparison of cornea module and DermaInspect for noninvasive imaging of ocular surface pathologies. J Biomed Opt. 2009; 14: 064040 [DOI] [PubMed] [Google Scholar]
- 24. Gibson EA, Masihzadeh O, Lei TC, Ammar DA, Kahook MY. Multiphoton microscopy for ophthalmic imaging. J Ophthalmol. 2011; 2011: 870879 [DOI] [PMC free article] [PubMed] [Google Scholar]
- 25. Masihzadeh O, Ammar DA, Kahook MY, Gibson EA, Lei TC. Direct trabecular meshwork imaging in porcine eyes through multiphoton gonioscopy. J Biomed Opt. 2013; 18: 036009 [DOI] [PMC free article] [PubMed] [Google Scholar]
- 26. Min W, Freudiger CW, Lu S, Xie XS. Coherent nonlinear optical imaging: beyond fluorescence microscopy. Ann Rev Phys Chem. 2011; 62: 507–530 [DOI] [PMC free article] [PubMed] [Google Scholar]
- 27. Fu D, Ye T, Matthews TE, Yurtsever G, Warren WS. Two-color, two-photon, and excited-state absorption microscopy. J Biomed Opt. 2007; 12: 054004 [DOI] [PubMed] [Google Scholar]
- 28. Piletic IR, Matthews TE, Warren WS. Probing near-infrared photorelaxation pathways in eumelanins and pheomelanins. J Phys Chem A. 2010; 114: 11483–11491 [DOI] [PMC free article] [PubMed] [Google Scholar]
- 29. Fu D, Ye T, Matthews TE, et al. High-resolution in vivo imaging of blood vessels without labeling. Opt Lett. 2007; 32: 2641–2643 [DOI] [PubMed] [Google Scholar]
- 30. Fu D, Matthews TE, Ye T, Piletic IR, Warren WS. Label-free in vivo optical imaging of microvasculature and oxygenation level. J Biomed Opt. 2008; 13: 040503 [DOI] [PubMed] [Google Scholar]
- 31. Matthews TE, Wilson JW, Degan S, et al. In vivo and ex vivo epi-mode pump-probe imaging of melanin and microvasculature. Biomed Opt Express. 2011; 2: 1576–1583 [DOI] [PMC free article] [PubMed] [Google Scholar]
- 32. Wilson JW, Degan S, Selim MA, Zhang JY, Warren WS. In vivo pump-probe microscopy of melanoma and pigmented lesions. Multiphoton Microscopy in the Biomedical Sciences XII. 2012; 8226: 822602 [Google Scholar]
- 33. Schweitzer D, Schenke S, Hammer M, et al. Towards metabolic mapping of the human retina. Microsc Res Tech. 2007; 70: 410–419 [DOI] [PubMed] [Google Scholar]
- 34. Digman MA, Caiolfa VR, Zamai M, Gratton E. The phasor approach to fluorescence lifetime imaging analysis. Biophys J. 2008; 94: L14–L16 [DOI] [PMC free article] [PubMed] [Google Scholar]
- 35. Stringari C, Cinquin A, Cinquin O, et al. Phasor approach to fluorescence lifetime microscopy distinguishes different metabolic states of germ cells in a live tissue. Proc Natl Acad Sci U S A. 2011; 108: 13582–13587 [DOI] [PMC free article] [PubMed] [Google Scholar]
- 36. Robles FE, Wilson JW, Fischer MC, Warren WS. Phasor analysis for nonlinear pump-probe microscopy. Optics Express. 2012; 20: 17082–17092 [Google Scholar]
- 37. Slominski A, Tobin DJ, Shibahara S, Wortsman J. Melanin pigmentation in mammalian skin and its hormonal regulation. Physiol Rev. 2004; 84: 1155–1228 [DOI] [PubMed] [Google Scholar]
- 38. Simpson MJ, Glass KE, Wilson JW, et al. Pump–probe microscopic imaging of Jurassic-aged eumelanin. J Phys Chem Lett. 2013; 4: 1924–1927 [DOI] [PMC free article] [PubMed] [Google Scholar]
- 39. Hunter JJ, Masella B, Dubra A, et al. Images of photoreceptors in living primate eyes using adaptive optics two-photon ophthalmoscopy. Biomed Opt Express. 2011; 2: 139–148 [DOI] [PMC free article] [PubMed] [Google Scholar]


