

Abstract
The degree to which children grow up in crowded housing is a neglected but potentially important aspect of social inequality. Poor living conditions can serve as a mechanism of social stratification, affecting children’s wellbeing and resulting in the intergenerational transmission of social inequality. This paper reports an investigation of housing crowding on children’s academic achievement, behavior, and health in the U.S. and Los Angeles, a city with atypically high levels of crowding. We use data from the Panel Study of Income Dynamics’ Child Development Supplement and the Los Angeles Family and Neighborhood Survey to explore the effect of living in a crowded home on an array of child wellbeing indicators. We find that several dimensions of children’s wellbeing suffer when exposed to crowded living conditions, particularly in Los Angeles, even after controlling for socioeconomic status. The negative effects on children raised in crowded homes can persist throughout life, affecting their future socioeconomic status and adult wellbeing.
Keywords: housing crowding, child wellbeing, residential effects
One’s housing relates to many aspects of social life including privacy, location, health, security, social relations, and community resources. One aspect of housing quality is the quantity of housing that is available to each member of a household. For a given household size, the size of the dwelling unit determines the degree of housing crowding experienced by the persons who live there. Living in crowded housing conditions can create stress in the home and have negative consequences for its inhabitants. Children may be particularly vulnerable to this type of poor housing quality because they use the space in the home to do homework, interact with family members, develop an identity, practice skills, and sleep. Because the environments in which children are raised vary substantially across socioeconomic groups, these environments may also contribute to the intergenerational transmission of social inequality. Variation in housing crowding may be a key aspect of children’s physical environments. This paper is based on an analysis of representative data for the U.S. and for a large metropolitan area with atypically high levels of housing crowding on the academic achievement, behavior problems, and physical health of children.
Most research on the effects of crowding is based on adults, whose characteristics, including health, socioeconomic status, educational attainment, labor force participation, homeownership, etc. are a function of both current and past experiences in the home, workplace, and elsewhere (Evans 2003; Newman 2008). Yet children, on whom little crowding research has been done, are particularly dependent on and influenced by their home environments. The home is where the majority of children’s socialization, skill development, and identify formation occurs. These processes can be disrupted if the home environment is strained by overcrowding.
The majority of previous research has used cross-sectional1 data to study the effect of living in crowded housing (Baldassare 1979; Evans et al. 1998). Although an important starting point, this approach cannot control for past living environments and outcomes, which is essential for establishing a causal link between housing crowding and wellbeing. Building on past research, we use national longitudinal data to make stronger causal inferences concerning the relationship between housing crowding and child outcomes. In addition, whereas most past studies explore a single outcome, we explore the association between crowding and a variety of key indicators of child wellbeing.
1.1 Background
Concerns regarding the consequences of population overcrowding began with Malthus in the late 1700s. It was in the early 1960s, however, when a flurry of empirical research on the negative effects of population overcrowding was sparked by findings from experiments on densely populated animals. Calhoun’s study of laboratory rats found correlations between population density and increased aggression, disruptions in mating patterns and maternal activity, and higher rates of illness (Calhoun 1962). Animal studies inspired investigations on the effects of crowding on humans; the results of these studies, however, were far less consistent than in those with animals. One reason for these mixed results lies in the types of environments examined by researchers. Much of this research focuses on venues with high population densities, such as college dormitories (Valins and Baum 1973), ships, and prisons (Gove and Hughes 1983; Beeghley and Donnelly 1989). However, these unusual environments are highly selective and make it difficult to generalize to the crowding experiences of wider populations.
A much larger research literature addresses the possible impacts of residential neighborhoods on child outcomes (Jencks and Mayer 1990; Brooks-Gunn et al. 1993; Leventhal and Brooks-Gunn 2000). The neighborhood is a child’s proximate physical and social environment to which he or she is continually exposed. Although neighborhoods can serve as important environments for children, their effects are difficult to distinguish from those of their families whose resources and preferences determine where they live (e.g. Baldassare 1979). The limited research on neighborhood crowding effects on child wellbeing is largely inconclusive (Evans 2006).2
Although the more immediate home environment has garnered less attention, the dwelling unit or home may affect the lives of individuals in important ways. Families affect children more strongly than neighbors because they are physically and socially closer and more homogeneous. Individuals are socialized within the home to learn roles and relate to others. Individuals eat, sleep, work, and seek privacy in the home (Foley 1980). As a result, the physical characteristics of dwelling units generally, and their degree of crowding in particular, may be an important mechanism for explaining differences in child wellbeing across socioeconomic statuses. These differences in wellbeing can persist throughout the life-course and lead to intergenerational social stratification (Conley 2001).
Living in a crowded home may affect a child’s wellbeing in a variety of ways. The lack of a comfortable, quiet space can lead children to have difficulties studying and reading, affecting their school performance. When space is scarce, different schedules held by household members may disturb children’s sleep. The lack of productive sleep can lead to difficulty concentrating during the day and negatively affect mood and behavior. In addition, children in crowded housing have a higher probability of catching illnesses, which can interfere with their daily routine and interrupt their schooling (Edwards et al. 1994; Saegert and Evans 2003).
Lack of privacy can result in stress, difficult social interactions, and behavioral problems for all household members (Evans et al. 1998). Parents in overcrowded homes tend to show less responsive parenting (Caldwell and Bradley 1984), which may lower parents’ participation in parent-teacher organizations at school, monitoring of children’s academic performance, and help with children’s schoolwork. Children in crowded homes have more behavioral problems in school (Evans et al. 2001), which can extend to other social contexts.
Children raised in crowded homes may take their educational, behavioral, and physical health disadvantages with them throughout their lives. Their poor performance in school decreases their chances to access higher education and socioeconomic attainment. Behavioral problems can lead to difficulties interacting with others. Negative interactions with teachers, parents, and peers during childhood, can lead to future challenges in forming personal and professional networks in adulthood. Physical health problems can interrupt children's daily routines and keep them behind their peers in school and later in the workforce. Ultimately, children growing up in crowded homes are more likely than others to find themselves in a similar situation as their parents, contributing to the intergenerational transmission of social inequality (Leventhal and Newman 2010).
Despite these theoretical explanations, research on the effects of housing crowding provides mixed results. Researchers have explored a variety of outcomes and found that housing crowding leads to adult psychological withdrawal (Gove, Hughes, and Galle 1979), loneliness (Wenz 1984), poor marital relationships (Baldassare 1979), negative parent-child relations (Baldassare 1979; Evans, Lepore, Shejwal, and Palsane 1998), less-responsive parenting (Caldwell and Bradley 1984), higher rates of being held back a grade in elementary and middle school (Goux and Maurin 2005), and increased child behavioral problems at school (Evans, Saegert, and Harris 2001), while other research has shown no effect (e.g. Baldassare 1979). One reason for the inconsistency in housing crowding effects is the variety of crowding measures used in surveys, including persons per room, persons per bedroom, and persons per square foot, which makes comparability difficult (Baldassare 1979; Beeghley and Donnelly 1989). In addition, early studies on crowding do not control for the socioeconomic status of individuals, thereby confounding the effect of crowding and poverty on the outcomes (Rosenthal and Mayer 1983; Gove and Hughes 1983). Indeed, crowded housing can be seen as a socioeconomic indicator because people who cannot afford the price of private space are more likely to live in crowded conditions. Still, it is unclear whether or not housing crowding, net of other socioeconomic indicators, has an effect on child wellbeing (Booth and Johnson 1975; Booth and Cowell 1976; Gove, Hughes, and Galle 1979; Gove and Hughes 1983).
1.1.1 National and Local Los Angeles Data on Crowding and Child Outcomes
We use data from a nationally representative sample and data from Los Angeles, a major metropolitan area with particularly high rates of crowded housing. In the 1980’s, reductions in government housing support in both public housing and voucher programs came in combination with the decline of affordable housing due to gentrification, urban renewal, and increases in housing prices and rents throughout the country.
National affordability problems were more severe in Los Angeles (Wolch and Li 1997). Of all large cities in the nation, five of the top ten most crowded are in Los Angeles County according to the 2000 Census. The percentage of occupied housing units with greater than one person per room in L.A. County increased between 1990 and 2000, from 19.3% to 22.9% (see Table 1a). Compared to the U.S., with 5.7% of occupied housing units containing greater than one person per room in 2000 (U.S. Census), L.A. County has consistently faced dramatically larger proportions of crowding. In 2000, the proportion of crowded households (>1 person per room in occupied units) in L.A. County was four times higher than the nation overall (U.S. Census). Of all counties in the nation, L.A. County is the second most crowded (>1 occupant per room) according to the 2004 American Community Survey. Most reported estimates of crowding focus on the household level, but, in L.A., children are facing much higher rates of housing crowding (See Table 1b). Although 22.9% (7.9+15) of L.A. County households are crowded (>1 persons/room) in 2000, 51.3% (16.2+36.1) of children in L.A. County are living in crowded homes (U.S. Census 2000). In LA County, the proportion of children exposed to crowding housing increase from 46.1% (16.3+29.8) in 1990 to 51.3% in 2000. This increase points to the importance of better understanding the possible effects of crowded housing on children.3
Table 1a.
Percent Household-Level Crowding, Census and LAFANS
| Crowding (Persons/Room) |
1990 Census LA County |
2000 Census LA County |
LAFANS 2000 (N=3,086) |
2000 Census United States |
|---|---|---|---|---|
|
|
||||
| 1.0 or less | 80.70% | 77.00% | 73.80% | 81.40% |
| 1.01 – 1.50 | 6.8 | 7.9 | 12.4 | 10.1 |
| 1.51 or more | 12.5 | 15 | 13.8 | 8.5 |
Note: We present the Census estimates from the 5% sample of persons per room at the household level to offer a longitudinal assessment and a national comparison. Census groups total rooms at nine or more. For the purposes of this comparison, we group LAFANS data on rooms at nine or more, and assign that group the mean rooms.
Table 1b.
Percent Child-Level Crowding, Census, LAFANS, and PSID-CDS
| Crowding (Persons/Room) |
1990 Census LA County |
2000 Census LA County |
LAFANS 2000 (N=2,500) |
2000 Census United States |
PSID-CDS | |
|---|---|---|---|---|---|---|
| 1997 | 2001 | |||||
|
|
||||||
| 1.0 or less | 53.90% | 47.70% | 44.80% | 81.60% | 77.0% | 81.1% |
| 1.01 – 1.50 | 16.3 | 16.2 | 21.9 | 10.1 | 13.9 | 10.8 |
| 1.51 or more | 29.8 | 36.1 | 33.3 | 8.3 | 9.2 | 8.1 |
Note: We present the Census estimates from the 5% sample of persons per room at the child level. For the purposes of this comparison, we group LAFANS data on rooms at nine or more, and assign that group the mean rooms.
First, we assess the effects of living in a crowded home on children across the nation. Using panel data instead of cross-sectional data allows us to better estimate a causal relationship between housing crowding and children’s academic achievement, behavior problems, and physical health using panel data. Second, we focus on Los Angeles with higher levels of crowding and greater variability in children’s exposure to crowded housing.
We address the following questions: 1) Does living in a crowded home affect child wellbeing, even after controlling for socioeconomic conditions? 2) Do crowding effects vary across child outcomes? and 3) How do the effects of crowded housing for children living in a highly crowded area, L.A. County, compare to the effects on children in the nation overall?
1.2 Data and Methods
In order to investigate the effects of housing crowding on child wellbeing, we use the Panel Study of Income Dynamics’ Child Development Supplement (PSID-CDS) and the Los Angeles Family and Neighborhood Survey (LAFANS). The PSID is a longitudinal, nationally representative survey of individuals and families. The PSID began with a sample in 1968 and has followed these families/individuals and their new family lineages annually until 1997 and biannually thereafter. The PSID contains information on family background, income, housing, and other demographics key to analyze housing crowding. The 1997 and 2001 PSID show housing crowding rates comparable to the 2000 Census U.S. rates, assuring us that these data can accurately measure our focal process (see Table 1b).
The CDS is a supplement to the PSID focused on garnering a detailed understanding of the children. We use two waves of CDS data: one in 1997 on 3,563 children ages 0 to 12 and a second in 2002/2003 on 2,908 children/adolescents ages 5 to 18.4 The PSID-CDS has a number of detailed child wellbeing measures, including Woodcock-Johnson Revised cognitive tests on math and reading for children ages 3 to 12 in the first wave and ages 8 to 17 in the second wave that assesses academic achievement. These tests not only assess academic achievement, but also cognitive ability and intelligence. Primary caregivers are also asked a battery of behavioral questions that combine into indices on internal and external behavior problems for each child in both waves. Finally, primary caregivers are also asked to assess the child’s general physical health.
The LAFANS is a logical comparison dataset for our PSID-CDS investigations. The LAFANS design is similar to the PSID and contains many of the same or similar measures. The LAFANS is a multi-stage stratified cluster sample specially designed to capture family effects of child development and educational performance. The first wave of data was collected in 2000 from a representative sample of about 3,200 households in 65 neighborhoods, allowing for a diverse set of neighborhoods - from densely populated central city areas to rural areas. The LAFANS over-samples poor neighborhoods and households with children, making these data well suited for the study of children most vulnerable to living in crowded conditions (Sastry et al. 2003).
Like the CDS, the LAFANS offers information on child wellbeing. Moreover, this wellbeing information is highly comparable to that collected in the CDS. The LAFANS administers the Woodcock-Johnson Revised cognitive tests for math (N=2,433) and reading (N=1,940) to children ages 3 to 17. In the LAFANS, parents5 answer a battery of behavioral questions similar to those in the CDS about their children. These answers also combine into indices measuring the number of internal (N=2,369) and external (N=2,366) behavior problems. Finally, parents are also asked to assess their children’s (ages 3 to 17) general physical health (N= 2,454).6
1.2.1 Sample
The wave I CDS children originate from a sample of selected PSID families with children ages 0 to12. Up to two children per family were randomly selected for the 1997 CDS. Families who participated in the 1997 CDS and were active in the 2001 PSID were recontacted for the CDS wave II. Children ages 3 to12 in wave I and ages 8 to17 in wave II who have data in both waves are included in this analysis. We use listwise deletion for cases with missing data on less than 2% of the sample for any of the independent variables across all child outcome models. For those independent variables with more than 2% missing, we impute the missing values to the group mean and include a dummy variable indicating whether or not they were originally missing. This results in unweighted sample sizes of children ranging from 998 and 2,084.
We use survey estimation procedures to account for the PSID sample selection. We weight the data to correct for unequal selection probabilities, differential attrition, and changes in the proportion of families undergoing follow-up and sample recruitment structure. We calculate robust standard errors to compensate for differential child selection within families (StataCorp 2005).
The children sampled in LAFANS include a randomly selected child (RSC) and the RSC’s randomly selected sibling (SIB), if available, from each of the sampled households with children. The sample sizes range from 1,940 to 2,454, depending on the outcome measure. RSCs make up 62% of the children analyzed in this study, and the balance is SIBs. We use listwise deletion of cases with missing data on any of the independent variables in the separate child outcome models, reducing the sample sizes between 6.3 and 7.3%, depending upon the outcome. We are left with a range of unweighted sample sizes from 1,808 to 2,304 children for the models in this study.
We use survey estimation procedures to account for the LAFANS’s multi-stage stratified cluster design (clustered on the census tract). We weight the data to correct for oversampled poor strata, over-sampled households with children, and household non-response (Peterson et al. 2003). An adjustment for the difference in selection probabilities of RSCs and SIBs is also embedded in the weight. We compute robust standard errors because the RSCs and SIBs are not independent (StataCorp 2005).
1.2.2 Dependent Variables
We consider five child outcomes that serve as indicators of wellbeing (Hauser, Brown, and Prosser 1997). All variables used in this paper are available in both the PSID-CDS and LAFANS; most variables are identical, and some have minor variations between the two datasets. The first two outcomes are measures of educational achievement from the Woodcock-Johnson Revised tests, a battery of exams that assess individual scholastic achievement (Peterson et al. 2003). Children ages 3 to 17 were administered the Applied Problems test measuring skills in analyzing and solving practical mathematics problems. This test serves as an assessment of math reasoning. A Letter-Word Identification test, measuring symbolic learning and reading identification skills, combines with a Passage Comprehension test to indicate broad reading achievement. Scores were computed in relation to age. We utilize the standard scores in the PSID-CDS and the percentile rank score in the LAFANS, which indicates the percentage of subjects in the selected age group or grade that had the same or lower scores (Peterson et al. 2003), for its ease in interpretation.7
Our second two outcomes are internal and external measures of children’s behavior problems based on a battery of questions asked of primary care-givers or parents about their child or children. The internal scale measures withdrawal and sadness, while the external scale measures aggression.8 We use the natural log of these scales as our measure because most children rank at the lower end of the behavior problem scales.9 Our final outcome is a measure of children’s general health. Parents10 rank their child’s general health11 as excellent, very good, good, fair, or poor.12
1.2.3 Housing crowding
The focal independent variable in this analysis is housing crowding. We capture the extent of crowding in the home through a continuous measure of persons per room.13 The effects of crowding on a child’s wellbeing may begin to affect that child at a higher ratio of persons per room.A continuous measure enables us to capture these possibilities. In the PSID14, the numerator of housing crowding is a sum of the number of people in the family and the number of non-family members living in the housing unit. The denominator is the number of bedrooms and other rooms in the housing unit, not including the kitchen.15
Using the PSID’s past panel information on the household and housing unit, we construct four-year average crowding measures that correspond to the two CDS waves. Average crowding in the home for wave I consists of four PSID data points in 1994, 1995, 1996, and 1997. For wave II, the average crowding measure consists of two PSID data points over the last four years, in 1999 and 2001.16
In the LAFANS, we calculate crowding by dividing the total number of household members by the total number of rooms. The denominator is the sum of bedrooms and other rooms, not including bathrooms or the kitchen.
1.2.4 Control variables
We include demographic and socioeconomic control variables to model the association between housing crowding and child wellbeing. Child’s gender, age,17 mother’s marital status and mother’s nativity status are the demographic variables that may be correlated with crowding.18 Past research finds that immigrants are at particular risk for living in crowded housing conditions (Krivo 1995; Myers et al. 1996; Clark, Deurloo, and Dieleman 2000; Friedman and Rosenbaum 2004). Nativity status in the PSID is determined by participation in a special sub-sample of immigrants that were collected in 1997. Due to the genealogical survey design of the PSID, it does not incorporate new families to the sample unless there is a new birth to a pre-existing sample member. Immigrants that have been in the U.S. since 1968 were sampled to address this limitation. Los Angeles has an especially large immigrant population. Recent increases in overcrowding in the U.S. and especially in California19 may be due to high levels of Latino immigration (Clark et al. 2000). Latino immigrants in Southern California are also living in increasingly crowded conditions as their stay in the U.S. lengthens (Myers and Lee 1996).
The socioeconomic controls include the mother’s educational attainment,20 family income,21 and race/ethnicity. We use mother’s race/ethnicity rather than the child’s because much of the negative or positive consequences of race/ethnicity for a child occur through the mother. For instance, the location and quality of their housing unit is more strongly related to the mother’s race/ethnicity rather than the child’s. Those of “mixed race” are assigned to the indicated primary race. We collapse Pacific Islander, Native American, and other race together due to small sample sizes. We combine these other races into the Latino category, the group with the most similar in levels of crowding. The Asian sample in the PSID is small; therefore, we fold Asians into the Latino/other category as well, leaving us with three race/ethnicity categories (white, black, Latino/other). The Asian sample in the LAFANS is large and substantially different in their crowding experience to merit a separate category, leaving us with four race/ethnicity groups (white, black, Asian, Latino/other).
1.2.5 Methods
The analysis consists of two parts: a PSID-CDS longitudinal analysis based on pooled and fixed effects models, and a localized LAFANS analysis of cross-sectional ordinary least squares regressions. All analyses aim to clarify the relationship between housing crowding and five child wellbeing outcomes. We take advantage of the PSID-CDS longitudinal structure by first stacking the two waves and estimating pooled OLS models, and then estimating a model with child-specific fixed effects.22 Pooling each child’s information from two years doubles the sample size and increases our statistical power. We employ a fixed effects approach in order to control for a number of unmeasured factors, such as parenting practices, personality, and genetics that likely play a role in predicting child wellbeing. The explicit models in the pooled analysis may be underspecified, but the fixed effects approach can control for such time-invariant factors.
In the fixed effects procedure, we include only measured time-varying covariates – crowding, age, marital status, and income - as predictors in this model, because all time-invariant covariates are automatically controlled by differencing the effects between waves. Not only are measured time-invariant variables controlled, such as gender, nativity, mother’s education, and race, but also all unmeasured stable characteristics of individuals.23 Relative to our cross-sectional models, fixed effects models reduce omitted variable bias, thereby providing a stronger test of the possible causal impact of housing crowding. Still, because fixed effects modeling requires change in the independent variables and dependent variables in order to be considered for estimation, sample variability in both the independent and dependent variables is substantially reduced relative to the cross sectional measures, resulting in more sampling variability in coefficient estimates. The fixed effects technique is also limited because it cannot control for important unobserved factors that change over time.24
The second part of this analysis is a cross-sectional investigation using the LAFANS. We use ordinary least squared regression to model the effect of living in a crowded home on children’s wellbeing in an area with especially high rates of crowding, controlling for socioeconomic status.25 We compare these findings with the national analysis to see if the effect size or significance of crowding changes.
1.3 Results and Discussion
1.3.1 Descriptive Characteristics
Overall, the average values of our five dependent variables are similar between the 1997 and 2002 waves of the PSID-CDS. The average math reasoning and broad reading standard scores in 1997 in the CDS are 105.7 and 105.1 respectively.26 The average numbers of logged internal and external behavior problems in 1997 are 2.3 and 2.0, respectively. An average child in the 1997 CDS has “very good” health (4.3), lives in a home with about one person per room, and is about 7.3 years old.27 Most children in the CDS live in two-parent families, with about 36% living in single parent families. About 8% of the sampled households are first generation immigrants (migration was post-1968), and most of the children have white (47%) or black (41%) mothers. The average child has a mother with a high school education and a 1997 family income of about $50,000.
The PSID-CDS and LAFANS have some similarities, but differ in other key ways. Notably, about 44% of the sampled households in the LAFANS are first generation immigrants and more than half (55%) of the children have Latina mothers. The datasets also differ in their average levels of housing crowding with the LAFANS having a higher average crowding, higher proportion of children living in crowded homes, and a greater variance in the degree of housing crowding than the nation on whole. The PSID-CDS has a large sample of married mothers and fewer never married mothers than the LAFANS. Not surprisingly, the PSID-CDS also has a smaller proportion of Latinos and immigrants compared to LAFANS. In addition, the children from our PSID families have a higher total family income than those in LAFANS. As expected, our L.A. sample is more disadvantaged than our national sample. Most importantly, the L.A. context offers more varied housing crowding experiences, where mild crowding effects are more likely to be revealed.
Table 2 shows the average housing crowding level, standard deviation, and percentage for each of the independent variables in the LAFANS and both PSID-CDS waves. In the LAFANS and PSID-CDS, children whose mothers were never married live in more crowded housing than those whose mothers are married or were formerly married. Natives live in less crowded housing on average than immigrants. Mother’s education is inversely related to crowding, and this relationship is monotonic across education levels. Children with poorly educated mothers tend to live in more crowded housing than those with higher education. Like education, income is inversely and monotonically related to crowding. Whites (and Asians in L.A.) live in the least crowded housing on average compared to blacks and Latinos, with Latinos living in the most crowded conditions. The pattern of the relationship between crowding and other key variables in L.A. is similar to the nation overall, making our LAFANS analysis an example of what a more crowded nation could look like.
Table 2.
Average Household Crowding Level and Percentages for Independent Variables
| 1997 PSID-CDS
|
2002 PSID-CDS
|
2000 LAFANS
|
|||||||
|---|---|---|---|---|---|---|---|---|---|
| Mean 4-Yr Crowding |
Stnd. Dev |
% | Mean 4-Yr Crowding |
Stnd. Dev |
% | Mean Crowding |
Stnd. Dev |
% | |
|
|
|
|
|||||||
| Gender | |||||||||
| Male | 0.84 | 0.46 | 50 | 0.84 | 0.48 | 50 | 1.49 | 1.05 | 50 |
| Female | 0.92 | 0.65 | 50 | 0.89 | 0.54 | 50 | 1.46 | 0.97 | 50 |
| Total | 100 | 100 | 100 | ||||||
| Age | |||||||||
| 3-5 | 0.92 | 0.63 | 31 | na | na | 0 | 1.60 | 1.14 | 21 |
| 6-12 | 0.86 | 0.53 | 69 | 0.89 | 0.55 | 50 | 1.51 | 1.02 | 50 |
| 13-17 | na | na | 0 | 0.84 | 0.47 | 50 | 1.33 | 0.88 | 30 |
| Total | 100 | 100 | 101 | ||||||
| Marital Status | |||||||||
| Married | 0.87 | 0.56 | 74 | 0.85 | 0.50 | 73 | 1.41 | 0.99 | 65 |
| Divorced/Separated | 0.83 | 0.50 | 17 | 0.82 | 0.51 | 17 | 1.37 | 1.05 | 17 |
| Never Married | 1.03 | 0.63 | 9 | 1.04 | 0.54 | 9 | 1.80 | 1.02 | 18 |
| Total | 100 | 99 | 100 | ||||||
| Nativity | |||||||||
| Native | 0.74 | 0.27 | 85 | 0.75 | 0.36 | 84 | 1.11 | 0.61 | 44 |
| Immigrant | 1.69 | 0.98 | 15 | 1.43 | 0.74 | 16 | 1.77 | 1.16 | 56 |
| Total | 100 | 100 | 100 | ||||||
| Mother's Education | |||||||||
| <high school | 1.29 | 0.67 | 15 | 1.37 | 0.71 | 15 | 1.95 | 1.22 | 37 |
| high school grad | 0.93 | 0.62 | 37 | 0.88 | 0.50 | 37 | 1.52 | 0.92 | 20 |
| some college | 0.76 | 0.37 | 26 | 0.72 | 0.29 | 26 | 1.18 | 0.66 | 21 |
| college grad | 0.66 | 0.29 | 15 | 0.64 | 0.25 | 15 | 1.02 | 0.47 | 5 |
| >college | 0.63 | 0.43 | 7 | 0.64 | 0.29 | 7 | 0.90 | 0.46 | 17 |
| Total | 100 | 100 | 100 | ||||||
| Income | |||||||||
| <20k | 1.12 | 0.65 | 18 | 1.13 | 0.60 | 11 | 1.86 | 1.02 | 27 |
| 20-<45k | 0.93 | 0.60 | 27 | 0.97 | 0.60 | 24 | 1.67 | 1.21 | 36 |
| 45k+ | 0.77 | 0.47 | 55 | 0.78 | 0.42 | 65 | 1.01 | 0.49 | 37 |
| Total | 100 | 100 | 100 | ||||||
| Race | |||||||||
| White | 0.69 | 0.21 | 65 | 0.69 | 0.27 | 64 | 0.89 | 0.40 | 25 |
| Latino/other | 1.48 | 0.95 | 19 | 1.38 | 0.76 | 20 | 1.85 | 1.17 | 55 |
| Black | 0.92 | 0.38 | 16 | 0.90 | 0.41 | 16 | 1.27 | 0.59 | 11 |
| Asian | na | na | 0 | na | na | 0 | 1.07 | 0.45 | 9 |
| Total | 100 | 100 | 100 | ||||||
Note: Percentage totals may not add to 100 due to rounding error. This sample is equivalent to the one used for the model predicting physical health. Statistics may be slightly different in the samples for the other models. Observations are weighted
Before modeling the effects of crowding on children, we need to identify the functional form of crowding. Figure 1 portrays the relationship between housing crowding and math achievement scores in the LAFANS. The box graph shows a linear relationship across the lower crowding intervals, with more inconsistency towards the higher levels of crowding. This suggests a possible diminishing return to the negative effects of crowding at very high levels. Although Figure 1 suggests a non-linear relationship between housing crowding and math scores, we do not have sufficient evidence to support a non-linear treatment of housing crowding because the sample sizes are dramatically smaller at the point of curvature.28
Figure 1.
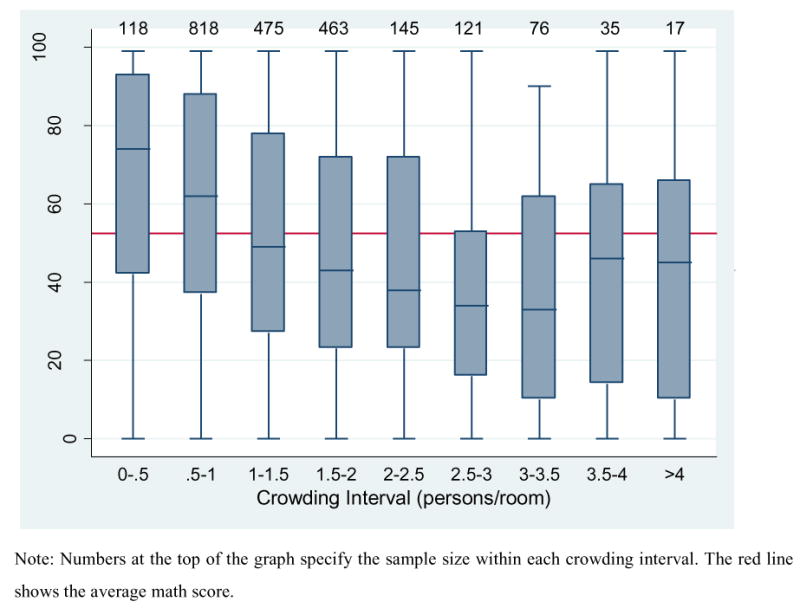
Boxplots for Associations between Math Scores and Household Crowding
1.3.2 Regression Analysis
In the first stage of our analyses, we exploit the extensive family history in the PSID and its longitudinal structure. First, we use a calculation of average crowding over a four year period for both waves of the PSID-CDS. Averaging crowding exposure over time rather than using single-year estimates maximizes the use of the data by looking at the child’s history of crowdedness and averaging it over a four-year period. This measure takes account of variability between children with short episodes of living in crowded housing and those children with more exposure to crowding. We then stack the two waves of data to form a pooled dataset and use pooled OLS estimation. We also run fixed effects models looking at within child differences over time, controlling for all time-invariant covariates that may affect child wellbeing.
Table 3 shows the pooled OLS29 and fixed effects estimates of the 4-year average crowding coefficients predicting each of the child wellbeing indicators. In the pooled analysis,30 we find significant negative effects of crowding on children’s math and reading scores. A unit increase in crowding significantly reduces children’s math scores by 4.3 standard points (p=.006) and reading scores by 6.8 standard points (p=.001). These findings control for demographics and SES, revealing that the home environment has an independent effect on the academic wellbeing of children throughout the nation.
Table 3.
Pooled and Fixed Effects Models of 4-Yr Crowding predicting Child Wellbeing Indicators, PSID-CDS
| Dependent Variables | Pooled | Fixed Effects | ||
|---|---|---|---|---|
|
| ||||
| 4-Yr Crowding | 4-Yr Crowding | |||
| Coeff.(RSE) | p | Coeff. (RSE) | p | |
|
| ||||
| Mathematics Score (N=2894) | -4.314 (1.581) | 0.006 | -1.108 (1.168) | 0.343 |
| Reading Score (N=1996) | -6.762 (2.077) | 0.001 | -0.085 (1.314) | 0.949 |
| Internal Behavior Score (log) (N=4046) | 0.028 (0.020) | 0.159 | 0.001 (0.020) | 0.943 |
| External Behavior Score (log) (N=4106) | 0.032 (0.020) | 0.110 | 0.042 (0.021) | 0.044 |
| Health (N=4168) | -0.054 (0.048) | 0.259 | -0.082 (0.044) | 0.063 |
Note: The Pooled and Fixed Effects models have a wide data structure and, therefore, double the sample size, such that the original sample size is N/2. In the pooled analysis, we report robust standard errors and use 1997 weights.
The effect of crowding on behavioral and physical health on U.S. children is less clear. Crowding is not statistically significant in predicting internal and external behavior problems and physical health. The sign of the coefficients, however, suggest that crowding harms both behavioral and physical health, with increases in the logged number of behavioral problems and a reduction in the one to five ranking of poor to excellent health.31
Table 3 also introduces the fixed effect estimates of the change in housing crowding over time to the change in child outcomes over time using the PSID-CDS.32 We estimate the effect of a unit increase in 4-year crowding between the two waves on the five child wellbeing outcomes between the waves, controlling for the time-varying covariates in the model – age, marital status, and income – as well as all other time-invariant covariates. The data contain some time-invariant measures that are important when studying housing crowding, including child’s gender, mother’s education, nativity, and race/ethnicity. Other time-invariant factors that may affect children’s wellbeing, however, are not in the data. The fixed effects approach is useful because it enables us to reduce bias and more accurately measure the effect of living in a crowded home on the wellbeing of children. It reduces omitted variable bias by controlling for unmeasured time-invariant factors, such as parenting practices, personality, and genetics.
The fixed effects models show few significant effects of crowding on child wellbeing; however, all crowding effects are in the expected direction. We find that a unit increase in 4-year housing crowding between the waves significantly increases external behavior problems by 4.2% between the waves (p=.044). We also find a marginally statistically significant effect of 4-year crowding on physical health. A unit increase in average crowding between the waves decreases health between the waves by .082 on the 1 to 5 scale (p=.063).
Although fixed effects models may reduce omitted variable bias in the OLS estimates by controlling for stable characteristics of the sample, they do not necessarily provide the best estimates of household crowding effects. First, the power of the fixed effects model depends on within-person variation between the two waves. Limited within-person variation reduces statistical power by yielding higher standard errors and may explain the lack of significance in our coefficients. Our 4-year crowding measure shows most children experiencing change in crowding over time (97.6%) and few children experiencing no change (2.4%); the degree of change, however, is minimal. Of the total, 91.6% experience some change between >0 and <=.5 persons per room in the level of average crowding over time.33
Second, although fixed effects are often regarded as exogenous to time-varying covariates (such as housing crowding), this need not be the case. Rather, fixed effects represent the child-specific average level of the outcome variables which, while correlated with the measured time-varying covariates, may be both causes and consequences of the fixed effects. Fixed effects estimates, therefore, may control for unmeasured variables that intervene between housing crowding and child outcomes as well as those that are predetermined with respect to crowding.
Our national analyses suggest a negative relationship between housing crowding and child wellbeing; however the effects are not consistently significant. By turning to our local representative sample in Los Angeles County, we may be able to determine if these effects are more clearly and consistently significant due to the broader range of crowding experienced by its children. The literature has shown inconsistent results with regard to crowding. Some claim that if socioeconomic conditions were controlled, the crowdedness of a home would no longer matter. The LAFANS suffers from the same cross-sectional nature of past research, but the setting offers a case where crowding levels range considerably and it is a representative sample of L.A. County.
For each child outcome in the LAFANS, living in a crowded home negatively affects wellbeing (See Table 4). Each additional person per room decreases math and reading test scores by 2.1 and 2.0 percentage points, respectively. Similarly, children’s behavior problems increase as their home environment becomes more crowded. An additional person per room is expected to increase children’s internal behavior problems, such as withdrawal or depression, by 2.6% and increase external behavior problems, such as a strong temper, by 4.4%.34 Finally, children’s general physical health declines by .044 (on a 1 to 5 scale) with a unit increase in housing crowding. All results are based on models that control for demographics and SES characteristics. All of these effects are statistically significant (p<.05 or p<.1).
Table 4.
Predicting Mathematics Score, Reading Score, Internal Behavior Problems, Exertnal Behavior Problems, and Health Rating, LAFANS 2000
| Independent Variables | Math (N=2265) | Reading (N=1806) | Internal Behavior (log)(N=2224) | External Behavior (log)(N=2223) | Health (N=2301) | |||||
|---|---|---|---|---|---|---|---|---|---|---|
|
|
||||||||||
| Coeff. | p | Coeff. | p | Coeff. | p | Coeff. | p | Coeff. | p | |
|
|
||||||||||
| Crowding | -2.068 | -2.042 | 0.026 | 0.044 | -0.044 | |||||
| 0.031 | 0.093 | 0.016 | 0.006 | 0.038 | ||||||
| Male | 3.209 | -7.25 | -0.007 | 0.068 | -0.046 | |||||
| 0.062 | 0.000 | 0.598 | 0.001 | 0.236 | ||||||
| Age | -0.45 | -1.918 | -0.004 | -0.009 | -0.006 | |||||
| 0.013 | 0.000 | 0.055 | 0.003 | 0.346 | ||||||
| Divorce/Separated (vs. Married) | -0.718 | -1.886 | 0.01 | 0.031 | -0.223 | |||||
| 0.761 | 0.532 | 0.729 | 0.380 | 0.008 | ||||||
| Never Married (vs. Married) | -4.101 | -8.634 | 0.111 | 0.13 | -0.023 | |||||
| 0.071 | 0.000 | 0.000 | 0.001 | 0.766 | ||||||
| Native Born (vs. Immigrant) | 2.738 | 7.429 | 0.063 | -0.078 | -0.16 | |||||
| 0.244 | 0.005 | 0.134 | 0.102 | 0.028 | ||||||
| Mother's Education | 1.458 | 1.399 | -0.009 | -0.008 | 0.035 | |||||
| 0.000 | 0.000 | 0.002 | 0.035 | 0.000 | ||||||
| Income (in 1000s) | 0.071 | 0.074 | -3E-04 | 0.000 | 0.0003 | |||||
| 0.000 | 0.000 | 0.020 | 0.895 | 0.325 | ||||||
| Latino/other (vs. White) | -9.629 | -6.094 | 0.023 | -0.021 | -0.277 | |||||
| 0.000 | 0.057 | 0.446 | 0.668 | 0.001 | ||||||
| Black (vs. White) | -8.742 | -7.544 | -0.017 | -0.037 | -0.445 | |||||
| 0.028 | 0.133 | 0.691 | 0.606 | 0.003 | ||||||
| Asian (vs. White) | 0.728 | -1.608 | -0.039 | -0.083 | 0.095 | |||||
| 0.820 | 0.690 | 0.538 | 0.288 | 0.338 | ||||||
| Intercept | 45.989 | 66.376 | 2.132 | 2.368 | 4.071 | |||||
| 0.000 | 0.000 | 0.000 | 0.000 | 0.000 | ||||||
|
|
||||||||||
| R-square | 0.2005 | 0.2114 | 0.1099 | 0.0516 | 0.1423 | |||||
Although the effects of crowding may seem small, we can relate the impact of housing crowding on a child’s life to other more familiar variables and put effect size in perspective. When we standardize the independent variables (or x-standardize), we find that a one standard deviation increase in housing crowding (equivalent to .98 persons per room) reduces math scores by 2 percentile points, while a standard deviation increase in primary caregiver’s education (equivalent to 4.3 years) increases math scores by 6.2 percentile points. A standard deviation increase in income (equivalent to $62,500) increases children’s math scores by 4.4 percentile points.
In summary, living in crowded housing conditions has an independent negative effect on math and reading achievement in the pooled national analysis, on external behavioral problems and physical health in the fixed effects national analysis, and all the child wellbeing outcomes in Los Angeles County. The national data offers a number of advantages over past research, including a nationally representative sample and panel data, which creates opportunities to use statistical techniques to improve on past limitations. Using a recent history of crowding information can more accurately represent children’s experience with their home environment. Those with a brief exposure to crowding will be averaged out using longitudinal data, while cross-sectional data may have characterized a child by housing characteristics at a single point in time. Pooling the two waves of the PSID-CDS gives us more precise estimates and stronger statistical power. Also, the fixed effects technique reduces omitted variable bias by controlling for important but unmeasured time-invariant factors that may account for the relationship between crowding and child wellbeing. The LAFANS offers clarity and consistency in the relationship between housing crowding and child wellbeing. The larger and stronger crowding effects in L.A. compared to the nation may be due to the broader range of crowding levels as well as the higher frequency of crowding experienced by its households.
Still, the reported results should be interpreted with some caution. While pooling the two PSID-CDS waves offers increased statistical power due to larger sample sizes, it does not control for unobserved heterogeneity. The fixed effects estimation allows us to control for all time-invariant parameters and rids us of potential biases in the cross-sectional models, however limited variability makes it difficult to conclusively determine whether or not housing crowding effects are still present. The LAFANS analyses are based on cross sectional data and, because persons living in crowded housing conditions tend to be more likely to suffer other forms of social deprivation, it is possible that our findings may be an artifact of failing to control for other aspects of children's environments that are correlated with crowding. Nonetheless, our results are consistent with the conclusion that the effects of housing crowding on children are large and pervasive, spanning cognitive, behavioral, and health outcomes.
1.4 Conclusion
Living in a crowded home is negatively associated with multiple aspects of child wellbeing, even after controlling for several dimensions of socioeconomic status. The effect of housing crowding on child wellbeing appear modest with the inclusion of socioeconomic controls; however, there remains a significant harmful effect on academic achievement in the U.S. based on the pooled OLS analysis, on external behavior problems and physical health in the U.S. based on average crowding in the fixed effects models, and on each area of child wellbeing in Los Angeles.
Our national analysis has added to the debate about the possible effects of the home environment on children. Some of our results suggest that a crowded home can indeed harm children’s wellbeing. The long-standing debate about whether housing crowding matters has had little resolution. Cross-sectional analyses cannot speak to a causal relationship between crowding and wellbeing; analyses that failed to control for socioeconomic factors left critics skeptical of crowding effects; studies using different measures of crowding (persons per room vs. persons per square foot, etc.) made findings difficult to compare; and, specialized settings of non-representative samples made findings difficult to generalize. This paper offers resolutions to these prior limitations. Our samples are representative of the broader population, both nationally and locally in Los Angeles County, and are, therefore, generalizable. The longitudinal nature of the PSID allows us to estimate a causal relationship between crowding and child wellbeing. The panel data also allow us to have a more reliable measure of children’s housing crowding exposure by having multiple estimates over time. We estimate multiple child outcomes and determine how the effect of crowding, measured in the same way, varies across wellbeing indicators. All of these contributions further informs the debate and contributes towards a resolution.
In Los Angeles, there are clear and significant negative effects of crowding on all indicators of child wellbeing, which is consistent with our theoretical argument and exemplifies the pervasiveness of these adverse effects. Although these data do not permit us to properly test the mechanisms through which crowding affects children’s outcomes, such as lacking space to study, concentration, and sleep, this analysis provides motivation for further research in this area.35 Given children’s consistent exposure to the home environment and that childhood is a critical period of development, more research on the home environment throughout childhood is necessary. Also, given the current economic climate and accompanying rise in housing foreclosure rates,36 the high levels of crowding in L.A. could become more common throughout the country, making research on housing crowding increasingly important.
Poor housing conditions have significant effects on different aspects of a child’s life. These negative effects during childhood can persist throughout life, ultimately affecting their future socioeconomic status and, likely, their adult wellbeing. It is important to identify aspects of a child’s living environment that may prove harmful in order to prevent them. If housing agencies and communities are provided with information on the deleterious effects of housing crowding, they can design housing programs that mitigate the effects of crowding and form standards for appropriate household unit size. The living environment, net of socioeconomic status, is an area that can contribute to the intergenerational transmission of social inequality. By better understanding the role of housing in the lives of children, we can ensure a healthy living space and reduce educational, behavioral and physical health disparities.
Highlights to “Housing Crowding Effects on Children's Wellbeing" (Social Science Research, MS# SSR-D-10-00280).
We look at the effects of crowded housing on children’s wellbeing in the US and LA.
We use longitudinal data to enhance our understandings of the home environment.
Crowded housing harms children’s school achievement, behavior, and physical health.
Net of socioeconomic characteristics, crowded housing significantly harms children.
We contribute to a long-standing debate on the importance of crowding.
Acknowledgments
We benefited from the financial support from the Russell Sage Foundation. This research was carried out using the facilities of the California Center for Population Research, which is supported by the National Institute of Child Health and Human Development.
Appendix A
Table A1.
Percent Occupied Housing Units with 1.01 or More Occupants Per Room
| Census 2000 | AHS 2001 | AHS 2003 | ACS 2003 | ACS 2004 | ||||||
|---|---|---|---|---|---|---|---|---|---|---|
|
|
||||||||||
| LA County | 22.9 | 12.7 | ||||||||
| CA | 15.2 | 9.9 | ||||||||
| US | 5.7 | 2.5 | 2.4 | 3.8 | ||||||
Note: Other datasets aside from Census offer crowding information. These include the American Housing Survey (AHS) and the American Community Survey (ACS). Because these datasets do not offer timetrends, however, we did not include these figures in Table 1. Furthermore, the estimates offered by AHS and ACS do not correspond well to those offered by Census. The 2001 and 2003 American Housing Survey’s (AHS) U.S. estimates and the 2004 American Community Survey (ACS) county and city-level estimates have considerably lower percentages for occupied housing units greater than one person per room compared to Census national-, county-, and city-level estimates in general, including L.A. County. According to Census staff, the Census underestimates number of rooms and overestimates household size, partly due to the nature of self-response surveys. They note that “self-response modes for a single question asking for the total number of rooms in the housing unit, where the definition of a room is subject to interpretation, is likely to produce a different estimate than a survey … conducted by interviewers that asks a battery of questions on how many rooms of specific types are in the unit” (Chapin, Marie, Love, and Cresce 2006). The ACS uses experienced field representatives to clarify the questions on number of rooms for respondents, improving the accuracy of the measure; however there is no accurate longitudinal information available. The LAFANS gathers information on number of rooms through a single item question, but it is also asked by and confirmed by an interviewer. The measure of housing crowding in the LAFANS, then, is more accurate than the Census figures. Though the estimates in AHS and ACS are consistently lower than Census, the comparisons between cities, counties, and the nation are consistent within datasets
Appendix B
Table B1.
Pooled Analysis Predicting Five Child Wellbeing Outcomes, PSID-CDS, Waves
| Independent Variables | Math (N=2894) |
Reading (N=1996) |
Internal Behavior (log) (N=4046) |
External Behavior (log) (N=4106) |
Health (N=4168) |
|||||
|---|---|---|---|---|---|---|---|---|---|---|
|
|
||||||||||
| Coeff. | p | Coeff. | p | Coeff. | p | Coeff. | p | Coeff. | p | |
|
|
||||||||||
| 4-Yr Crowding | -4.314 | -6.762 | 0.028 | 0.032 | -0.054 | |||||
| 0.006 | 0.001 | 0.159 | 0.110 | 0.259 | ||||||
| Male | 4.339 | -3.257 | 0.032 | 0.035 | -0.033 | |||||
| 0.000 | 0.001 | 0.035 | 0.020 | 0.300 | ||||||
| Age | -0.280 | -0.252 | -0.024 | 0.032 | 0.004 | |||||
| 0.005 | 0.086 | 0.000 | 0.000 | 0.411 | ||||||
| Divorce/Separated (vs. Married) |
0.506 | 2.531 | 0.098 | 0.099 | -0.053 | |||||
| 0.659 | 0.148 | 0.000 | 0.000 | 0.253 | ||||||
| Never Married (vs. Married) |
-0.059 | 0.829 | 0.075 | 0.120 | -0.180 | |||||
| 0.976 | 0.778 | 0.026 | 0.000 | 0.010 | ||||||
| Native Born (vs. Immigrant) |
-3.307 | 0.107 | 0.146 | 0.058 | ||||||
| 0.592 | na | na | 0.014 | 0.000 | 0.496 | |||||
| Mother‘s Education |
1.585 | 1.836 | -0.016 | -0.010 | 0.053 | |||||
| 0.000 | 0.000 | 0.000 | 0.006 | 0.000 | ||||||
| Income (in 1000s) |
0.010 | 0.009 | 0.000 | 0.000 | 0.000 | |||||
| 0.058 | 0.087 | 0.101 | 0.903 | 0.535 | ||||||
| Latino/other (vs. White) |
-5.177 | -6.235 | 0.031 | 0.052 | -0.053 | |||||
| 0.073 | 0.077 | 0.438 | 0.122 | 0.470 | ||||||
| Black (vs. White) |
-9.094 | -10.058 | -0.056 | -0.060 | -0.257 | |||||
| 0.000 | 0.000 | 0.015 | 0.017 | 0.000 | ||||||
| Intercept | 91.808 | 0.000 | 92.614 | 0.000 | 2.582 | 0.000 | 1.874 | 0.000 | 3.783 | 0.000 |
|
|
||||||||||
| R-square | 0.195 | 0.199 | 0.091 | 0.123 | 0.086 | |||||
Note: Results are based on robust standard errors and 1997 weights.
Footnotes
Conley (2001) is an exception, using longitudinal data to find crowding during childhood leads to lower levels of completed schooling by age 25. A study in France also uses longitudinal data to uncover a link between crowded housing and children’s repeating a grade in elementary or middle school (Goux and Maurin 2005).
We also test neighborhood crowding based on a series of measures, including persons per square mile and average neighborhood housing crowding, and do not conclusively find neighborhood effects on child wellbeing.
Appendix A compares crowding estimates from a variety of data sources for LA County, California, and the nation. We find the crowding estimates in the LAFANS are accurate.
The response rate for the 1997 PSID-CDS sample is 88% and 91% for the 2002 sample (PSID User’s Guide, 1997, 2002).
Note that primary care-givers assess children’s behavioral and physical health in the CDS, while parents offer such assessments in the LAFANS.
The response rate for LAFANS parents who were asked questions concerning their children is 89% (Peterson et al. 2003).
The percentile rank scores allow values between 0 and 100, similar to SAT scores.
Parents responded to these questions using a three-point Likert scale of how true each statement was of their child – “1” if often true, “2” if sometimes true, and “3” if not true. In order to calculate the index scale, the coding was changed (often true=2, sometimes true=1, not true=0) and each response across all appropriate items for that scale was summed. A score was not computed if any item was missing.
There is little variation of internal behavior problems along levels of crowding, with most observations showing low numbers of problems. A comparison of models with a continuous versus logged scale of internal behavior problems shows a preference (higher R-squared) for the model with the logged form. This is repeated for external behavior problems with similar results.
In the PSID-CDS, primary care-givers, who are mostly parents of the target child (96.4%), assess the child’s health.
Because the distribution of health status was concentrated near the excellent and good end of the scale, we tested a model using the natural log of health against the linear form; the BIC statistics revealed a better fit for the linear form.
The final sample sizes for the PSID-CDS analyses are: 1447 for math achievement, 998 for reading achievement, 2023 for internal behavior problems, 2053 for external behavior problems, and 2084 for physical health. The final sample sizes for the LAFANS analyses are: 2265 for math achievement, 1806 for reading achievement, 2224 for internal behavior problems, 2223 for external behavior problems, and 2301 for physical health.
Using the LAFANS, Solari (unpublished work 2005) experiments with different definitions of crowding, including a dichotomous measure of 0-1.0 versus greater than 1.0 person(s) per room, categorical levels of crowding, persons per bedroom, persons per room by age and household composition, and an interviewer assessment of whether or not they believe too many people occupy the space available in their home. She finds the continuous measure of persons per room to fit the data best. We also prefer the measure persons per room over persons per bedroom because of inconsistencies on how people define bedrooms. A den could be converted into a bedroom, for instance, and people may define these rooms inconsistently.
The independent variables in our PSID-CDS analysis all originate from the PSID rather than the CDS. The time-varying covariates, like crowding, age, mother’s marital status, and family income, are measured in 1997 and 2001. We refer to this second wave of data as the 2002 PSID-CDS, although the independent variables are collected in 2001 and the dependent variables are collected in 2002.
We subtract a value of one, to represent the kitchen, from the total number of rooms variable in the PSID for all units with two or more rooms. Because there was no separate kitchen indicator, we investigated the 2001 American Housing Survey to reference which types of units never had kitchens, and which did. We found that 100% of one room units did not have a kitchen, but 93% of all two room units and 100% of units with more than 2 rooms had at least one kitchen. Though some larger room units had more than one kitchen, we did not adjust for this because of its inconsistency.
To avoid excessive missing data, we average only non-missing values within the four-year period.
In the PSID-CDS, age is measured generally at the year of each survey wave.
Two other variables were tested but excluded from the final model. We explore sibling size because other children in a household may absorb parental resources, like time and money, which might then affect the target child’s wellbeing, and could account for the crowding effect. We find that controlling for sibling size does not alter the relationship between crowding and any child outcome in the LAFANS or the PSID-CDS. We also test for housing type (whether a dwelling unit is a single-family home, townhome, row house, duplex, apartment, housing project, mobile home, or other) based on findings from Conley (2001) that determine housing conditions, such as the presence of running water or broken windows, significantly predict adult educational attainment. No housing condition measures are available to aide in our analyses in the LAFANS, but one measure – housing type – is available in the PSID. We explore many categorizations of housing type and tested interactions with crowding, but find that housing type does not alter the relationship between crowding and any child outcomes. We do not include housing type in the model because it is not available in the LAFANS and we prefer a parsimonious model.
According to the 2003 American Community Survey, California is the second most crowded state in the nation (after Hawaii). California is also over 2.5 times more crowded than the U.S. overall.
In the LAFANS, we use the primary caregiver’s education instead of the mother’s (or father’s) education because the benefit of a parent’s education is best gained through contact with the child (Coleman 1988).
Income data in the LAFANS were not available in all cases. To minimize missing values from the analysis, we use an imputed income measure (See Bitler and Peterson (2004) for discussion of the imputation procedures). Another SES variable that could be added to the model is a measure of family wealth or assets. Both the LAFANS and PSID offer a measure of assets, however, the PSID did not collect wealth information in 1997, corresponding to Wave I of the CDS. Still, we test an imputed measure of total non-housing assets in the LAFANS (see Pebley and Sastry 2004 for details). We find that controlling for assets in our models does not alter the relationship between housing crowding and any child outcome. Due to preferences for parsimony, and a sufficiently high correlation between income and assets (r=.6436), such that income adequately represents household economic characteristics, we do not include assets in the final model. All results are available from the authors upon request.
We use individual-level fixed effects because the characteristics that may shape child outcomes operate at the individual level (rather than the family level, for instance).
We also conduct multiple indicator, multiple cause (MIMIC) models to determine whether these separate models can be combined to estimate general child wellbeing. Those results are available from the authors upon request.
For more details about fixed effects procedures, see Wooldridge (2010)
We run a series of models that begin with a zero-order effect of crowding predicting our child outcomes and progressively incorporates demographic and then SES indicators, revealing the gross and net effects of crowding on each outcome. This series of models allows us to identify the degree to which a set of control variables affect the observed gross relationship between crowding and wellbeing. We find that SES is responsible for much of the effect of housing crowding on child wellbeing, but it does not fully explain the relationship. Results are available from the authors upon request.
In percentile rank conversions, the average math reasoning score is 51.7 and the average broad reading score is 52.0.
The average age of children in the 2002 CDS is 12.5 years old.
We test other functional forms of household crowding, including logarithmic, quadratic, and exponential specifications, on all child outcomes, but Wald and BIC statistics indicate that the linear specification is adequate. We repeat this for the PSID-CDS samples. The patterns for math, reading, and health are clearly linear, with a vaguely linear pattern for the behavior problems. These results are available from the authors upon request.
We use 1997 weights for the pooled OLS estimates.
The pooled results are all based on robust standard errors since we are otherwise unable to account for the fact that we have each child represented twice in these models.
The full results of the pooled analysis are available in Appendix B. In other analyses, we look at crowding separately for 1997 and 2002, essentially cross-sectional analyses. We find significant negative effects of crowding on math scores, reading scores, and internal behavior problems in 1997 and significant negative effects on reading scores in 2002. The remaining outcomes have a less consistent relationship with housing crowding. The separate 1997 and 2002 results will be provided by the authors upon request.
Average 4-year crowding shows most children experiencing change in crowding over time (97.6%) and few children experiencing no change (2.4%). Of the total, 91.6% experience some change, positive or negative, in average crowding over time within .5 persons per room. The distribution of positive (47.8%) versus negative(49.8%) change in crowding over time is evenly distributed.
The range of change in 4-year crowding is from -3.6 to 4.2, with an even distribution of negative (49.8%) and positive change (47.8%).
A comparison of the relative effects of household crowding across the five outcomes in LAFANS reveals that internal behavior problems are most strongly affected by an additional person per room, with a -.09 standard deviation change. The standardized housing crowding coefficients are -.069 for math scores, -.068 for reading scores, .076 external behavior problems, and -.048 for physical health.
We tested if noise inside the house mediates the relationship between crowding and child outcomes. Noise was assessed on a 5-point scale from not at all noisy to very noisy. Data limitations made it difficult to determine conclusive results; however, the findings suggest that noise inside the home may be a mechanism explaining the negative effect of housing crowding on child wellbeing.
See a recent article (January 27, 2011) on national foreclosure rates: http://www.marketwire.com/press-release/2010-foreclosure-activity-down-hardest-hit-markets-but-increases-72-percent-major-metros-1386266.htm (last accessed on 8/15/11).
Publisher's Disclaimer: This is a PDF file of an unedited manuscript that has been accepted for publication. As a service to our customers we are providing this early version of the manuscript. The manuscript will undergo copyediting, typesetting, and review of the resulting proof before it is published in its final citable form. Please note that during the production process errors may be discovered which could affect the content, and all legal disclaimers that apply to the journal pertain.
Contributor Information
Claudia D. Solari, University of North Carolina, Chapel Hill.
Robert D. Mare, University of California, Los Angeles
References
- Baldassare M. Residential Crowding in Urban America. Berkeley, CA: University of California Press; 1979. [Google Scholar]
- Bauman KJ. Shifting Family Definitions: The Effect of Cohabitation and Other Nonfamily Household Relationships on Measures of Poverty. Demography. 1999;36(3):315–325. [PubMed] [Google Scholar]
- Beeghley L, Donnelly D. The Consequences of Family Crowding: A Theoretical Synthesis. Lifestyles: Family and Economic Issues. 1989;10(1):83–102. [Google Scholar]
- Bitler M, Peterson C. LAFANS Income and Assets Imputations: Description of Imputed Income/Assets Data for LAFANS Wave 1. 2004. [Google Scholar]
- Booth A, Johnson BR. The Effect of Crowding on Child Development. American Behavioral Scientist. 1975;18(6):736–749. doi: 10.1177/000276427501800602. [DOI] [PubMed] [Google Scholar]
- Booth A, Cowell J. Crowding and Health. Journal of Health and Social Behavior. 1976;17(6):204–220. [PubMed] [Google Scholar]
- Caldwell BM, Bradley RH. Manual for the Home observation for the Measurement of the Environment. Little Rock, AK: University of Arkansas Press; 1984. [Google Scholar]
- Calhoun JB. Population Density and Social Pathology. Scientific American. 1962;206:139–148. doi: 10.1038/scientificamerican0262-139. [DOI] [PubMed] [Google Scholar]
- Chapin WS, Marie J, Love SP, Cresce AR. Analysis of “Discrepancies among US Census, American Community Survey, and American Housing Survey”. Aug, 2006. (Email Correspondence)
- Clark W, Deurloo MC, Dieleman FM. Housing Consumption and Residential Crowding in U.S. Housing Markets. Journal of Urban Affairs. 2000;22(1):49–63. [Google Scholar]
- Coleman JA. Social Capital and the Creation of Human Capital. American Journal of Sociology. 1988;94:S95–S120. [Google Scholar]
- Conley D. A Room with a View or a Room of One's Own? Housing and Social Stratification. Sociological Forum. 2001;16(2):263–280. [Google Scholar]
- Duncan G, Brooks-Gunn J. Consequences of Growing up Poor. New York: Russell Sage; 1997. [Google Scholar]
- Edwards JN, Fuller TD, Vorakitphokatorn S, Sermsri S. Household Crowding and Its Consequences. Boulder, CO: Westview Press; 1994. [Google Scholar]
- Evans GW. The Built Environment and Mental Health. Journal of Urban Health. 2003;80(4):536–555. doi: 10.1093/jurban/jtg063. [DOI] [PMC free article] [PubMed] [Google Scholar]
- Evans GW. Child Development and the Physical Environment. Annual Review of Psychology. 2006;57:423–451. doi: 10.1146/annurev.psych.57.102904.190057. [DOI] [PubMed] [Google Scholar]
- Evans GW, Lepore SJ, Shejwal BR, Palsane MN. Chronic Residential Crowding and Children's Wellbeing: An Ecological Perspective. Child Development. 1998;69(6):1514–1523. [PubMed] [Google Scholar]
- Evans GW, Saegert S, Harris R. Residential Density and Psychological Health among Children in Low-Income Families. Environment and Behavior. 2001;33(2):165–180. [Google Scholar]
- Foley DL. The Sociology of Housing. Annual Review of Sociology. 1980;6:457–478. [Google Scholar]
- Friedman S, Rosenbaum E. Nativity Status and Racial/Ethnic Differences in Access to Quality Housing: Does Homeownership Bring Greater Parity? Housing Policy Debate. 2004;15(4):865–901. [Google Scholar]
- Goux D, Maurin E. The Effect of Overcrowded Housing on Children’s Performance at School. Journal of Public Economics. 2005;89:797–819. [Google Scholar]
- Gove WR, Hughes M. Overcrowding in the Household: An Analysis of Determinants and Effects. New York: Academic Press; 1983. [Google Scholar]
- Gove WR, Hughes M, Galle OR. Overcrowding in the Home: An Empirical Investigation of its Possible Pathological Consequences. American Sociological Review. 1979;44(1):59–80. [PubMed] [Google Scholar]
- Hauser RM, Brown BV, Prosser WR. Indicators of Child Wellbeing. New York: Russell Sage Foundation; 1997. [Google Scholar]
- Krivo LJ. Immigrant Characteristics and Hispanic-Anglo Housing Inequality. Demography. 1995;32(4):599–615. [PubMed] [Google Scholar]
- Leventhal T, Newman S. Housing and Child Development. Children and Youth Services Review. 2010;32:1165–1174. [Google Scholar]
- Mayer SE. What Money Can't Buy: Family Income and Children's Life Chances. Cambridge, MA: Harvard University Press; 1997. [Google Scholar]
- Myers D. Cohort longitudinal estimation of housing careers. Housing Studies. 1999;14:473–490. [Google Scholar]
- Myers D, Baer WC, Choi S. The Changing Problem of Overcrowded Housing. Journal of the American Planning Association. 1996;62(1):66–84. [Google Scholar]
- Myers D, Lee S. Immigration Cohorts and Residential Overcrowding in Southern California. Demography. 1996;33(1):51–65. [PubMed] [Google Scholar]
- The Panel Study of Income Dynamics Child Development Supplement: User Guide Supplement for CDS-I. 1997 Retrieved February 19, 2009 ( http://psidonline.isr.umich.edu/CDS/CDS1_UGSupp.pdf)
- The Panel Study of Income Dynamics Child Development Supplement: User Guide Supplement for CDS-II. 2003 Retrieved February 19, 2009 ( http://psidonline.isr.umich.edu/CDS/cdsii_userGd.pdf)
- Pebley AR, Sastry N. Los Angeles Family and Neighborhood Study (L.A.FANS): Original RAND Codebook, Imputed Household Income and Assets Data, Wave I, Public Use. Ann Arbor, MI: Inter-university Consortium for Political and Social Research 2004 [Google Scholar]
- Peterson C, Sastry N, Pebley AR, et al. The Los Angeles Family and Neighborhood Survey: Codebook. RAND Working Paper DRU-2400/2-LAFANS 2003 [Google Scholar]
- Saegert S, Evans GW. Poverty, Housing Niches and Health in the United States. Journal of Social Issues. 2003;59(3):569–590. [Google Scholar]
- Sastry N, Ghosh-Dastidar B, Adams J, Pebley AR. The Design of a Multilevel Survey of Children, Families, and Communities: The Los Angeles Family and Neighborhood Survey. Los Angeles: RAND Corporation 2003 [Google Scholar]
- StataCorp . Stata Statistical Software: Release 9. College Station, TX: StataCorp LP; 2005. [Google Scholar]
- Valins S, Baum A. Residential Group Size, Social Interaction, and Crowding. Environment and Behavior. 1973;5(4):421–440. [Google Scholar]
- Wenz FV. Household Crowding, Loneliness and Suicide Ideation. Psychology: A Quarterly Journal of Human Behavior. 1984;21(2):25–29. [Google Scholar]
- Wolch J, Li W. Shifting Margins of Housing Status in Los Angeles. Social Science Research. 1997;26:309–330. [Google Scholar]
- Wooldridge JM. Econometric Analysis of Cross Section and Panel Data. Cambridge, MA: The MIT Press; 2010. (Seconded.) [Google Scholar]