

Abstract
Background. Human immunodeficiency virus–infected patients with treated cryptococcal meningitis who start combination antiretroviral therapy (cART) are at risk of further neurological deterioration, in part caused by paradoxical cryptococcosis-associated immune reconstitution inflammatory syndrome (C-IRIS). We hypothesized that C-IRIS is associated with alterations of chemokine receptor expression on T cells and chemokine concentrations in cerebrospinal fluid (CSF) that enhance recruitment of T-helper 1 cells and/or myeloid cells to the central nervous system.
Methods. In a prospective study of 128 human immunodeficiency virus–infected patients with cryptococcal meningitis who received antifungal therapy followed by cART, we examined the proportions of CD4+ and CD8+ T cells expressing CCR5 and/or CXCR3, in CSF and whole blood and the concentrations of CXCL10, CCL2, and CCL3 in stored CSF and plasma.
Results. The proportion of CD4+ and CD8+ T cells expressing CXCR3+CCR5+ and the concentrations of CXCL10, CCL2 and CCL3 were increased in CSF compared with blood at cART initiation (P < .0001). Patients with C-IRIS (n = 26), compared with those with no neurological deterioration (n = 63), had higher CSF ratios of CCL2/CXCL10 and CCL3/CXCL10 and higher proportions of CXCR3+CCR5+CD8+T cells in CSF compared with blood at cART initiation (P = .03, .0053, and .02, respectively).
Conclusion. CD8+ T-cell and myeloid cell trafficking to the central nervous system may predispose patients to C-IRIS.
Keywords: HIV, cryptococcus, chemokines, immune restoration disease
Driven by the human immunodeficiency virus (HIV) epidemic, cryptococcal meningitis (CM) has become the leading cause of adult meningitis in southern and central Africa, killing an estimated 600 000 persons annually [1]. A further complication seen in up to 50% of HIV-infected patients with treated CM who start combination antiretroviral therapy (cART) is a paradoxical flare of CM-like symptoms and signs, termed paradoxical cryptococcosis-associated immune reconstitution inflammatory syndrome (C-IRIS) [2].
The pathogenesis of C-IRIS is unclear, but it is likely that different processes occur in the peripheral blood and in the central nervous system (CNS). The brain parenchyma has been considered an immune protected site, but it is immersed in cerebrospinal fluid (CSF) that is produced by the choroid plexus and circulates through the ventricles and subarachnoid space [3]. Studies of cryptococcosis in mice demonstrate significant differences in the cell phenotype and kinetics of the immune response in the brain, blood, and spleen [4]. Examining factors that contribute to pathogen entry and leukocyte infiltration into the CSF is likely to contribute to an understanding of the complex pathogenesis of human CM and C-IRIS.
Immunological responses to Cryptococcus spp. are characteristically driven by T-helper 1 (Th1) cells, with CXCR3 and CCR5 as homing receptors for effector T cells and natural killer (NK) cells and interferon (IFN) γ as the common effector molecule [5, 6]. CXCR3 is an inflammatory chemokine receptor associated with CD4+ Th1 and CD8+ cytotoxic T cells [7]. Murine models demonstrate that CXCR3 and its ligands regulate the migration of Th1 cells into sites of Th1 cell–driven inflammation [8]. CCR5 is also an inflammatory chemokine receptor expressed on activated T cells, and its expression on brain microvascular endothelial cells increases blood-brain barrier permeability [9]. Cryptococcosis in CCR5-deficient mice leads to increased brain damage, swelling, cranial distension, and loss of neural tissue integrity [10].
The ligands for CXCR3 are the chemokines CXCL9, CXCL10, and CXCL11 and the ligands for CCR5 are the chemokines CCL3, CCL4, CCL5, and CCL8, CCL11, and CCL13 [11, 12]. A small study examining HIV-infected patients with different opportunistic infections in the CNS found that patients coinfected with CM had significantly higher CSF concentration of CCL2, CCL3, CCL5, CXCL9, and CXCL10 than patients without opportunistic infections in the CNS [13]. CXCL10 (also known as IFN-γ–inducible-protein 10) is specific for CXCR3. However, most other chemokines are redundant, with multiple chemokines binding multiple chemokine receptors and vice versa [12]. For example, CCL2 (also known as monocyte chemoattractant protein 1) binds to CCR2 (expressed on activated monocytes), but CCR2 is also the receptor for multiple other chemokines, including CCL7, CCL8, CCL12, and CCL13 [11]. CCL3 (also known as macrophage inflammatory protein 1α) binds to both CCR1 and CCR5 [11]. Chemokines such as CXCL10 and CCL3 may be important in recruiting T cells and NK cells, whereas both CCL2 and CCL3 may be important in recruiting myeloid cells, such as monocytes and neutrophils, to the CNS in CM and changes in these chemokines and chemokine receptors on T cells in the CNS and the periphery may contribute to the pathogenesis of C-IRIS.
In a prospective, longitudinal study of HIV-infected patients with CM who received antifungal treatment followed by cART, we demonstrated distinct patterns in chemokine receptor expression and chemokine levels at the time of cART initiation, which were consistent with enhanced CD8+ T-cell and myeloid trafficking to the CSF and associated with development of C-IRIS.
METHODS
Patient Samples
In a prospective clinical study based in Durban, South Africa [14], 130 HIV-infected, cART-naive patients experiencing their first episode of CM were enrolled and treated with intensive antifungal therapy (14 days of amphotericin 1 mg/kg/d) followed by fluconazole (Figure 1); 106 patients began cART and were followed up for 24 weeks. Matched CSF and plasma samples were collected before and at the end of intensive antifungal therapy (at a median of 1 day after cessation of amphotericin therapy) and before initiation of cART. More blood samples were collected after 4, 12, and 24 weeks of cART.
Figure 1.
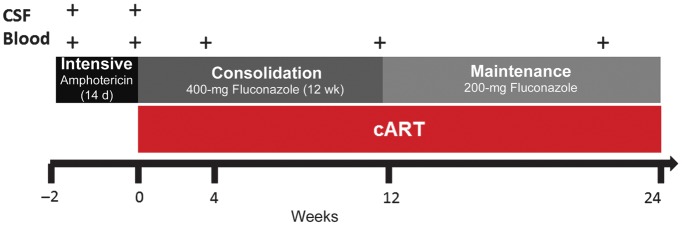
Timeline of blood and cerebrospinal fluid (CSF) collection in relation to antifungal therapy and combination antiretroviral therapy (cART).
Symptoms and signs, such as worsening headaches, seizures, confusion, visual change, or limb weakness, triggered consideration of a neurological deterioration (ND) event; these events were retrospectively analyzed and classified as probable C-IRIS, possible-C-IRIS, ND without C-IRIS, or indeterminate, based on predefined criteria [15]. Patients with probable or possible C-IRIS (n = 27) were compared with those with no ND (n = 63) [14]. All patients provided written informed consent, and the protocol was approved by the University of KwaZulu-Natal (BF053/09), Monash University (2009001224), and the University of Western Australia (RA/4/1/2541).
Reagents
R10 medium was made with 500 mL of Roswell Park Memorial Institute 1640 medium without L-glutamine and supplemented with 10 mmol/L L-glutamine, 50 mmol/L HEPES buffer, a penicillin-streptomycin-fungizone mixture (50 000 U/50 000 U/125 μg; all from Lonza Walkersville), and 10% fetal calf serum (PAA Laboratories). Red cell lysis buffer consisted of 7.7 g of ammonium chloride and 0.84 g of sodium bicarbonate in 1 L of distilled water.
Chemokine Receptor Expression
The CSF samples were centrifuged at 750 g for 10 minutes, the cell pellet was resuspended in 1 mL of R10, and 100 μL of whole blood was lysed with 3 mL of red-cell lysis buffer. Cells were stained with CD3 phycoerythrin–cyanine 7, CD4 peridinin chlorophyll protein complex (PerCP)–cyanine 5.5, CD8 fluorescein isothiocyanate, CCR5 phycoerythrin, and CXCR3 allophycocyanin (APC) (BD Biosciences), incubated at 15 minutes in the dark at room temperature. Data were acquired on a LSRII (BD Biosciences) flow cytometer with a recording threshold of 30 000 CD3+ T cells, using FACSDiva software v6 (BD Biosciences) and FlowJo software for analysis v7.6.4 (TreeStar).
Assay of CSF Chemokine Concentrations
Stored CSF and plasma were analyzed for CXCL10, CCL2, and CCL3 concentrations using customized multiplex Bio-Plex Pro assays according to the manufacturer's instructions (Bio-Rad). Samples were diluted 1:4. Levels were analyzed with a Bio-Plex 200 suspension array system using Bio-Plex Manager 5.0 software. The CCL2/CXCL10 and CCL3/CXCL10 ratios were explored as a post hoc analysis to determine the relative contribution of T-cell and myeloid cell chemoattractants in C-IRIS.
Statistical Analysis
Continuous variables were assessed for skew and summarized using mean and standard error or median and interquartile range (IQR) as appropriate and analyzed using either a t test or a Wilcoxon rank sum test. Immunological predictors for C-IRIS that we identified were corrected for CD4+ T-cell count and CSF cryptococcal sterility at cART initiation, using quantile median regression. Matched nonparametric data were compared using Wilcoxon signed rank test. Predictors of time to C-IRIS were analyzed using univariable Cox proportional hazards regression. Reported P values were 2 tailed, and in these analyses differences were considered significant at P < .05.
Overall differences for each variable were tested with the Kruskal-Wallis statistic. If a significant difference was seen, each pair of time points were tested separately using a Wilcoxon rank sum test with Bonferroni adjustment, in which differences were considered significant at P <.0083. All analyses were performed using Stata v.12 (StataCorp) and GraphPad Prism v5 software.
RESULTS
Patient Demographics
At enrollment, the median age of the patients was 33.5 years (IQR, 28.8–39.3 years), and 57% were male. The median CD4+ T-cell count was 35 cells/µL (IQR, 9–77 cells/µL), and the median plasma HIV RNA level was 5.2 log10 copies/mL (IQR, 4.7–5.7 log10 copies/mL). Of 106 patients who began cART, 21 died. The median time duration of amphotericin therapy for the cohort who began cART was 14 days (IQR, 14–15 days).
At initiation of cART, patients with C-IRIS (n = 27) had lower CD4+ T-cell counts than those with no ND (n = 63; median, 16 [IQR, 6–53] vs 36 [IQR, 16–83] cells/μL; P = .02), but there was no significant difference in age (P = .70), plasma HIV RNA levels (P = .32), or CSF or serum cryptococcal antigen levels (P = .95 and .76, respectively) [14]. The most common clinical features of C-IRIS included headache (79.4%), nausea or vomiting (64.7%), neck pain (38.2%), and seizures (23.5%), and an analysis of the clinical risk factors for C-IRIS in our cohort have recently been published [14].
Proportion of CXCR3+CCR5+ CD4+ and CD8+ T Cells and CXCR3+CCR5− CD8+ T cells in CSF After Intensive Antifungal Therapy
We first explored the effect of intensive antifungal therapy on T cells expressing CXCR3+ or CCR5+. In the CSF, after intensive antifungal therapy, we demonstrated a decline in the CD4+/CD8+ T-cell ratio (P = .0001), an increased proportion of CXCR3+CCR5+ CD4+ and CD8+ T cells and CXCR3+CCR5− CD4+ T cells, and a decreased proportion of CXCR3−CCR5+ CD4+ and CD8+ T cells (all P < .0001; Table 1). In blood, we demonstrated only an increase in the proportion of CXCR3+CCR5+ CD4+ T cells (P = .002; Table 1).
Table 1.
CD4+/CD8+ T-Cell Ratios and Percentage Expression of CXCR3 and CCR5 on CD4+ and CD8+ T Cells Before and After Intensive Antifungal Therapy in Blood and CSF Samplesa
| Blood |
CSF |
|||||
|---|---|---|---|---|---|---|
| Start of Therapy | End of Therapy | P Value | Start of Therapy | End of Therapy | P Value | |
| CD4+/CD8+ T-cell ratio | 0.31 (0.06–0.62) | 0.28 (0.09–0.72) | NS | 0.13 (0.06–0.21) | 0.05 (0.02–0.12) | .001 |
| Proportion of CD4+ T cells, % | ||||||
| CXCR3+CCR5− | 12.6 (7.2–24.9) | 12.5 (4.5–20.2) | NS | 12.3 (3.3–21.3) | 20.5 (9.0–34.3) | <.0001 |
| CXCR3+CCR5+ | 6.1 (2.3–14.1) | 4.2 (1.7–46.3) | .002 | 18.5 (7.5–39.2) | 39.0 (23.6–100.0) | <.0001 |
| CXCR3-CCR5+ | 15.4 (5.4–28.9) | 14.5 (4.1–29.6) | NS | 22.9 (12.0–36.8) | 11.5 (4.4–21.4) | <.0001 |
| Proportion of CD8+ T cells, % | ||||||
| CXCR3+CCR5− | 11.0 (5.1–17.0) | 9.9 (6.1–16.2) | NS | 3.2 (1.8–5.9) | 4.3 (2.0–7.9) | NS |
| CXCR3+CCR5+ | 16.6 (10.3–31.7) | 18.6 (11.4–28.0) | NS | 43.1 (26.6–56.9) | 74.7 (62.0–85.1) | <.0001 |
| CXCR3−CCR5+ | 23.3 (12.2–35.9) | 27.4 (17.8–37.5) | NS | 40.0 (30.0–52.8) | 14.9 (7.0–25.0) | <.0001 |
Abbreviations: CSF, cerebrospinal fluid; NS, not significant.
a Values represent medians (interquartile ranges).
Proportions of CXCR3+CCR5+ CD4+ and CD8+ T cells and Concentrations of CXCL10, CCL2, and CCL3 in CSF vs Blood Before cART Initiation
To determine whether the CSF compartment displayed distinct immunological responses compared with blood in HIV-infected patients with treated CM, we assessed chemokine concentrations and chemokine receptor expression on T cells in blood and CSF collected at cART initiation (and at completion of intensive antifungal therapy). The CD4+/CD8+ T-cell ratio in CSF was substantially lower than in blood (all P < .0001; Figure 2A and 2B) , whereas concentrations of CXCL10, CCL2 and CCL3 were higher in CSF (all P < .0001; Figure 2C).
Figure 2.

Differences in cerebrospinal fluid (CSF; blue) and blood (red) before cART initiation. A, Percentage CD4+ T cells and CD8+ T cells. B, CD4+/CD8+ T cell ratio. C, Concentrations of CXCL10, CCL2, and CCL3. D,E, Proportions of CD4+ (D) and CD8+ (E) T cells expressing CXCR3, CCR5, or CXCR3/CCR5. Data are shown as box and whisker plots, with the middle, lower, and upper lines of boxes representing the medians and the 25th and 75th percentiles, respectively. ***P < .001; ****P < .0001.
The proportions of CXCR3+CCR5+ and CXCR3+CCR5− CD4+ T cells were higher in CSF than in blood, whereas the proportion of CXCR3−CCR5+CD4+ T cells was lower in CSF than in blood (all P < .0001; Figure 2D). CXCR3+CCR5+ CD8+ T-cell counts were higher in CSF than in blood, and CXCR3+ CCR5− and CXCR3−CCR5+ CD8+ T-cell counts were higher in blood (all P < .0001; Figure 2E).
cART-Induced Changes in Chemokine Receptor Expression on T Cells in Blood and Plasma Chemokine Levels
Longitudinal analysis of plasma chemokine levels and chemokine receptor expression on T cells in blood over 24 weeks of cART revealed that the proportion of CXCR3+CCR5− and CXCR3+CCR5+ CD4+ T cells increased in the first 4 weeks of cART (Figure 3A), with no significant change in the proportion of CXCR3−CCR5+CD4+ T cells. The proportion of CXCR3+ CCR5−CD8+ T cells also increased in the first 4 weeks of cART, whereas the proportion of CXCR3+CCR5+ and CXCR3−CCR5+CD8+ T cells decreased over 24 weeks (Figure 3B). Plasma levels of CXCL10, CCL2, and CCL3 decreased over 24 weeks of cART (P ≤ .0001, <.0001, and .001, respectively; Figure 3C).
Figure 3.

Expression of CXCR3 and CCR5 in CD4+ (A) and CD8+ (B) T cells in blood and concentration of the chemokines CXCL10, CCL2, and CCL3 in plasma (C) before and after combination antiretroviral therapy (cART). Medians and interquartile ranges are shown. **P < .01; ***P < .001; ****P < .0001.
Proportions of CXCR3+CCR5+ CD8+ T cells in CSF and Blood and Chemokine Ratios in CSF at cART Initiation in Patients Who Developed C-IRIS
To determine immunological predictors of C-IRIS, we next compared patients who developed C-IRIS and patients with no ND. At cART initiation, patients who developed C-IRIS had lower CD4+/CD8+ T-cell ratios in blood and in CSF (P = .03 and .046) than patients with no ND, and the proportion of CXCR3+CCR5+ CD8+ T cells were lower in blood (P = .03) but not CSF (Table 2). Chemokine receptor expression on CD4+ T cells did not differ between groups. In a post hoc analysis, we found that the CSF-blood ratio of CXCR3+CCR5+CD8+ T cells was higher in patients who developed C-IRIS than in those with no ND (P = .02) (Figure 4A). Because we previously identified low CD4+ T-cell counts and positive CSF cryptococcal cultures at cART initiation as significant risk factors for C-IRIS [14], we adjusted for both parameters and found that the association remained significant after correction for CSF sterility (P = .04) but was of borderline significance after correction for CD4+ T-cell count at cART initiation (P = .052).
Table 2.
CD4+/CD8+ T-Cell Ratios, Percentage Expression of CXCR3 and CCR5 on CD4+ and CD8+ T Cells, and CXCL10, CCL2, and CCL3 Levels in Blood and CSF Samples at cART Initiation in Patients With No ND and Patients With C-IRIS
| Blood |
CSF |
|||||
|---|---|---|---|---|---|---|
| No ND | C-IRIS | P Value | No ND | C-IRIS | P Value | |
| CD4+/CD8+ T-cell ratio | 0.30 (0.11–0.74) | 0.14 (0.02–0.43) | .03 | 0.06 (0.02–0.13) | 0.02 (0.01–0.07) | .046 |
| Proportion of CD4+ T cells, % | ||||||
| CXCR3+CCR5− | 12.6 (4.5–21.6) | 10.8 (2.9–17.3) | NS | 21.4 (10.1–34.9) | 15.9 (8.4–32.6) | NS |
| CXCR3+CCR5+ | 4.4 (1.8–8.9) | 2.7 (0.8–7.9) | NS | 38.7 (20.5–51.8) | 43.0 (30.4–60.8) | NS |
| CXCR3−CCR5+ | 12.3 (3.8–31.0) | 14.5 (3.1–34.0) | NS | 11.5 (4.7–17.2) | 16.5 (3.6–26.0) | NS |
| Proportion of CD8+ T cells, % | ||||||
| CXCR3+CCR5− | 9.9 (6.2–16.3) | 11.4 (5.9–17.1) | NS | 4.4 (2.1–7.9) | 4.2 (1.9–8.3) | NS |
| CXCR3+CCR5+ | 21.4 (13.8–30.0) | 12.6 (10.4–25.8) | .03 | 74.0 (60.0–83.9) | 77.4 (71.3–86.0) | NS |
| CXCR3−CCR5+ | 26.3 (18.4–36.5) | 27.2 (16.5–41.2) | NS | 15.0 (6.3–27.2) | 11.0 (8.2–23.0) | NS |
| CXCL10, pg/mL | 3.0 (1.8–5.0) ×103 | 2.5 (1.8–4.8) × 103 | NS | 5.5 (2.4–9.4) × 104 | 2.6 (1.7–7.0) × 104 | NS |
| CCL2, pg/mL | 4.9 (2.8–9.8) ×101 | 6.2 (2.8–11.7) ×101 | NS | 2.5 (1.6–5.1) × 102 | 4.4 (2.0–11.7) × 102 | NS |
| CCL3, pg/mL | 1.8 (0.1–19.1) | 1.7 (1.0–7.8) | NS | 7.1 (4.2–15.7) | 12.7 (6.6–242.8) | NS |
Abbreviation: cART, combination antiretroviral therapy; C-IRIS, cryptococcosis-associated immune reconstitution inflammatory syndrome; CSF, cerebrospinal fluid; ND, neurological deterioration; NS, not significant.
a Values represent medians (interquartile ranges).
Figure 4.
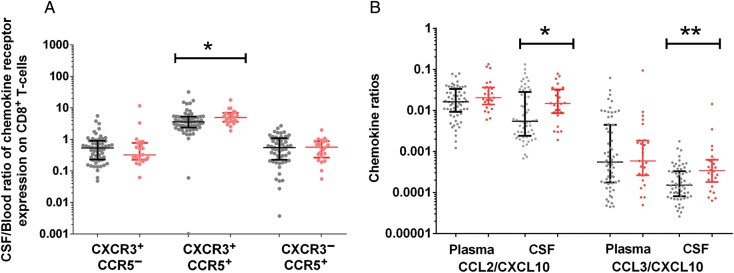
Chemokine receptor expression and chemokine concentration in patients with cryptococcosis-associated immune reconstitution inflammatory syndrome (red) and patients with no neurological deterioration (grey) before initiation of combination antiretroviral therapy. A, Cerebrospinal fluid (CSF)–blood ratios of CD8+CXCR3+CCR5+ T cells. B, CCL2/CXCL10 and CCL3/CXCL10 ratios in plasma and CSF. Data are shown as scatter dot plots with medians and interquartile ranges. *P < .05; **P < .01.
There were no differences in the concentrations of CXCL10, CCL2, or CCL3 in plasma or CSF between patients with C-IRIS and those with no ND (Table 2). To determine whether patients who later developed C-IRIS had a CSF chemokine response associated with monocyte-macrophage activation, as opposed to one associated with Th1 lymphocyte recruitment, we also examined the ratio of CCL2 and CCL3 to CXCL10 in CSF in a post hoc analysis. The CCL2/CXCL10 and CCL3/CXCL10 ratios in CSF were higher in patients with C-IRIS than in those with no ND (P = .02 and .005, respectively; Figure 4B); this differences remained statistically significant after adjustment for CSF sterility and CD4+ T-cell count at cART initiation. Longitudinal analysis after 24 weeks of cART revealed no further differences between groups (data not shown).
Association With CSF Sterility and Post-cART Death
We also explored the relationship between chemokine receptor expression and chemokine concentration with CSF sterility and death after cART. Compared with patients who remained cryptococcal culture positive (n = 55) at cART initiation, those who achieved a negative CSF cryptococcal culture prior to initiation of cART (n = 51), had a significantly lower CSF CCL2 (P = .005), and CCL3 (P = .006) levels, lower CSF CCL2/CXCL10 (P = .01) and CCL3/CXCL10 (P = .003) ratios, and lower CSF CD8+ T-cell counts (P = .04).
The patients who died after cART (n = 21), had a significantly higher CSF CCL2/CXCL10 ratio at cART initiation than those who survived to 24 weeks after cART (n = 85; P = .03), but CSF CCL3/CXCL10, chemokine levels, and chemokine receptor levels did not differ significantly between the 2 groups.
DISCUSSION
In the current study, we showed that after intensive antifungal therapy of HIV-infected patients with CM, in CSF there is enrichment for CD4+ and CD8+ T cells coexpressing CCR5 and CXCR3, and CD8+ T cells predominate over CD4+ T cells. In addition, concentrations of CXCL10, CCL2, and CCL3 were higher in CSF than in plasma. After intensive antifungal therapy and before cART initiation, patients who subsequently developed C-IRIS exhibited increased CCL2/CXCL10 and CCL3/CXCL10 ratios in CSF, independent of baseline CD4+ T-cell counts, and an increased proportion of CXCR3+CCR5+ CD8+ T cells in CSF relative to blood. These associations were independent of Cryptococcus-positive CSF cultures at the time of cART initiation, an important clinical risk factor for C-IRIS [15]). In light of our previously reported findings that cryptococcal-specific CD4+ T-cell responses are lower in patients who subsequently develop C-IRIS [16], we suggest that a combination of lower CD4+ T-cell responses and higher CD8+ T-cell or monocyte-macrophage responses to cryptococci in the CSF are risk factors for C-IRIS.
We showed that CD4+ and CD8+ T cells in the CSF are greatly enriched for CXCR3 expression during acute CM, a finding that persists after antifungal therapy. Recruitment of effector T cells into the CNS is a key host response to cryptococcal infection, but this may also contribute to further CNS damage. CNS inflammation may contribute to cerebral edema and lead to intracerebral hypertension and seizure activity. In animal models of lymphocytic choriomeningitis [17], herpes simplex virus encephalitis, and cerebral malaria [18], CXCR3-deficient mice demonstrated a failure of migration of activated CD8+ T cells from the meninges into the brain parenchyma contributing to a reduction in mortality. In children with cerebral malaria, higher CSF CXCL10 levels were associated with increased mortality [18]. CXCR3 antagonists that inhibit the CXCL10-CXCR3 axis (thereby interfering with lymphocyte transmigration) are in preclinical and clinical development [19, 20] and may be a potential therapeutic strategy in HIV-associated CM [21].
CD4+ T cells in CNS are essential for leukocyte recruitment and cryptococcal clearance [22]. Previous studies have shown that a reduction in the CSF T-cell CD4+/CD8+ ratio is seen early in HIV infection and is more marked in CSF than in blood [23]. We showed clear enrichment of CXCR3+CCR5+ CD8+ T cells in the CSF after antifungal therapy. Entry of leukocytes and chemokines into the CSF is probably facilitated by ongoing inflammation and breakdown in the blood-brain barrier by both cryptococci and HIV.
An increase in the CSF-blood ratio for effector CD8+ T cells may also contribute to C-IRIS, independent of CSF sterility at cART initiation. A predominance of CD8+ T cells in the CNS in toxoplasmic encephalitis–IRIS [24] and progressive multifocal leukoencephalopathy–IRIS [25] has been previously reported, lending weight to the importance of CD8+ T cells in the pathogenesis of IRIS in the CNS. Previous studies of HIV-CM have shown that patients who develop C-IRIS have lower levels of tumor necrosis factor α, IFN-γ, interleukin 8, eotaxin, and interleukin 6 in the CSF before beginning cART than patients without C-IRIS [26], and higher levels of CSF IFN-γ have been shown to be associated with improved rates of fungal clearance [27].
Infected monocytes as a “Trojan horse” bearing Cryptococcus spp., are critical to CNS neuroinvasion [28] and may also be important in the pathogenesis of C-IRIS. Barber et al [29] have recently suggested a new model of mycobacterial IRIS, wherein the uncoupling of innate and adaptive immune responses during mycobacterial infection in the absence of CD4+ T cells sets the stage for hyperactivation of innate immune cells when antigen-specific CD4+ T-cell numbers are later restored after cART. Although patients who developed C-IRIS did not exhibit elevated levels of the chemokines CCL2 and CCL3, which both bind to receptors expressed on monocytes, CD4+ memory T cells, and NK cells [30, 31], we did observe increased CCL2/CXCL10 and CCL3/CXCL10 CSF ratios. Given that CCL2 and CCL3 are chemotactic for monocytes, macrophages, neutrophils, and T cells, whereas CXCL10 is chemotactic only for CXCR3+ lymphocytes, one interpretation of our data is that patients who develop C-IRIS exhibit a relative abundance of chemokines that promote monocyte and neutrophil infiltration into the CSF.
Novel antagonists of CCR2—the receptor for CCL2—are in development [32] and have been tested in murine models [33] but not yet in humans with CNS conditions. Results were recently presented for a phase II study of the CCR2 and CCR5 antagonist, cenicriviroc, in combination with tenofovir and emtricitabine in HIV-infected patients, showing evidence of both antiviral and anti-inflammatory activity [34]. Details of CNS penetration efficacy of cenicriviroc are not available, but based on our data, we suggest that clinical trials of cenicriviroc could be considered in HIV-CM–coinfected, cART-naive patients, incorporating immunological markers identified in our study. Although findings of a recent study [35] suggested the addition of maraviroc, a CCR5 antagonist, did not reduce IRIS occurrence or severity, enrollment was not targeted at patients with a recent opportunistic infection. Evaluation of cenicriviroc may be warranted in patients with a specific opportunistic infection, such as CM.
Although ours is the largest prospective single-site study of HIV-CM coinfection that also examined compartmentalization of immune parameters in the CSF longitudinally, it has some limitations. First, because we did not include controls with HIV monoinfection or CM monoinfection and healthy controls, we were unable to clearly attribute whether the changes we noted were secondary to CM, HIV, or both. However, sample collection after sequential treatment of cryptococcus and HIV allowed us to determine changes after control of each pathogen. Second, our chemokine panel was focused but small. A systems biology approach to define novel pathways that are uniquely up- or down-regulated in C-IRIS may be useful in the future. Third, we did not specifically examine monocyte subsets or activation. Other CNS plasma biomarkers that could be considered in future studies include neopterin, which is predominantly produced by monocytes and macrophages; neurofilament light chain protein as an indicator of axonal injury [36]; soluble CD163, a marker of macrophage activation [37]; and HIV RNA in CSF, as a measure of local HIV infection. Neuroimaging markers may also be of interest [38]. Finally, given that cryptococcal infection of the CNS is a spectrum of meningoencephalitis, cryptococcomas, arachnoiditis, and vasculitis, our CSF findings were not representative of changes in the brain parenchyma. Clearly, however, brain biopsies were not feasible in this setting.
In conclusion, we demonstrated that CM in HIV-infected patients is characterized by enrichment of CSF for T cells expressing CXCR3 and/or CCR5 and increased CSF concentrations of CCL2, CCL3, and CXCL10 compared with blood. A higher CSF-blood ratio of CXCR3+CCR5+CD8+ T cells and a higher ratio of CCL2/CXCL10 and CCL3/CXCL10 in the CSF, was seen at cART initiation in patients who developed C-IRIS. A higher CSF CCL2/CXCL10 ratio was also associated with persistent cryptococcal culture growth and death after cART. We suggest that CD8+ T-cell or myeloid cell responses to crytococci in the CNS may facilitate migration of cells to the CNS and predispose to C-IRIS. Examination of blood and CSF chemokines and T-cell chemokine receptor expression before the initiation of cART could potentially identify patients at highest risk of C-IRIS. Finally, blocking the recruitment of inflammatory cells into the CSF through inhibition of CCR2, CCR5, or CXCR3 may provide new approaches to reduce the incidence of C-IRIS and should be considered for evaluation in future randomized controlled trials.
Supplementary Data
Supplementary materials are available at The Journal of Infectious Diseases online (http://jid.oxfordjournals.org/). Supplementary materials consist of data provided by the author that are published to benefit the reader. The posted materials are not copyedited. The contents of all supplementary data are the sole responsibility of the authors. Questions or messages regarding errors should be addressed to the author.
Notes
Acknowledgments. We would like to acknowledge the patients and their families and the staff at HIV Pathogenesis Programme and King Edward VIII Hospital, Durban.
M. A. F., A. L., S. R. L., and C. C. C. designed the experiments. C. C. C., S. R. L., M. A. F., and T. S. analyzed the data. C. C. C., S. R. L., and M. A. F. wrote the manuscript. C. C. C. and S. O. performed the immunological assays. C. C. C. and B. I. G. conducted the clinical study. M. A. F., S. R. L., C. C. C., A. L., T. N., W. H. C., J. H. E., and M. Y. S. M. were members of the protocol steering committee. All authors read and approved the final manuscript.
Financial support. This work was supported by the REACH Initiative (Research and Education in HIV/AIDS for Resource Poor Countries), a Pfizer Neuroscience Research grant, the Australian Commonwealth Government for the (Australian postgraduate award 2009 to C. C. C.), the Australian National Health and Medical Research Council (postgraduate scholarship 2010–2012 to C. C. C., grant 510448 to M. A. F., and practitioner fellowship to S. R. L.), the Howard Hughes Medical Institute (International Early Career Scientist grant to T. N.), and the South African Department of Science and Technology/National Research Foundation Research Chairs Initiative (T. N.). The authors gratefully acknowledge the contribution to this work of the Victorian Operational Infrastructure Support Program received by the Burnet Institute.
Potential conflicts of interest. All authors: No reported conflicts.
All authors have submitted the ICMJE Form for Disclosure of Potential Conflicts of Interest. Conflicts that the editors consider relevant to the content of the manuscript have been disclosed.
References
- 1.Park BJ, Wannemuehler KA, Marston BJ, Govender N, Pappas PG, Chiller TM. Estimation of the current global burden of cryptococcal meningitis among persons living with HIV/AIDS. AIDS. 2009;23:525–30. doi: 10.1097/QAD.0b013e328322ffac. [DOI] [PubMed] [Google Scholar]
- 2.Muller M, Wandel S, Colebunders R, Attia S, Furrer H, Egger M. Immune reconstitution inflammatory syndrome in patients starting antiretroviral therapy for HIV infection: a systematic review and meta-analysis. Lancet Infect Dis. 2010;10:251–61. doi: 10.1016/S1473-3099(10)70026-8. [DOI] [PMC free article] [PubMed] [Google Scholar]
- 3.Galea I, Bechmann I, Perry VH. What is immune privilege (not)? Trends Immunol. 2007;28:12–8. doi: 10.1016/j.it.2006.11.004. [DOI] [PubMed] [Google Scholar]
- 4.Lortholary O, Improvisi L, Rayhane N, et al. Cytokine profiles of AIDS patients are similar to those of mice with disseminated Cryptococcus neoformans infection. Infect Immun. 1999;67:6314–20. doi: 10.1128/iai.67.12.6314-6320.1999. [DOI] [PMC free article] [PubMed] [Google Scholar]
- 5.Sallusto F, Impellizzieri D, Basso C, et al. T-cell trafficking in the central nervous system. Immunol Rev. 2012;248:216–27. doi: 10.1111/j.1600-065X.2012.01140.x. [DOI] [PubMed] [Google Scholar]
- 6.Qin S, Rottman JB, Myers P, et al. The chemokine receptors CXCR3 and CCR5 mark subsets of T cells associated with certain inflammatory reactions. J Clin Invest. 1998;101:746–54. doi: 10.1172/JCI1422. [DOI] [PMC free article] [PubMed] [Google Scholar]
- 7.Groom JR, Luster AD. CXCR3 in T cell function. Exp Cell Res. 2011;317:620–31. doi: 10.1016/j.yexcr.2010.12.017. [DOI] [PMC free article] [PubMed] [Google Scholar]
- 8.Groom JR, Luster AD. CXCR3 ligands: redundant, collaborative and antagonistic functions. Immunol Cell Biol. 2011;89:207–15. doi: 10.1038/icb.2010.158. [DOI] [PMC free article] [PubMed] [Google Scholar]
- 9.Sorce S, Myburgh R, Krause KH. The chemokine receptor CCR5 in the central nervous system. Prog Neurobiol. 2011;93:297–311. doi: 10.1016/j.pneurobio.2010.12.003. [DOI] [PubMed] [Google Scholar]
- 10.Huffnagle GB, McNeil LK, McDonald RA, et al. Cutting edge: role of C-C chemokine receptor 5 in organ-specific and innate immunity to Cryptococcus neoformans. J Immunol. 1999;163:4642–6. [PubMed] [Google Scholar]
- 11.Takeshita Y, Ransohoff RM. Inflammatory cell trafficking across the blood-brain barrier: chemokine regulation and in vitro models. Immunol Rev. 2012;248:228–39. doi: 10.1111/j.1600-065X.2012.01127.x. [DOI] [PMC free article] [PubMed] [Google Scholar]
- 12.Savarin-Vuaillat C, Ransohoff RM. Chemokines and chemokine receptors in neurological disease: raise, retain, or reduce? Neurotherapeutics. 2007;4:590–601. doi: 10.1016/j.nurt.2007.07.004. [DOI] [PMC free article] [PubMed] [Google Scholar]
- 13.Christo PP, Vilela MC, Bretas TL, et al. Cerebrospinal fluid levels of chemokines in HIV infected patients with and without opportunistic infection of the central nervous system. J Neurol Sci. 2009;287:79–83. doi: 10.1016/j.jns.2009.09.002. [DOI] [PubMed] [Google Scholar]
- 14.Chang CC, Dorasamy AA, Gosnell BI, et al. Clinical and mycological predictors of cryptococcosis-associated Immune reconstitution inflammatory syndrome. AIDS. 2013;27:2089–99. doi: 10.1097/QAD.0b013e3283614a8d. [DOI] [PubMed] [Google Scholar]
- 15.Haddow LJ, Colebunders R, Meintjes G, et al. Cryptococcal immune reconstitution inflammatory syndrome in HIV-1-infected individuals: proposed clinical case definitions. Lancet Infect Dis. 2010;10:791–802. doi: 10.1016/S1473-3099(10)70170-5. [DOI] [PMC free article] [PubMed] [Google Scholar]
- 16.Chang CC, Lim A, Omarjee S, et al. Cryptococcosis-IRIS is associated with lower Cryptococcus-specific IFN-γ responses before antiretroviral therapy but not higher T-cell responses during therapy. J Infect Dis. 2013;208:898–906. doi: 10.1093/infdis/jit271. [DOI] [PMC free article] [PubMed] [Google Scholar]
- 17.Christensen JE, Nansen A, Moos T, et al. Efficient T-cell surveillance of the CNS requires expression of the CXC chemokine receptor 3. J Neurosci. 2004;24:4849–58. doi: 10.1523/JNEUROSCI.0123-04.2004. [DOI] [PMC free article] [PubMed] [Google Scholar]
- 18.Muller M, Carter S, Hofer MJ, Campbell IL. Review: the chemokine receptor CXCR3 and its ligands CXCL9, CXCL10 and CXCL11 in neuroimmunity–a tale of conflict and conundrum. Neuropathol Appl Neurobiol. 2010;36:368–87. doi: 10.1111/j.1365-2990.2010.01089.x. [DOI] [PubMed] [Google Scholar]
- 19.Chen X, Mihalic J, Deignan J, et al. Discovery of potent and specific CXCR3 antagonists. Bioorg Med Chem Lett. 2012;22:357–62. doi: 10.1016/j.bmcl.2011.10.120. [DOI] [PubMed] [Google Scholar]
- 20.Jenh CH, Cox MA, Cui L, et al. A selective and potent CXCR3 antagonist SCH 546738 attenuates the development of autoimmune diseases and delays graft rejection. BMC Immunol. 2012;13:2. doi: 10.1186/10.1186/1471-2172-13-2. [DOI] [PMC free article] [PubMed] [Google Scholar]
- 21.Liu M, Guo S, Hibbert JM, et al. CXCL10/IP-10 in infectious diseases pathogenesis and potential therapeutic implications. Cytokine Growth Factor Rev. 2011;22:121–30. doi: 10.1016/j.cytogfr.2011.06.001. [DOI] [PMC free article] [PubMed] [Google Scholar]
- 22.Uicker WC, McCracken JP, Buchanan KL. Role of CD4+ T cells in a protective immune response against Cryptococcus neoformans in the central nervous system. Med Mycol. 2006;44:1–11. doi: 10.1080/13693780500088424. [DOI] [PubMed] [Google Scholar]
- 23.Elovaara I, Muller KM. Cytoimmunological abnormalities in cerebrospinal fluid in early stages of HIV-1 infection often precede changes in blood. J Neuroimmunol. 1993;44:199–204. doi: 10.1016/0165-5728(93)90043-x. [DOI] [PubMed] [Google Scholar]
- 24.Martin-Blondel G, Alvarez M, Delobel P, et al. Toxoplasmic encephalitis IRIS in HIV-infected patients: a case series and review of the literature. J Neurol Neurosurg Psychiatry. 2011;82:691–3. doi: 10.1136/jnnp.2009.199919. [DOI] [PubMed] [Google Scholar]
- 25.Gray F, Bazille C, Adle-Biassette H, Mikol J, Moulignier A, Scaravilli F. Central nervous system immune reconstitution disease in acquired immunodeficiency syndrome patients receiving highly active antiretroviral treatment. J Neurovirol. 2005;11(Suppl 3):16–22. doi: 10.1080/13550280500511741. [DOI] [PubMed] [Google Scholar]
- 26.Boulware DR, Bonham SC, Meya DB, et al. Paucity of initial cerebrospinal fluid inflammation in cryptococcal meningitis is associated with subsequent immune reconstitution inflammatory syndrome. J Infect Dis. 2010;202:962–70. doi: 10.1086/655785. [DOI] [PMC free article] [PubMed] [Google Scholar]
- 27.Siddiqui AA, Brouwer AE, Wuthiekanun V, et al. IFN-gamma at the site of infection determines rate of clearance of infection in cryptococcal meningitis. J Immunol. 2005;174:1746–50. doi: 10.4049/jimmunol.174.3.1746. [DOI] [PubMed] [Google Scholar]
- 28.Charlier C, Nielsen K, Daou S, Brigitte M, Chretien F, Dromer F. Evidence of a role for monocytes in dissemination and brain invasion by Cryptococcus neoformans. Infect Immun. 2009;77:120–7. doi: 10.1128/IAI.01065-08. [DOI] [PMC free article] [PubMed] [Google Scholar]
- 29.Barber DL, Andrade BB, Sereti I, Sher A. Immune reconstitution inflammatory syndrome: the trouble with immunity when you had none. Nat Rev Microbiol. 2012;10:150–6. doi: 10.1038/nrmicro2712. [DOI] [PMC free article] [PubMed] [Google Scholar]
- 30.Martin-Garcia J, Kolson DL, Gonzalez-Scarano F. Chemokine receptors in the brain: their role in HIV infection and pathogenesis. AIDS. 2002;16:1709–30. doi: 10.1097/00002030-200209060-00003. [DOI] [PubMed] [Google Scholar]
- 31.Ansari AW, Heiken H, Meyer-Olson D, Schmidt RE. CCL2: a potential prognostic marker and target of anti-inflammatory strategy in HIV/AIDS pathogenesis. Eur J Immunol. 2011;41:3412–8. doi: 10.1002/eji.201141676. [DOI] [PubMed] [Google Scholar]
- 32.Okamoto M, Fuchigami M, Suzuki T, Watanabe N. A novel C-C chemokine receptor 2 antagonist prevents progression of albuminuria and atherosclerosis in mouse models. Biol Pharm Bull. 2012;35:2069–74. doi: 10.1248/bpb.b12-00528. [DOI] [PubMed] [Google Scholar]
- 33.Subasinghe NL, Lanter J, Markotan T, et al. A novel series of N-(azetidin-3-yl)-2-(heteroarylamino)acetamide CCR2 antagonists. Bioorg Med Chem Lett. 2013;23:1063–9. doi: 10.1016/j.bmcl.2012.12.017. [DOI] [PubMed] [Google Scholar]
- 34.Gathe J, Cade J, DeJesus E, et al. Week 24 primary analysis of cenicriviroc vs efavirenz, in combination with FTC/TDF, in treatment-naive HIV-1 infected adults with CCR5-tropic virus (study 652–2–202; NCT01338883). Conference on Retroviruses and Opportunistic Infections; Atlanta, Georgia. 2013. March 3–6. [Google Scholar]
- 35.Sierra-Madero J, Tierney A, Rassool M, et al. Efficacy and safety of maraviroc to prevent immune reconstitution inflammatory syndrome in high-risk subjects initiating ART: 24-week results of a randomized, placebo-controlled trial. Conference on Retroviruses and Opportunistic Infections; Atlanta, Georgia. 2013. [Google Scholar]
- 36.Angel TE, Jacobs JM, Spudich SS, et al. The cerebrospinal fluid proteome in HIV infection: change associated with disease severity. Clin Proteomics. 2012;9:3. doi: 10.1186/1559-0275-9-3. [DOI] [PMC free article] [PubMed] [Google Scholar]
- 37.Burdo TH, Weiffenbach A, Woods SP, Letendre S, Ellis RJ, Williams KC. Elevated sCD163 is a marker of neurocognitive impairment in HIV infection. AIDS. 2013;27:1387–1395. doi: 10.1097/QAD.0b013e32836010bd. [DOI] [PMC free article] [PubMed] [Google Scholar]
- 38.Price RW, Epstein LG, Becker JT, et al. Biomarkers of HIV-1 CNS infection and injury. Neurology. 2007;69:1781–8. doi: 10.1212/01.wnl.0000278457.55877.eb. [DOI] [PubMed] [Google Scholar]
Associated Data
This section collects any data citations, data availability statements, or supplementary materials included in this article.