

Abstract
Despite its prominence for characterization of complex mixtures, LC–MS/MS frequently fails to identify many proteins. Network-based analysis methods, based on protein–protein interaction networks (PPINs), biological pathways, and protein complexes, are useful for recovering non-detected proteins, thereby enhancing analytical resolution. However, network-based analysis methods do come in varied flavors for which the respective efficacies are largely unknown. We compare the recovery performance and functional insights from three distinct instances of PPIN-based approaches, viz., Proteomics Expansion Pipeline (PEP), Functional Class Scoring (FCS), and Maxlink, in a test scenario of valproic acid (VPA)-treated mice. We find that the most comprehensive functional insights, as well as best non-detected protein recovery performance, are derived from FCS utilizing real biological complexes. This outstrips other network-based methods such as Maxlink or Proteomics Expansion Pipeline (PEP). From FCS, we identified known biological complexes involved in epigenetic modifications, neuronal system development, and cytoskeletal rearrangements. This is congruent with the observed phenotype where adult mice showed an increase in dendritic branching to allow the rewiring of visual cortical circuitry and an improvement in their visual acuity when tested behaviorally. In addition, PEP also identified a novel complex, comprising YWHAB, NR1, NR2B, ACTB, and TJP1, which is functionally related to the observed phenotype. Although our results suggest different network analysis methods can produce different results, on the whole, the findings are mutually supportive. More critically, the non-overlapping information each provides can provide greater holistic understanding of complex phenotypes.
Keywords: mouse, critical period, visual acuity, valproic acid (VPA), neuroepigenetics, HDAC, proteomics, protein networks, bioinformatics, systems biology, Proteomics Expansion Pipeline (PEP), Maxlink, Functional Class Scoring (FCS)
Introduction
Proteomics profiling is essential for direct analysis of the molecular players (proteins) partaking in biological processes but is limited by coverage, consistency, and generally small sample size issues.1 Although these can be remedied by extensive experimental procedures, e.g., subcellular fractionation2 or high resolution setups,3 such brute force methods are time-consuming, expensive, and non-scalable. Network-based methods capture relationships between functionally related proteins, therefore allowing recovery of proteins that are undetected but likely to be in the sample. In this way, they offer a fast and cost-effective solution to limited coverage and reproducibility. This has direct implications for important biological studies including cancer.4 However, they do come in different forms that may produce different outcomes. Therefore, a comparative functional and performance (recovery) analysis is necessary. We tested and evaluated, using proteomics data derived from valproic acid(VPA)-treated mice, three types of protein–protein interaction network (PPIN)-based methods: a cluster discovery-based approach, Proteomics Expansion Pipeline (PEP); a feature-based approach, Functional Class Scoring (FCS); and an association-based approach, Maxlink.
Using networks, more accurate identification of present proteins (recovery) can be attained by identifying cliques or clusters closely associated with identified proteins. For example, protein relations can be described by a graph where pairs of nodes symbolizing proteins are connected by an edge. The edge can represent protein co-expression assembled from previous knowledge and experiments, physical binding, or genetic interaction. Within this graph, cliques (sets of nodes where every pair of nodes are connected) and highly connected clusters (sets of nodes where a high percentage of node pairs are connected) are indicative of modularity (e.g., a protein complex). Once these cliques or clusters are identified, they can be used for postprocessing on the identified proteins; the identification in a sample of many proteins A1, ..., An from a network-identified clique5 provides reasonable evidence that a protein C, which is in the same clique as proteins A1, ..., An, should also be present in the sample. Examples of “cluster discovery” approaches include Clique Enrichment Analysis (CEA)6 and Proteomics Expansion Pipeline (PEP).1,7 CEA identifies proteins belonging to a fully connected subgraph or clique. PEP follows a similar approach but uses a more relaxed cluster identification algorithm, CFinder.5 “Cluster discovery” approaches define clusters by protein identifications, but this is potentially unstable as it is particularly subject to network completeness and nature of the cluster prediction algorithm.
In contrast, “feature-based approaches” define the clusters a priori and are immutable. To disambiguate, we term such clusters “features”. One example is FCS (Functional Class Scoring).8 Here, overlaps (hit rates) are obtained by comparing the identified protein list against features such as predicted and/or real biological complexes. A key advantage of FCS is that a p-value can be determined using class-label randomization methods. This empirically generated p-value is important: Venet et al.9 demonstrated that distribution of values in real data is acutely different from theoretical distributions and hence p-values derived from the latter have little relevance or bearing.
The third class of methods is “association-based”. From a set of high-confidence seeds, new candidates are identified and ranked on the basis of the number of network links to seeds. An example is Maxlink, developed by Ostlund et al.,10 for identifying novel cancer genes. This method is more relaxed than “cluster discovery” approaches and does not depend on the choice of clustering algorithm.
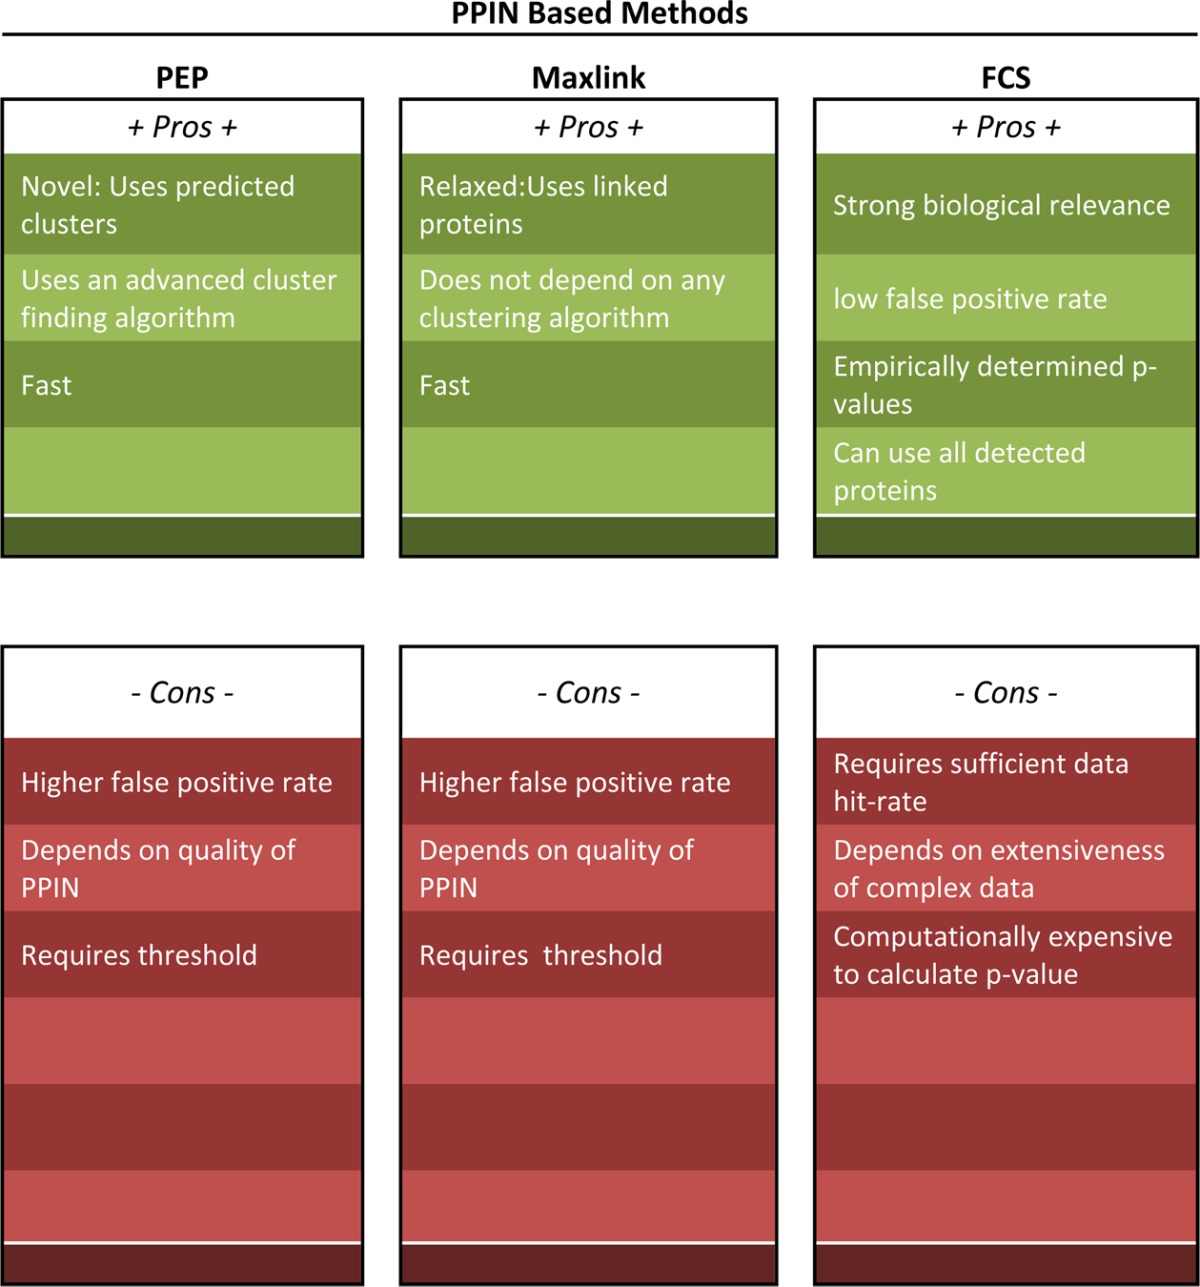
Cluster-based methods are the most commonly used type of tool in network analysis. Although more relaxed, association-based methods are seldom used. Feature-based methods are the newest class of methods developed for proteomic analysis. Although radically different from more conventional analyses, this class of methods is the only type able to resolve both the consistency and coverage issue with low false positive rates.11,12 An evaluation of the pros and cons of each method is given in Table 3 and elaborated under Results and Discussion.
Table 3. Pros and Cons of Each Network-Based Method.
To the best of our knowledge, there is no current gold standard data set for which all of the proteins within a data set are known. While this does somewhat limit the robustness of performing evaluation studies on network-based methods, it is possible to gain insight based on specific experimental data. Here, we study these methods by applying them to mass-spectrometry-based proteomics data derived from valproic acid (VPA)-treated mice using two protein search criteria. VPA is used medically as an anticonvulsant and a mood stabilize, but also has positive effects on learning and memory.13 It has a role in epigenetic remodeling through its histone deacetylase inhibitor activity and has a tangible impact on neuronal differentiation.14 VPA prompts the differentiation of hippocampal neural progenitor cells into neurons but also prevents differentiation into oligodendrocytes and astrocytes.15 In a screen of several psychoactive drugs in rats, it has been shown that only VPA exerted clear definable increase in acetylation.16 Studies in rats showed that HDAC inhibitor treatments, such as VPA and trichostatin A (TSA), increased visual evoked potentials and recovered their visual acuity after long-term monocular deprivation17,18 Recently, we found that VPA also exerts its effect via miRNA complex regulation, in particular the BAF/npBAF and histone deacetylases (HDAC) complexes.19 Figure 3 shows a proposed model for VPA activity.
Figure 3.
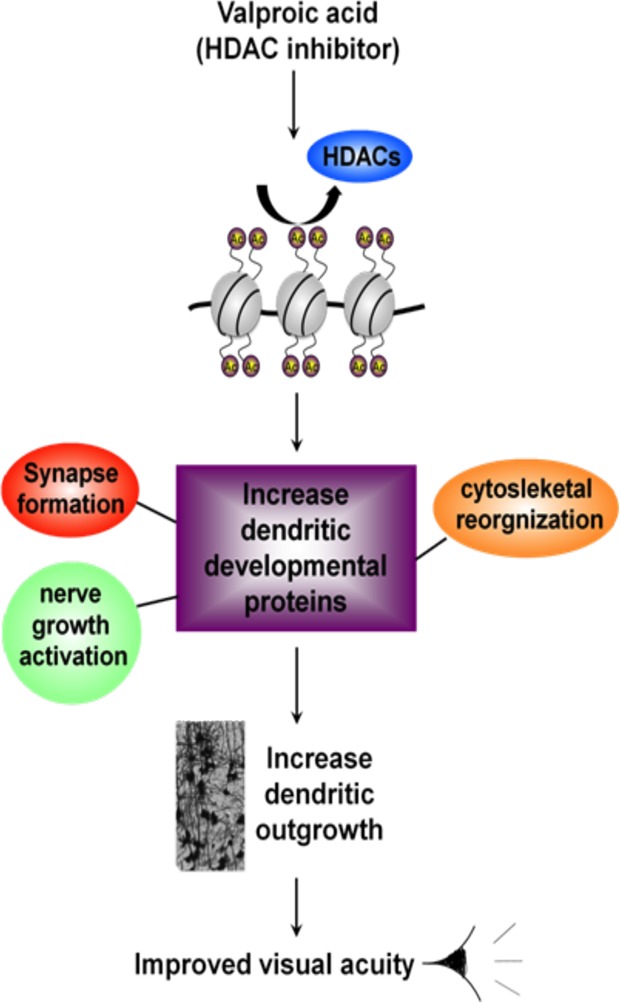
Proposed biological action of VPA treatment. VPA activates HDAC, which in turn epigenetically turns on the expression of genes involved in synapse formation, nerve growth activation, and cytoskeletal reorganization. The combined effects of these three activities result in the phenotypic observation of increased dendritic growth. This in turn contributes to synaptic plasticity and enhanced visual acuity. (Abbreviations: HDAC, histone deacetylase; VPA, valproic acid).
Treatment of wild-type adult mice with VPA over a 2-day period readjusts miRNA, gene, and protein levels in the brain. At structural and phenotypic levels, VPA-treated mice showed an increase in dendritic branching and spine morphology and also improved visual acuity. As the biological mechanisms are not well understood for this phenotypic response, the first part of this work uses the aforementioned network-based methods for functional analysis. The second part comparatively analyzes the relative performances (recovery) of the methods.
Materials and Methods
Animals
Adult C57BL/6 mice of either sex were used. Animals were maintained on a 12 h light/dark cycle and had access to food and water ad libitum. All animal protocols have been approved by the Institutional Animal Care and Use Committee (IACUC) in the Agency for Science, Technology and Research, A*STAR. Visual cortex tissue was excised under a dissecting microscope and used for protein, RNA extraction, and iTRAQ assays.
Drug Administration
Valproic acid (VPA; 200 mg kg–1, i.p; Sigma-Aldrich) was dissolved in sterile saline. The same volume of vehicle solution was injected into control animals. VPA or vehicle solution (Veh) was injected every 12 h into wild type postnatal day-56 adult mice. The mice were sacrificed after 2 days of drug administration for gene expression array and proteomics iTRAQ profiling.
RNA Extraction
Total RNA was isolated from the visual cortex using RNase Easy kit (Qiagen). For every qPCR experiment, independent pairs of visual cortex from 3 or 4 mice were used as biological replicates: Veh- and VPA-treated. For every microarray experiment, independent pairs of visual cortex from 4 mice were used as biological replicates: Veh- and VPA-treated.
Gene Expression Array Profiling
The quality of the total RNA was verified by an Agilent 2100 Bioanalyzer profile. From each sample, 10 μg of total RNA was labeled, hybridized to Affymetrix Murine Genome 430 GeneChips according to the Affymetrix protocols, and scanned at the Biopolis Shared Facilities, A*STAR. All analyses were performed using standard statistics-based Affymetrix GeneChip Software; statistical algorithms were implemented using Affymetrix Microarray Suite version 5.0.
Proteomics Biological Sample Preparation
Frozen visual cortical samples were lysed at 4 °C with ice-cold lysis buffer [2% SDS; 0.5 M triethylammonium bicarbonate (TEAB) with Complete Protease Inhibitor Cocktail (COMPLETE, Roche, Mannheim, Germany) and phosphatase inhibitor cocktail (PhosSTOP, Roche)] by intermittent vortexing and sonication (amplitude, 23%; pulse, 5 s/5 s for 5 min) using a Vibra Cell high intensity ultrasonic processor (Jencon, Leighton Buzzard, U.K.). The lysates were centrifuged at 20 000g for 30 min at 4 °C. The supernatant was collected and stored in aliquots at −80 °C (longer term) or at −20 °C (shorter duration). Protein quantification was done using Bicinchoninic Acid Protein Assay kit.
In-Gel Tryptic Digestion and Isobaric Labeling
The samples were subjected to denaturing polyacrylamide gel electrophoresis (PAGE) for the purpose of removing the non-protein interfering substances. Briefly, 500 μg of protein from each condition was run on an 8% stacking–25% separating gel. Proteins that migrated into the 8% layer were retarded by the 25% layer, thus concentrating them in a narrow strip at the end of the stacking gel. The diced gel bands were then reduced (5 mM tris(2-carboxyethyl) phosphine, 60 °C, 1 h) and alkylated (10 mM methyl methanethiosulfonate in isopropanol, room temperature, 15 min) before being digested with 10 ng/μL of sequencing-grade modified trypsin (Promega, Madison, WI) for overnight at 37 °C. The peptides were extracted with 50% ACN and vacuum centrifuged to dryness. The dried peptides were reconstituted into 0.5 M TEAB and ethanol and labeled with respective isobaric tags of 4-plex iTRAQ Reagent Multi-Plex kit (Applied Biosystems, Foster City, CA) as follows: sham, 114; 2 + 0, 115; 2 + 4, 116; 2 + 24, 117. The labeled samples were combined after 2 h and dried in a vacuum centrifuge.
Strong Cation Exchange (SCX) Chromatography
The dried iTRAQ-labeled peptide was reconstituted in Buffer A (10 mM KH2PO4; 25% ACN; pH 2.85) and fractionated using a PolySULFOETHYL A SCX column (200 × 4.6 mm; 5 μm; 200 Å) (PolyLC, Columbia) as mentioned previously on a Prominence HPLC system (Shimadzu, Japan) in a 50 min gradient with Buffer B (10 mM KH2PO4, 25% ACN, 500 mM KCl (pH 3.0)). Eluted fractions were collected every 1 min and then pooled into 25 fractions, depending on the peak intensities, before being dried in a vacuum centrifuge. The dried fractions were desalted through C18 Sep-Pak Vac reverse phase cartridges (Waters, Milford, MA) and stored at −20 °C till MS analysis.
LC–MS/MS Analysis Using QSTAR
The iTRAQ-labeled desalted peptides were reconstituted with 0.1% formic acid (FA) for MS analysis. Each sample was analyzed three times using a QSTAR Elite Hybrid MS (Applied Biosystems/MDS-SCIEX), coupled to an online HPLC system (Shimadzu, Japan). For each analysis, 30 μL of peptide solution was injected and separated on a home-packed nanobored C18 column with a picofrit nanospray tip (75 μm i.d. × 15 cm, 5 μm particles) (New Objectives, Wubrun, MA). Mobile phases A (0.1% FA in 2% ACN) and B (0.1% FA in 100% ACN) were used to establish a 90 min HPLC gradient with an effective flow rate of 0.2 μL/min, obtained from a constant flow of 30 μL/min using a splitter. The mass spectrometer was set to perform data acquisition in the positive ion mode. Precursors with a mass range of 300–2000 m/z and calculated charge of +2 to +4 were selected for fragmentation. The three most abundant peptide ions above a 5 count threshold were selected for each MS/MS spectrum. The selected precursor ion was dynamically excluded for 30 s with a 30 mDa mass tolerance. Smart information-dependent acquisition was activated with automatic collision energy and automatic MS/MS accumulation. The fragment intensity multiplier was set to 20 and maximum accumulation time was 2 s. The peak areas of the iTRAQ reporter ions reflect the relative abundance of the proteins in the samples.
Mass Spectrometric Raw Data Analysis
The spectral data acquisition was performed using the Analyst QS 2.0 software (Applied Biosystems/MDS SCIEX). ProteinPilot Software 2.01 (Applied Biosystems, Foster City, CA) was used for peak list generation, protein identification and quantification against the International Protein Index (IPI) rat database (version 3.40; 79,354 sequences; 41,861,410 residues).20 Although deprecated, the IPI database still provides a relatively high-quality search that can be compared against a more current and larger database. A concatenated target-decoy database search strategy was also employed to estimate the false discovery rate (FDR).21 FDR was calculated as the percentage of decoy matches divided by the total matches (i.e., #decoy/(#decoy + #target)). The user-defined parameters of the software were configured as follows: (i) Sample Type, iTRAQ 4-plex (Peptide Labeled); (ii) Cysteine alkylation, MMTS; (iii) Digestion, Trypsin; (iv) Instrument, QSTAR Elite ESI; (v) Special factors, None; (vi) Species, None; (vii) Specify Processing, Quantitate; (viii) ID Focus, biological modifications, amino acid substitutions; (ix) Database, concatenated ‘target’ and ‘decoy’ (the corresponding reverse sequences); (x) Search effort, thorough.22 For iTRAQ quantitation, the peptide for quantification was automatically selected by Pro Group algorithm to calculate the reporter peak area, error factor (EF) and p-value. The resulting data set was auto bias-corrected to get rid of any variations imparted due to the unequal mixing during combining different labeled samples.
The Paragon algorithm was used for the peptide identification, which was further processed by the Pro Group algorithm where isoform-specific quantification was adopted to trace the differences between expressions of various isoforms. The Proteinpilot software employed iTRAQ reporter ion peak area for quantification. Details of the quantification algorithm can be found in the supplier’s manual. The resulting data set was auto bias-corrected to get rid of any variations imparted due to the unequal mixing during the combining of different labeled samples. Subsequently background correction was also performed to eliminate any background ion signal due to non-target peptides, coeluting with the target peptide. A total of 396 proteins were identified, but of these, only 291 have determined quantification ratios.
A second round of peptide/protein identification was performed by scanning the MS against the UniProtkb database (con_Xuni_mouse_12032010; sequences 125176; 67,329,692 residues) using ProteinPilot (Paragon) (v2.01). Similar search parameters were usd as before with false discovery rates deployed using target-decoy database search and set to <1% FDR. 789 proteins were identified. This is a superset of the originally identified proteins identified by matching against IPI. The 498 (= 789 – 291) additional proteins are used for recovery analysis of the individual network-based methods. They are referred to as the set D in Recovery Performance of Network-Based Methods.
Mouse PPIN Construction
We built an expanded mouse PPIN by merging data from two data sources, MppDB23 and IntNetDB.24 MppDB is a mouse protein–protein interaction (PPI) database, and we used the reference set of mouse PPI data collected over five PPI databases: DIP, BIND, MIPS, MINT, and IntAct. This network is rather sparse, with limited information. The Human PPI (IntNetDB) network however is much more extensive and well-studied. We thus used IntNetDB to map interologs from human PPIN to mouse and merged this with the MppDB data set. IntNetDB comprises both human PPI data and predicted PPI based on several model organisms including mouse. Functional homogeneity/coherence is evaluated by the smallest shared biological process (SSBP) score, which is calculated in three steps: (1) find all the GO terms shared by each pair of genes, (2) find the number of other genes also sharing these GO terms, and (3) get the GO term with the smallest gene count.24 While the SSBP to some extent addresses issue of reliability by using information from GO, it is not clear that the SSBP of interologs (in mouse) would necessarily have high SSBP. This is a caveat that needs be noted as a limitation of our analysis.
The resultant combined network (IntNetDB + MppDB) consists of 10,307 nodes and 124,866 edges.
Cluster Prediction Algorithm
SPICi is an extremely fast and powerful clustering algorithm able to deal with large networks with good performance speeds.25 It also performs well in its ability to recover known biological complexes and functional modules. By applying SPICi on our constructed mouse PPIN, 701 complexes were obtained with an average cluster size of 6.55.
Functional Class Scoring (FCS)
Complexes are derived from CORUM database26 or are predicted on the basis of our combined mouse PPIN. For functional analysis, human complexes were used instead of mouse as the latter is quite limited. Moreover, we performed similar complex analysis using human complexes in earlier work using different data platforms, e.g., Affymetrix 140 2 mouse mRNA microarray chips, and we wish to further understand what the proteomics data reveal.19 Since protein complex information is simply used to identify biologically coherent or related proteins, the species-specific constitution is not of direct or utmost importance.
Critical complexes are identified in this way: For each complex, a hit rate is calculated as the ratio of present proteins in a complex Np against N, the total number of proteins in a complex (Np/N). A random complex of size N is generated from the reference list, and an artificial hit rate is calculated. This is performed 1000 times to create an empirical null distribution. The p-value is the number of times the hit rate is larger than the artificial hit rate divided by 1000.
Proteomics Expansion Pipeline (PEP) and Critical Predicted Complex Identification
Predicted clusters were generated using the PEP method described in Goh et al.7 Differentially expressed proteins (expression ratio ≥1.2 or ≤0.8) were used as seeds and mapped onto the integrated mouse PPIN (nodes, edges). They were then expanded to include their first-degree neighbors. Identification of overlapping clusters was performed using CFinder.5 The clusters were then scored and ranked by the following method:
where S is the calculated score, and E is the expression value for a detected protein (if protein is underexpressed, then the reciprocal score is used). For more information on the PEP method, refer to the pipeline diagram (Figure 1).
Figure 1.

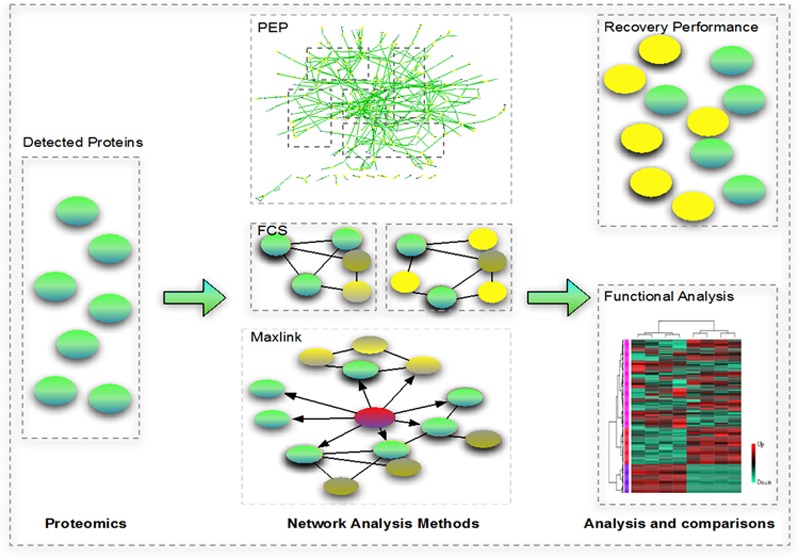
Schematic of the 3 network-based methods. (A) FCS. The hit-rate of each complex (real/predicted) is measured against the MS protein list. Randomization via class-label swopping is used to generate p-value. (B) PEP. MS protein list is first filtered for seed proteins. The expansion step is done in relation to the PPIN. Clique analysis is then performed to obtain tightly connected clusters. The clusters are then scored and ranked. (C) Maxlink. MS protein list is first filtered for seed proteins. Connections of every node in the network to these seeds are counted and ranked. (Abbreviations: FCS, Functional Class Scoring; MS, mass spectrometry; PEP, Proteomics Expansion Pipeline; PPIN, protein–protein interaction network). For detailed explanations, refer to Materials and Methods.
Maxlink
We let the network G be composed of nodes V and edges E. From the set of seeds X ∈ V (expression ratio ≥1.2 or ≤0.8), the set of non-seeds Y is derived (Y = V – X). The set of linked proteins L are those proteins in Y that have at least 2 connections to proteins in X. That is, L = {y ∈ Y |2 ≤ |{x ∈ X | (x,y) ∈ E}|}.
Precision-Recall Analysis
To evaluate whether higher ranked complexes are more reliable in recovering proteins and whether they recover more proteins, significant complexes from FCS are ranked by p-value in ascending order. Proteins are ranked on the basis of the best complex they are in and inherit the corresponding p-value. For each level n (p-value < n), the precision and recall are calculated based on the recovery for that level.
We let U be the set of proteins at some leveln where p-value < n, and V is the set of detected proteins. Precision is calculated as U ∩ V/U, and recall is calculated as U ∩ V/V.
Results and Discussion
The overall analyses are as follows: (1) We performed a first pass proteomic analysis to gauge the quality of information as well as their relevance to the observed phenotype. (2) We subsequently built on this by examining the results from PEP, Maxlink, and FCS in a concurrent manner. This involves first using FCS to build an initial model, followed by augmentation with PEP complexes, and last checking for testable candidates using Maxlink. Details are given below. (3) To understand how congruent or varied the network based methods are, we first checked the extent of functional term variation between the 3 methods, the extent of protein overlap, and recovery performance. (4) Since FCS performed the best (precision and recall), we subsequently built a precision-recall graph to check whether the distribution of real proteins is concentrated in the region where the p-value is highly significant. (5) Finally, we end off with a critical evaluation on the pros and cons of each method.
Proteomics Data First-Pass Analysis
Of 396 protein identifications, only 291 reported quantification ratios. Regression analysis of the latter revealed excellent correlations (adjusted R-value = 0.822; p-value ≤ 2.2 × 10⁻¹⁶) between both samples (116/114 and 117/114, where 116 and 117 are the MS channels corresponding to samples while 114 is the control); see Supplementary Figure 1. 116/114 and 117/114 are biological replicates, and hence some variability is expected. The average expression value is used for downstream analysis.
A total of 155 of 291 proteins met the standard cutoff criteria for differential expression (≥1.2 or ≤0.8). GO terms analysis reveals enrichment for neurological development and projection/dendritic growth. For a full list of the differential proteins and their functional annotations, refer to Supplementary Table 1. However, GO term enrichment using gene lists is not very informative. It is not known how these proteins interact with each other in order to achieve the observed phenotype. The enriched GO terms may not be stable if additional proteins were uncovered. Networks offer the possibility of contextualizing the protein lists both for functional analysis and recovery.
Integrative Functional Analysis Based on FCS, PEP, and Maxlink: A Plausible Approach
Although network-based methods are powerful, it is time-consuming to exhaustively analyze and validate the network-identified proteins of any single method. Moreover, integration of outputs can be difficult. Instead, we propose a simple yet logical approach involving these three methods by drawing on their individual strengths to bolster functional analysis; see Figure 2.
Figure 2.

Combined analysis: a plausible approach. On the basis of our proposed biological model, we can group significant FCS complexes (as they have well-defined functions and are real) accordingly. This provides a functional model in which we suggest how complexes act in concert to effect the phenotype as opposed to just single genes. We can further augment the model with information from cluster-discovery methods such as PEP. Shown are two predicted PEP clusters with highly relevant functional terms but no correspondence with the FCS analysis. This allows enrichment and expansion of the analysis. Maxlink allows identification of novel proteins that do not necessarily exist within the context of a cluster. Of the top Maxlink proteins, YWHAZ, also known as 14-3-3, is involved in a wide variety of functions as a transcription factor and promiscuous binder. This is in agreement with our observations that VPA treatment results in a reshifting of the gene expression mechinary (Abbreviations: FCS, Functional Class Scoring; MS, mass spectrometry; PEP, Proteomics Expansion Pipeline; PPIN, protein–protein interaction network).
Building an Initial Model with FCS (CORUM)
FCS (using biological complexes from CORUM26) utilizes informative biological features with defined functions and stable components. By building on and expanding the proposed model for VPA activity (Figure 3), significant complexes can be implicated (Figure 2).
Human complexes were used because they are more extensive.19 Moreover we have prior insight as similar genomics analysis of the same biological samples using Affymetrix 430 2.0 chips (mouse) was performed.19 Also, the reference mouse network (on which the Maxlink and PEP are performed) comprises many human network elements via homology transfer.
Expectedly, a large number of epigenetically related complexes were significant (HDAC-related, SWI/SNF and LARC) (p ≤ 0.05). Epigenetic modifications can lead to the activation of other genes, but this requires activation of gene expression machinery including the spliceosome, CDC5L, and nop56p complexes, which are observed to be overexpressed. This further leads to the significant activation of complexes involved with synaptic formation (Polycystin-1), cytoskeletal reorganization (Profilin 1, Emerin, Arp2/3 and beta-AR receptosome), as well as neuronal development (BAF27 and MeCP228).
For further details on FCS significant complexes, refer to Supplementary Table 3.
Augmenting with PEP Complexes
The primary limitation of using existing biological complexes is non-exhaustive representation. For instance, if complexes involved in neuronal differentiation are nonrepresented,26 then these functionalities will not be reflected. Hence, FCS-based model can be further enhanced/augmented with predicted complexes from PEP and FCS (using predicted complexes).
Figure 2 shows two instances of top predicted complexes in PEP with related functionalities not found among real protein complexes. In particular, the PEP clusters (YWHAB, NR1, NR2b, ACTB, and TJP1) as well as (YWHAB, RAF1, NR1, NR2b, PRKCE, SRC and YWHAG) further add value to the analysis. This group of proteins is involved in a variety of functions related to neuronal plasicity and development. These include detection of stimulus involved in sensory perception, negative regulation of neuron apoptosis, synaptic transmission, axonogenesis, regulation of synaptic plasticity, neuromuscular process, and adult locomotory behavior. More relevantly, it implicates additional terms such as learning, memory, regulation of dendrite development, and associative learning. In particular, NR1 and NR2B are important in visual/ocular dominance plasticity;29,30 see Supplementary Table 2 for details and associated p-values.
Also consistent with the FCS (CORUM)26 results is the fact that several of the PEP predicted clusters are involved in transcriptional/translational processes as well as in epigenetic remodeling processes; see Supplementary Table 2. An example of the former is (LMNB1, CDK1, and PLEC), which is involved in multiple functions including cell cycle, cell aging processes, and DNA conformational change. On the latter, a cluster comprising HDAC231 with HSPA8, MORF4l1, COQ6, SIN3A, and PHF20 is involved in negative regulation of cell projection organization and chromatin remodeling.
These are particularly interesting as epigenetic regulation (via chromatin remodeling) may play an important role in effecting synaptic plasticity. Moreover, this predicted complex is novel and has no counterpart in CORUM. Aside from SIN3A, which is known to be associated with HDAC1/2 in some complexes such as the MeCP2-SIN3A-HDAC complex, the remaining components are unique, and intricately associated via protein–protein interactions.
Augmenting with FCS (Predicted Complexes)
As the constructed network is large (10307 proteins, 124866 interactions), choice of clustering algorithm is important. SPICi was selected due to its ability to quickly predict complexes from large networks.25 It was also shown to be good at recovering biologically relevant complexes and submodules.25 A total of 701 complexes (size 3 and above) were predicted with an average size of 6.55; 74 of these complexes were found to be significant at p-value ≤0.05.
On neuronal development, the complex comprising CDC42, ARHGEF2, MYBBP1A, PRKCI, PPP2CB, CYFIP1, SMARCA4, USP9X, YWHAG, YWHAH, YWHAZ, PNMA2, USP7, PPP2R1A, YWHAB, KCTD20, DOCK7, 1110012J17RIK, PNMA1, and CYFIP2 is heavily involved in neuronal development processes (Neurogenesis, nervous system development and neuron differentiation). Interestingly, this group of proteins is also intricately involved with apoptosis, but it should not be that surprising, considering that apoptosis is also required for system development and formation.
On cytoskeletal reorganization, the top cluster consisting of ACTN1, ADD1, CAP1, CAPZA1, CAPZB, PPP1R12A, WDR1, CORO1C, ARPC3, ARPC4, 2900064A13RIK, ACTR3, ARPC2, and CORO7 is relevant since it is involved in cytoskeletal reorganization and neuronal growth cones necessary for visual cortical area maturation, which is reportedly important.32 In our observation, valproic acid also induces dendritic spine growth,33 and the regulation of dendritic spines are determined by actin-signaling pathways34 and may contribute to long-term synaptic plasticity.35 In fact, structural rearrangements have been shown to be effective in promoting plasticity in adult age.36
The third top cluster comprising GRM3, CACNA1A, DNM1, GABRB3, GAD1, GDI1, GNB2l1, GRIA2, GRIK2, NR1, NR2b, RPH3A, SLC1A3, SPNA2, STX1A, STXBP1, SYN2, SYNGR1, SYT1, TEX2, PI4KA, SLC6A1, ABAT, GABBR1, and NOVA1 is involved in synaptic transmission processes. We note that some of the components here are also found in the PEP clusters, e.g., NR1 and NR2b (Figure 2). This cluster is particularly interesting as γ-aminobutyric acid (GABA)ergic, N-methyl-d-aspartate (NMDA), and cholinergic receptors are thought to be involved in visual cortex plasticity in animal studies.37 It is widely believed that NMDA receptor-dependent forms of synaptic modification, such as long-term potentiation (LTP) and long-term depression (LTD), are essential for developmental plasticity in the visual cortex. These changes can be theoretically accounted for by mechanisms of LTD and LTP assuming that the properties of synaptic plasticity are “metaplastic” to keep synaptic strengths within a useful dynamic range.38 This metaplasticity results from activity-dependent regulation of NMDAR subunit composition. Since both the channel properties and the intracellular binding partners of NMDARs rely on the NR2 subunit present in the heteromer, experience-dependent changes in NR2A/2B ratios39 can alter the receptor function and the LTP threshold.40
Another interesting component of this cluster is that GABAergic circuitry proteins (GAD1, GABRB3, GABBR1) are also implicated. We do know that the use of related benzodiazepines, such as diazepam, can initiate closure of visual cortical plasticity prematurely by enhancing GABA-mediated transmission acting through GABAA receptors to elict its effects.41 However, administering diazepam during adulthood does not elicit the reactivation of plasticity seen42 when administering VPA and recovery of amblyopia is observed.17 Thus, it is plausible that VPA mediates its effects mainly through the HDAC inhibition and, to an extent, different GABA receptor subtype and decreasing GABA inhibition.
The TNR, SDCBP2, NFASC cluster is focused on synapse organization.
For further details on significant FCS-predicted complexes and the p-values, refer to Supplementary Table 4.
Seeking Individually Testable Targets with Maxlink
Given limited time and resources, Maxlink can be a useful means of experimental prioritization. There are two ways this can be achieved: First, a highly linked protein could be a coordinator of various complexes that are up-regulated. Because these complexes are related by being located in a highly concentrated area of seeds, these particular complexes may be worth testing first. The highly linked protein YWHAZ fits this description as it is a promiscuous binder and also capable of acting as a transcription factor, able to control several different functionalities/complexes. YWHAZ (Maxlink rank 1) is a member of the 14-3-3 family of proteins that mediate signal transduction by binding to phosphoserine-containing proteins. The 14-3-3 proteins have been reported to be positively correlated to critical period plasticity.30 A coordinative protein may not necessarily be located within a densely connected region itself and hence may be missed by the “cluster discovery” methods.
A second way Maxlinked proteins can be used for experimental prioritization is to check whether it is found in a variety of significant and functionally relevant FCS (real/predicted) or PEP complexes. For example, SRC (Maxlink rank 2) is uncovered in a novel PEP complex that also plays an important role in memory and forebrain development (Figure 2). Furthermore, its high connectivity to seeds denotes importance.
See Supplementary Table 5 for the list of linked proteins.
Understanding GO Term Variations between the Three Methods
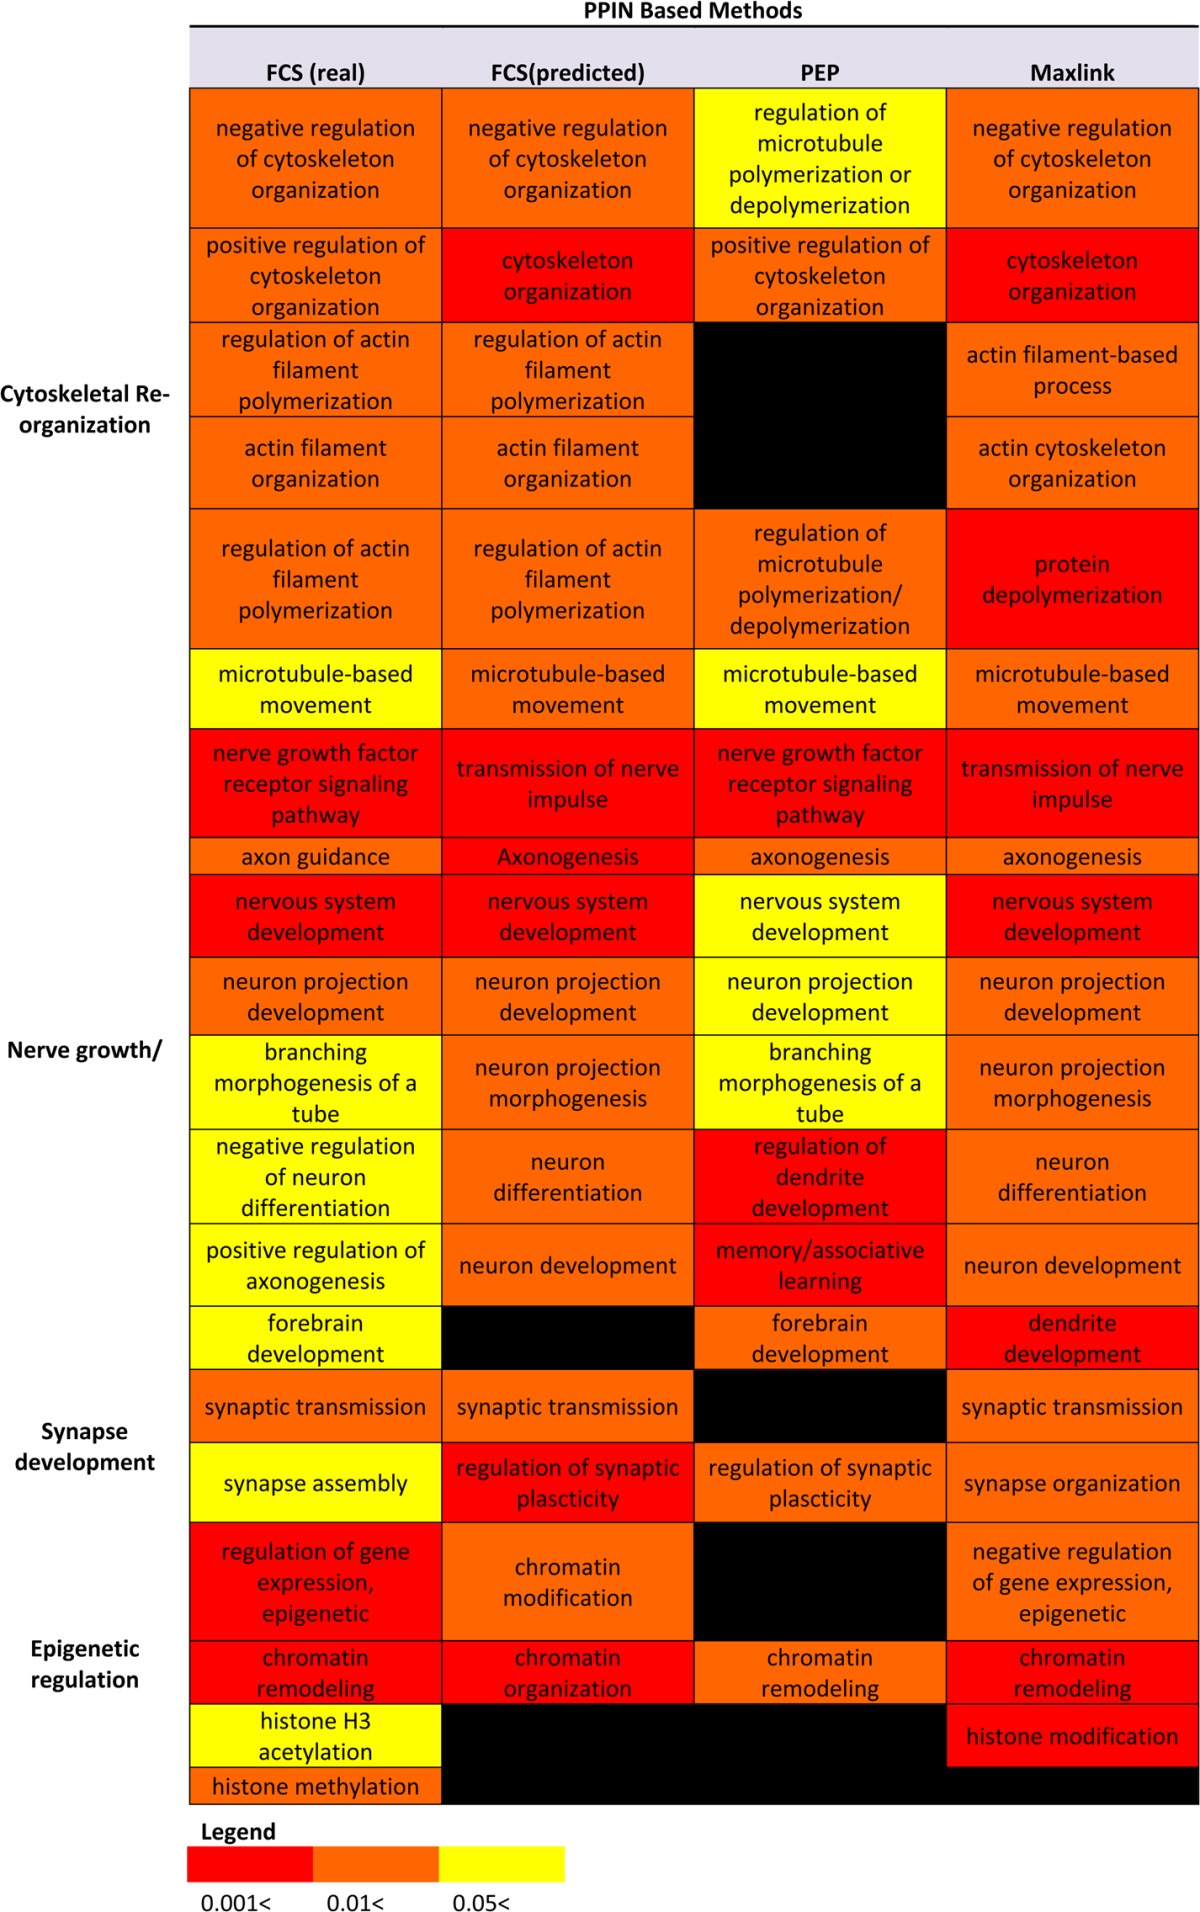
To compare the results from a functional and more general perspective, Table 1 summarizes the significant GO terms for each of the observed phenotypic traits. Despite overall agreements, there are slight differences in represented functionalities and associated significance values. It is unsurprising that these variations exist due to differences in recovery overlaps, but they could potentially lead to partial or incomplete analysis.
Table 1. Comparative GO Term Analysis of the Three Methods.
Overlaps Analysis
The Venn diagrams in Figure 4 illustrate the degree of overlaps between the 3 network-based methods (reported and recovered). Two sets of analyses here utilizing different versions of FCS (predicted complexes, green; real complexes, purple) were performed. Using real complexes did recover more proteins. On the other hand, utilizing predicted complexes for FCS only slightly decreased the number of proteins reported. However, on the whole, the results did not differ significantly.
Figure 4.

Overlaps between the three network-based methods. Analysis was repeated twice with FCS utilizing predicted complexes (green) and real complexes (purple). Interestingly, the results in both cases are rather consistent. Also, in both cases, the overlaps between Maxlink and PEP were deeper than with FCS. The latter also reports the highest number of additional proteins not picked up by the other two methods (Abbreviations: FCS, Functional Class Scoring; MS, mass spectrometry; PEP, Proteomics Expansion Pipeline; PPIN, protein–protein interaction network).
For significant predicted complexes with FCS, 115 proteins are common to all 3 methods; Figure 4 (left). PEP and Maxlink has a very deep overlap of 765 (650 + 115) proteins. In fact, this accounts for most of Maxlink’s reported proteins. Only 44 proteins are truly uniquely detected by Maxlink and not discovered by the other 2 methods.
For significant real complexes with FCS, 180 proteins are common to all 3 methods; Figure 4 (right). PEP and Maxlink has a very deep overlap of 765 (585 + 180) proteins. Only 47 proteins are truly uniquely detected by Maxlink and not found by the other 2 methods.
The consistent deep overlap between Maxlink and PEP is not unexpected. PEP and Maxlink relies on PPINs and associations with seeds (requirement for threshold definition). This is unlike FCS, which uses predicted/real complexes and no threshold. PEP essentially detects densely connected clusters of proteins whereas Maxlink is a direct link counting method. This accounts for why PEP recovers more proteins generally.
FCS has 653 (real) and 474 (predicted) proteins uniquely detected by it. Although 242 (180 + 10 + 52) proteins are shared with the other two methods, in both cases FCS reports a very large number of additional proteins. This could be because there is a very large number of biological complexes that cannot be picked up/detected from the network. A second reason is that these biological complexes are larger, thereby implicating a larger number of additional proteins.
Recovery Performance of Network-Based Methods
To understand which of the 3 network-based methods performs best in recovering additional proteins, we performed a comparative examination. Let A be the set of identified proteins. For each network-based method, let B be the total set of proteins reported. For PEP, it would be the proteins from all the predicted clusters. For Maxlink, it would be all the proteins interacting with the detected proteins. For FCS, it would be all the proteins comprising significantly identified features (real or predicted complexes). For each method, the set of additional predicted proteins, C, is therefore (B – A). We let D be the set of additional proteins identified at less stringent identification thresholds (789 – 291 = 498). The recovery performance (precision) of each method can be expressed as a proportion, |(C ∩ D)|/|C|. That is, the proportion of predicted proteins that can be verified at a less stringent identification threshold. The sensitivity/recall, i.e., the proportion of additional proteins identified at the less stringent identification that are successfully predicted, can be expressed as |C ∩ D|/|D|.
Table 2 shows the recovery performance of each method. In terms of precision and recall (sensitivity), the contrast between using predicted complexes/network information and real biological complexes is stark: FCS using real complexes greatly outperforms the other 3 network-based methods. Among the prediction-based methods, FCS (Predicted) performs best in recall followed by Maxlink and PEP. FCS (Predicted) and Maxlink have similar precisions, whereas PEP’s is lower. Comparing seed-based methods PEP and Maxlink, the lower precision of PEP suggests that many of the seeds could be network hubs. Therefore, more proteins were reported that may not be reported in D (see above).
Table 2. Protein Recovery Performance of the Various Network-Based Methods.
| method | novel suggested proteins | recovered proteins | recall | precision |
|---|---|---|---|---|
| PEP | 1037 | 158 | 0.317 | 0.152 |
| Maxlink | 822 | 226 | 0.454 | 0.275 |
| FCS (predicted) | 638 | 224 | 0.450 | 0.351 |
| FCS (complexes) | 895 | 477 | 0.958 | 0.533 |
The relatively poor performance using pure networks may be due to undeterminable false positive/negative rates. This may be further compounded via the inclusion of network elements based on homologous mapping.
The results here suggest that despite the contemporary popularity of network-based analysis, conclusions drawn from network-identified elements need to be considered carefully and with sufficient alternative backing evidence. Real biological complexes appear to capture far more relevant information that is not reflected in or extractable from contemporary biological networks.
Precision-Recall Analysis of FCS (Complexes)
Given that real complexes are able to recover most of the detected proteins with a high level of precision, and since a p-value is calculable, we are interested in finding out whether the majority of detected proteins are concentrated in the upper echelons of significant complexes.
The precision-recall/sensitivity graph (Figure 5 left) shows that when p-value is very significant (close to 0), sensitivity is relatively low but quickly maximized while precision remains optimal. When p-value is ≤0.05 (pink zone, Figure 5 left), precision and sensitivity are both maximized (as reported in Table 2). This means that the significant complexes are able to recover the majority of detected proteins while minimizing false positives. The histograms (Figure 5 right) shows the distribution of p-values for detected proteins and non-detected proteins. Most detected proteins have a highly significant p-value, whereas undetected proteins have reported p-values that are usually greater than 0.05.
Figure 5.

Significant FCS complexes captures most detected proteins. (Left) Precision-recall graph showing that precision and recall is maximized early on when p ≤ 0.05 (pink zone). (Right) Histograms showing p-value score distributions for detected and non-detected proteins. Detected proteins mostly belong to FCS-significant complexes where p ≤ 0.05, whereas undetected proteins are mostly in the nonsignificant zone where p > 0.05. This accounts for the extreme left shift in the precision-recall graph.
Since FCS was performed with the initial detected set of 291 proteins, its strong ability to correctly identify additional proteins (from the expanded set of 789) at the significant level demonstrates the efficacy of this approach as a recovery method. The strong recovery of proteins using real complexes also augurs well for feature-based methods such as Proteomics Signature Profiling (PSP).12
Strengths and Weaknesses of Each Method
Table 3 summarizes the pros and cons of each of the methods. The chief strengths of feature-based network analysis methods such as FCS are that they are less dependent on the reference biological network (can utilize real biological data classes, e.g., complexes), independent of the use of arbitrary thresholds on the data, and that the discovered features are essentially immutable (do not depend on the supplied proteomics data). As this form of analysis is more stable, it allows for more robust comparisons against other data sets, e.g., comparing significant features instead of individual genes can greatly simplify analysis. There are two major down sides, however, the minor being that it is computationally more expensive to generate a new empirical distribution for every feature being tested. Still, given that we should not expect the data to fit a theoretical distribution anyway, it is worthwhile. The more major down side, however, is that complex databases such as CORUM may not be very comprehensive (non-exhaustive representation). Hence, if the real complex causing a phenotype is not represented in the database, it will be missed completely.
The key advantage of Maxlink is that it is a more relaxed method and can recover proteins that are not necessarily found within a densely connected cluster or clique. Maxlink can be truly powerful if many of the known proteins associated with the phenotype, and the underlying functional profile are known. In this way, not only would links to known associated proteins be important, but penalities for nonassociated protein links can also be imposed in the discovery of novel associated proteins.
The strength of PEP is that it uses the idea that many of the relevant activities in the network should be proximal to the location of differential proteins/seeds. Hence, by first identifying these anchor points, it should be possible to confidently recover and identify a good number of lower confidence proteins.
A common disadvantage of Maxlink and PEP are they require the imposition of a threshold on the proteomics data, which is subjective. They are also highly susceptible to the quality of the reference PPIN, which may be beset with false positives.
Conclusions
Network-based profiling is useful in enhancing the analytical outcome of proteomics experiments. We demonstrate here a plausible approach in comparing and combining the analytical results of a feature-based approach (FCS) with cluster discovery approach (PEP) and association-based approach (Maxlink). We expand our biological roadmap with significant FCS complexes and then augment this with additional knowledge from novel predicted complexes from PEP. Selection for experimental validation as well as uncovering non-cluster-based associated proteins can be uncovered using Maxlink. We also report some novel VPA-associated clusters that are biologically relevant to the observed phenotype.
Recovery analysis suggests that FCS utilizing real complexes far outperforms any method predicated on biological networks (including FCS). While this suggests that network quality is far from optimal, it also denotes that any conclusions or insights drawn from biological networks need to be rigorously backed with supporting biological information drawn elsewhere.
Acknowledgments
We thank Dr. Newman Sze Siu Kwan Lab, Nanyang Technological University (NTU) for the iTraq procedure; Dr Hirotaka Oikawa for sample preparation; Miss Vania Lim for illustration preparation. This work was supported in part by a Wellcome Trust Scholarship 83701/Z/07/Z for W.W.B.G. and a Singapore Ministry of Education Tier-2 grant MOE2012-T2-1-061 for L.W.
Supporting Information Available
VPA/VEH correlations; differential protein list; PEP output; FCS output (real human complexes; FCS output (predicted complexes); Maxlink output; identified protein details. This material is available free of charge via the Internet at http://pubs.acs.org.
The authors declare no competing financial interest.
The section entitled Maxlink has been corrected. The revised version was re-posted on April 24, 2013.
Supplementary Material
References
- Goh W. W.; Lee Y. H.; Chung M.; Wong L. How advancement in biological network analysis methods empowers proteomics. Proteomics 2012, 12, 550–63. [DOI] [PubMed] [Google Scholar]
- Lee Y. Y.; McKinney K. Q.; Ghosh S.; Iannitti D. A.; Martinie J. B.; Caballes F. R.; Russo M. W.; Ahrens W. A.; Lundgren D. H.; Han D. K.; Bonkovsky H. L.; Hwang S. I. Subcellular tissue proteomics of hepatocellular carcinoma for molecular signature discovery. J. Proteome Res. 2011, 10115070–83. [DOI] [PubMed] [Google Scholar]
- Long X.; Zhang J.; Zhang Y.; Yao J.; Cai Z.; Yang P. Nano-LC-MS/MS based proteomics of hepatocellular carcinoma cells compared to Chang liver cells and tanshinone IIA induction. Mol. Biosyst. 2011, 751728–41. [DOI] [PubMed] [Google Scholar]
- Goh W. W.; Wong L. Networks in proteomics analysis of cancer. Curr. Opin. Biotechnol. 2013, 10.1016/j.copbio.2013.02.011. [DOI] [PubMed] [Google Scholar]
- Adamcsek B.; Palla G.; Farkas I. J.; Derenyi I.; Vicsek T. CFinder: locating cliques and overlapping modules in biological networks. Bioinformatics 2006, 2281021–3. [DOI] [PubMed] [Google Scholar]
- Li J.; Zimmerman L. J.; Park B. H.; Tabb D. L.; Liebler D. C.; Zhang B. Network-assisted protein identification and data interpretation in shotgun proteomics. Mol. Syst. Biol. 2009, 5, 303. [DOI] [PMC free article] [PubMed] [Google Scholar]
- Goh W. W.; Lee Y. H.; Zubaidah R. M.; Jin J.; Dong D.; Lin Q.; Chung M. C.; Wong L. Network-based pipeline for analyzing MS data: an application toward liver cancer. J. Proteome Res. 2011, 1052261–72. [DOI] [PMC free article] [PubMed] [Google Scholar]
- Pavlidis P.; Lewis D. P.; Noble W. S. Exploring gene expression data with class scores. Pac. Symp. Biocomput. 2002, 474–85. [PubMed] [Google Scholar]
- Venet D.; Dumont J. E. Detours, V., Most random gene expression signatures are significantly associated with breast cancer outcome. PLoS Comput. Biol. 2011, 710e1002240. [DOI] [PMC free article] [PubMed] [Google Scholar]
- Ostlund G.; Lindskog M.; Sonnhammer E. L. Network-based Identification of novel cancer genes. Mol. Cell. Proteomics 2010, 94648–55. [DOI] [PMC free article] [PubMed] [Google Scholar]
- Goh W. W.; Fan M.; Low H. S.; Sergot M.; Wong L. Enhancing the utility of Proteomics Signature Profiling (PSP) with Pathway Derived Subnets (PDSs), performance analysis and specialised ontologies. BMC Genomics 2013, 14135. [DOI] [PMC free article] [PubMed] [Google Scholar]
- Goh W. W.; Lee Y. H.; Ramdzan Z. M.; Sergot M. J.; Chung M.; Wong L. Proteomics signature profiling (PSP): a novel contextualization approach for cancer proteomics. J. Proteome Res. 2012, 1131571–81. [DOI] [PMC free article] [PubMed] [Google Scholar]
- Bredy T. W.; Barad M. The histone deacetylase inhibitor valproic acid enhances acquisition, extinction, and reconsolidation of conditioned fear. Learn. Mem. 2008, 15139–45. [DOI] [PMC free article] [PubMed] [Google Scholar]
- Kondo T. Epigenetic alchemy for cell fate conversion. Curr. Opin. Genet. Dev. 2006, 165502–7. [DOI] [PubMed] [Google Scholar]
- Hsieh J.; Nakashima K.; Kuwabara T.; Mejia E.; Gage F. H. Histone deacetylase inhibition-mediated neuronal differentiation of multipotent adult neural progenitor cells. Proc. Natl. Acad. Sci. U.S.A. 2004, 1014716659–64. [DOI] [PMC free article] [PubMed] [Google Scholar]
- Perisic T.; Zimmermann N.; Kirmeier T.; Asmus M.; Tuorto F.; Uhr M.; Holsboer F.; Rein T.; Zschocke J. Valproate and amitriptyline exert common and divergent influences on global and gene promoter-specific chromatin modifications in rat primary astrocytes. Neuropsychopharmacology 2010, 353792–805. [DOI] [PMC free article] [PubMed] [Google Scholar]
- Silingardi D.; Scali M.; Belluomini G.; Pizzorusso T. Epigenetic treatments of adult rats promote recovery from visual acuity deficits induced by long-term monocular deprivation. Eur. J. Neurosci. 2010, 31122185–92. [DOI] [PubMed] [Google Scholar]
- Putignano E.; Lonetti G.; Cancedda L.; Ratto G.; Costa M.; Maffei L.; Pizzorusso T. Developmental downregulation of histone posttranslational modifications regulates visual cortical plasticity. Neuron 2007, 535747–59. [DOI] [PubMed] [Google Scholar]
- Goh W. W.; Oikawa H.; Sng J. C.; Sergot M.; Wong L. The role of miRNAs in complex formation and control. Bioinformatics 2012, 284453–6. [DOI] [PMC free article] [PubMed] [Google Scholar]
- Kersey P. J.; Duarte J.; Williams A.; Karavidopoulou Y.; Birney E.; Apweiler R. The International Protein Index: an integrated database for proteomics experiments. Proteomics 2004, 471985–8. [DOI] [PubMed] [Google Scholar]
- Elias J. E.; Gygi S. P. Target-decoy search strategy for increased confidence in large-scale protein identifications by mass spectrometry. Nat. Methods 2007, 43207–14. [DOI] [PubMed] [Google Scholar]
- Datta A.; Park J. E.; Li X.; Zhang H.; Ho Z. S.; Heese K.; Lim S. K.; Tam J. P.; Sze S. K. Phenotyping of an in vitro model of ischemic penumbra by iTRAQ-based shotgun quantitative proteomics. J. Proteome Res. 2010, 91472–84. [DOI] [PubMed] [Google Scholar]
- Li X.; Cai H.; Xu J.; Ying S.; Zhang Y. A mouse protein interactome through combined literature mining with multiple sources of interaction evidence. Amino Acids 2010, 3841237–52. [DOI] [PubMed] [Google Scholar]
- Xia K.; Dong D.; Han J. D. IntNetDB v1.0: an integrated protein-protein interaction network database generated by a probabilistic model. BMC Bioinformatics 2006, 7, 508. [DOI] [PMC free article] [PubMed] [Google Scholar]
- Jiang P.; Singh M. SPICi: a fast clustering algorithm for large biological networks. Bioinformatics 2010, 2681105–11. [DOI] [PMC free article] [PubMed] [Google Scholar]
- Ruepp A.; Waegele B.; Lechner M.; Brauner B.; Dunger-Kaltenbach I.; Fobo G.; Frishman G.; Montrone C.; Mewes H. W. CORUM: the comprehensive resource of mammalian protein complexes–2009. Nucleic Acids Res. 2010, 38, D497–501. [DOI] [PMC free article] [PubMed] [Google Scholar]
- Lessard J.; Wu J. I.; Ranish J. A.; Wan M.; Winslow M. M.; Staahl B. T.; Wu H.; Aebersold R.; Graef I. A.; Crabtree G. R. An essential switch in subunit composition of a chromatin remodeling complex during neural development. Neuron 2007, 552201–15. [DOI] [PMC free article] [PubMed] [Google Scholar]
- Noutel J.; Hong Y. K.; Leu B.; Kang E.; Chen C. Experience-dependent retinogeniculate synapse remodeling is abnormal in MeCP2-deficient mice. Neuron 2011, 70135–42. [DOI] [PMC free article] [PubMed] [Google Scholar]
- Philpot B. D.; Cho K. K.; Bear M. F. Obligatory role of NR2A for metaplasticity in visual cortex. Neuron 2007, 534495–502. [DOI] [PMC free article] [PubMed] [Google Scholar]
- Fagiolini M.; Katagiri H.; Miyamoto H.; Mori H.; Grant S. G.; Mishina M.; Hensch T. K. Separable features of visual cortical plasticity revealed by N-methyl-D-aspartate receptor 2A signaling. Proc. Natl. Acad. Sci. U.S.A. 2003, 10052854–9. [DOI] [PMC free article] [PubMed] [Google Scholar]
- Guan J. S.; Haggarty S. J.; Giacometti E.; Dannenberg J. H.; Joseph N.; Gao J.; Nieland T. J.; Zhou Y.; Wang X.; Mazitschek R.; Bradner J. E.; DePinho R. A.; Jaenisch R.; Tsai L. H. HDAC2 negatively regulates memory formation and synaptic plasticity. Nature 2009, 459724355–60. [DOI] [PMC free article] [PubMed] [Google Scholar]
- Van den Bergh G.; Clerens S.; Cnops L.; Vandesande F.; Arckens L. Fluorescent two-dimensional difference gel electrophoresis and mass spectrometry identify age-related protein expression differences for the primary visual cortex of kitten and adult cat. J. Neurochem. 2003, 851193–205. [DOI] [PubMed] [Google Scholar]
- Lim V.; Goh W.; Wong L.; Sng J., Downregulation of HDAC1 by valproic acid improves visual acuity in adult visual cortex. 2013, In submission.
- Svitkina T.; Lin W. H.; Webb D. J.; Yasuda R.; Wayman G. A.; Van Aelst L.; Soderling S. H. Regulation of the postsynaptic cytoskeleton: roles in development, plasticity, and disorders. J. Neurosci. 2010, 304514937–42. [DOI] [PMC free article] [PubMed] [Google Scholar]
- Yao J.; Qi J.; Chen G. Actin-dependent activation of presynaptic silent synapses contributes to long-term synaptic plasticity in developing hippocampal neurons. J. Neurosci. 2006, 26318137–47. [DOI] [PMC free article] [PubMed] [Google Scholar]
- Cerri C.; Fabbri A.; Vannini E.; Spolidoro M.; Costa M.; Maffei L.; Fiorentini C.; Caleo M. Activation of Rho GTPases triggers structural remodeling and functional plasticity in the adult rat visual cortex. J. Neurosci. 2011, 314215163–72. [DOI] [PMC free article] [PubMed] [Google Scholar]
- Boroojerdi B.; Battaglia F.; Muellbacher W.; Cohen L. G. Mechanisms underlying rapid experience-dependent plasticity in the human visual cortex. Proc. Natl. Acad. Sci. U.S.A. 2001, 982514698–701. [DOI] [PMC free article] [PubMed] [Google Scholar]
- Huang S.; Trevino M.; He K.; Ardiles A.; Pasquale R.; Guo Y.; Palacios A.; Huganir R.; Kirkwood A. Pull-push neuromodulation of LTP and LTD enables bidirectional experience-induced synaptic scaling in visual cortex. Neuron 2012, 733497–510. [DOI] [PMC free article] [PubMed] [Google Scholar]
- Chen W. S.; Bear M. F. Activity-dependent regulation of NR2B translation contributes to metaplasticity in mouse visual cortex. Neuropharmacology 2007, 521200–14. [DOI] [PubMed] [Google Scholar]
- Bear M. F. Bidirectional synaptic plasticity: from theory to reality. Philos. Trans. R. Soc., B 2003, 3581432649–55. [DOI] [PMC free article] [PubMed] [Google Scholar]
- Fagiolini M.; Fritschy J. M.; Low K.; Mohler H.; Rudolph U.; Hensch T. K. Specific GABAA circuits for visual cortical plasticity. Science 2004, 30356641681–3. [DOI] [PubMed] [Google Scholar]
- Maya Vetencourt J. F.; Sale A.; Viegi A.; Baroncelli L.; De Pasquale R.; O’Leary O. F.; Castren E.; Maffei L. The antidepressant fluoxetine restores plasticity in the adult visual cortex. Science 2008, 3205874385–8. [DOI] [PubMed] [Google Scholar]
Associated Data
This section collects any data citations, data availability statements, or supplementary materials included in this article.