Abstract
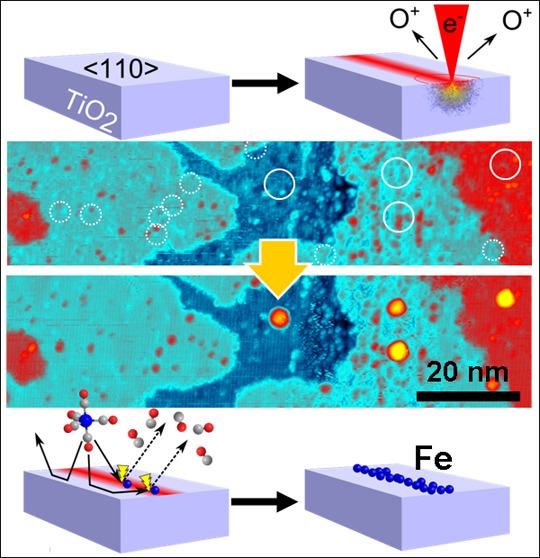
Electron beam-induced surface activation (EBISA) has been used to grow wires of iron on rutile TiO2(110)-(1 × 1) in ultrahigh vacuum. The wires have a width down to ∼20 nm and hence have potential utility as interconnects on this dielectric substrate. Wire formation was achieved using an electron beam from a scanning electron microscope to activate the surface, which was subsequently exposed to Fe(CO)5. On the basis of scanning tunneling microscopy and Auger electron spectroscopy measurements, the activation mechanism involves electron beam-induced surface reduction and restructuring.
Introduction
Surfaces of rutile TiO2 have for many years been used as model systems to explore the physics and chemistry associated with the varied applications of the material.1,2 Of particular interest has been the surface science associated with light harvesting processes such as photocatalysis and dye-sensitized photovoltaics.1,2 Applications in the field of molecular electronics have also been suggested, with TiO2 being employed as a dielectric substrate. This has motivated studies of metal wire growth as interconnects using physical vapor deposition.3 Moreover, electron-induced surface modification of TiO2(110)4−6 is of interest as a means of patterning the substrate for wire formation or to template an array of functional molecules. There is a related interest in the generation of memristor elements on TiO2.7
In this work we examine the potential of electron beam-induced surface activation (EBISA)8 to deposit metallic structures, including wires, on rutile TiO2(110) in ultrahigh vacuum (UHV). The latter environment is essential for the analysis methods employed as well as to avoid contamination from residual gases.9 EBISA is a technique that is part of a more general approach termed focused electron beam-induced processing (FEBIP), which also includes the related technique of electron beam-induced deposition (EBID).10−13
A step-by-step explanation of the recently developed EBISA process is given in Figure 1. The substrate (a) is first irradiated with energetic electrons, resulting in local activation of the surface by electron-stimulated desorption of O atoms (b).6,14 In a second step, precursor molecules are decomposed upon contact with the activated area, resulting in a deposition of nonvolatile material (c, d). In addition, the initial deposit grows in size because of autocatalytic decomposition of precursor molecules (e, f).8 The autocatalytic growth has been demonstrated for iron pentacarbonyl, Fe(CO)5, on SiOx in UHV8,15,16 and recently also for Co2(CO)8, indicating the general nature of this process for metalcarbonyls.17,18 Here we demonstrate EBISA-induced interconnect growth on TiO2(110). Moreover, additional insight into the mechanism of the EBISA process has been achieved using local Auger electron spectroscopy (AES) to gain chemical information and scanning tunneling microscopy (STM) to provide atomic scale images.
Figure 1.
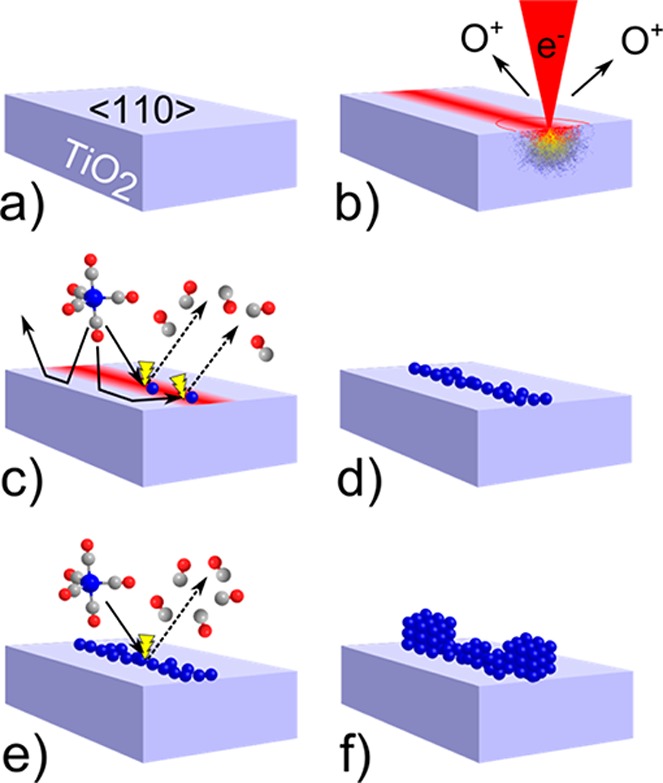
Electron beam-induced surface activation (EBISA) and the secondary growth process. The pristine (110) surface of a TiO2 (rutile) crystal (a) is exposed to a focused 15 keV electron beam (b), leading to the localized release of oxygen via electron-stimulated desorption processes. The activated surface mediates the dissociation of Fe(CO)5 molecules (c) into volatile CO molecules and a primary deposit of iron atoms (d). Further supply of Fe(CO)5 increases the deposit size via an autocatalytic decomposition reaction (e). Under the given reaction conditions, the growth process produces very pure, cubic iron crystallites (f).
Experimental Section
All experiments were performed in an Omicron UHV Multiscanlab at room temperature. The base pressure of the instrument was <2 × 10⁻¹⁰ mbar. The instrument includes an electron column for scanning electron microscopy (SEM) with spatial resolution better than 3 nm. This column is also used in combination with a hemispherical electron energy analyzer for local Auger electron spectroscopy (AES) and scanning Auger microscopy (SAM) with a spatial resolution better than 10 nm. For AES, a beam energy of 15 keV and a current of 3 nA were used, while all electron exposures for SEM and lithography were done at an electron beam energy of 15 keV and a probe current of 400 pA. The lithographic processes were controlled via a homemade lithography application based on LabVIEW 8.6 (National Instruments) and a high-speed DAC PCIe-card (M2i.6021-exp, Spectrum GmbH, Germany). For line exposures (single pixel width), a single sweep with a step size of 12 nm was applied. The line dose dL is calculated as dL = IPE × tdwell/Δx, where IPE is the beam current, tdwell the dwell time at every position, and Δx the step size along the line. The electron dose was controlled via the respective dwell times. The square patterns were exposed in a single sweep, meander-like pattern at a step size of 6 nm with the area dose dA being defined as dA = IPE × tdwell/(Δx)2. The corresponding area dose dA for a given line dose dL can be estimated by dividing dL by the step size.
The backscattered electron (BSE) exit areas and coefficient were simulated with the program Casino V2.42.19 The diameter corresponds to an area of which 99% of BSEs are emitted. For the simulations, a primary electron (PE) number of 107 was applied. The beam diameter was set to 3 nm.
An STM scanner can be inserted between the pole piece of the SEM column and the sample for in situ STM measurements. Tip positioning is done using SEM imaging. W tips were used in this work, negatively biased relative to the sample. ST micrographs were acquired using Matrix V3.0 (Omicron) and evaluated using the latest versions of WSxM20 (Nanotec Electronica, Madrid, Spain).
Rutile TiO2(110) samples (PiKem and Crystec) were prepared by repeated cycles of Ar+ sputtering and annealing to 1160–1180 K until a sharp (1 × 1) low-energy electron diffraction (LEED) pattern was obtained with no detectable contaminants in AES. The purity of the Fe(CO)5 precursor gas (ACROS Organics, 99.5%) was confirmed using a mass spectrometer. The precursor gas was dosed through a nozzle to about 12 mm from the TiO2(110) surface at an estimated local pressure of ∼9 × 10⁻⁶ mbar, based on simulations with the software GIS Simulator (version 1.5).21,22
Results and Discussion
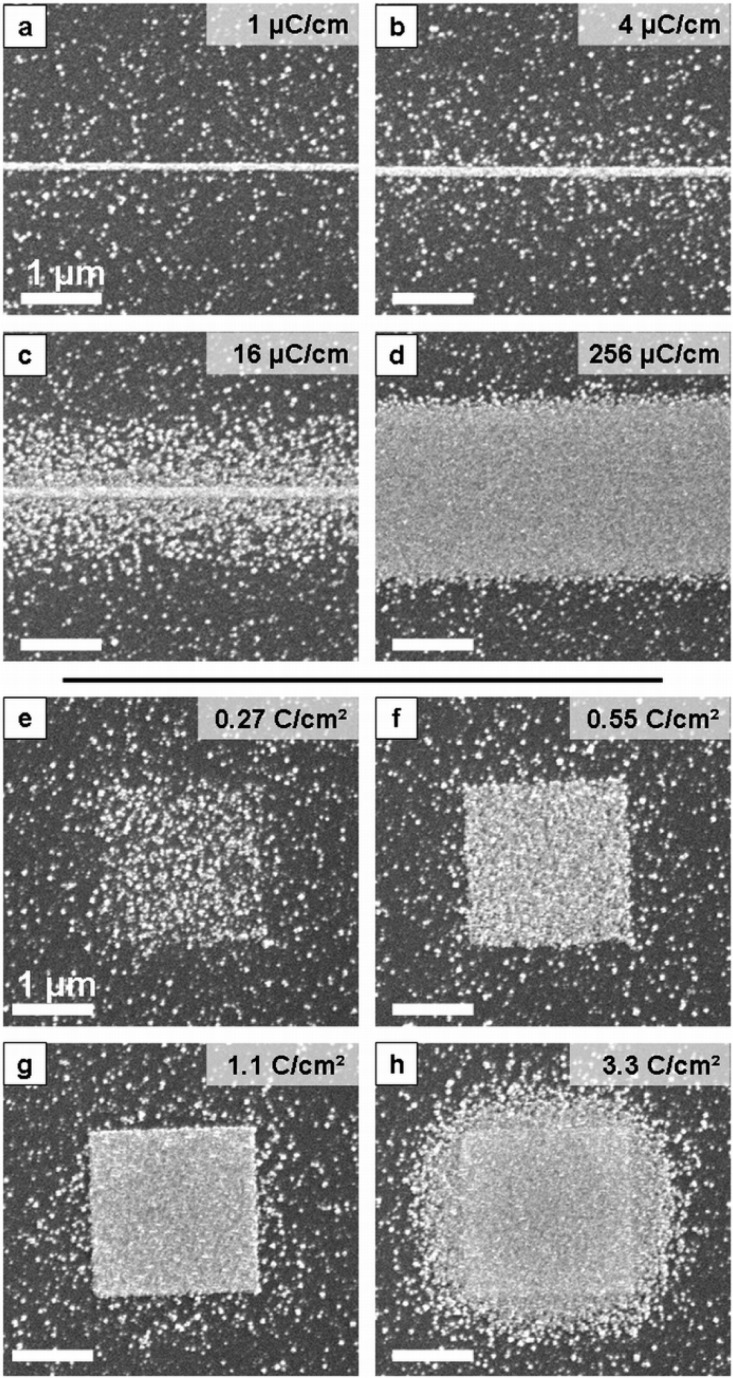
The first goal of this work was to extend the use of the EBISA technique, which thus far has only been reported for silica surfaces, to a different oxide material, namely a TiO2(110)-(1 × 1) surface. For that purpose, line patterns and square patterns (2 × 2 μm2) were irradiated with a focused electron beam. Fe(CO)5 was subsequently introduced to allow growth of iron structures at the irradiated positions. The gas was pumped off after 270 min, corresponding to an exposure of about 1.1 × 10⁵ langmuir (1 langmuir is 10–6 Torr s). Figure 2 shows SEM images of the resulting Fe line deposits (panels a–d) and Fe square deposits (panels e–h). The images show a strong increase in the amount of deposited iron with electron dose. AES measurements 24 h after fabrication (see Figure S1 in Supporting Information) indicate the purity of the iron structures is >90 atom %, which is similar to that achieved on SiO2 substrates.8,15,16 Those iron deposits on SiO2 exhibit a low room-temperature resistivity of 88 μΩ cm as well as ferromagnetic behavior.23 These properties can be expected to be similar on TiO2, potentially making the corresponding iron deposits suitable interconnects.
Figure 2.
Line (a–d) and 2 × 2 μm2 square deposits (e–h) fabricated by EBISA on TiO2(110) using Fe(CO)5 as a precursor (approximately 1.1 × 10⁵ langmuir). Primary electron (PE) doses are indicated on the top right of each panel. The line width (fwhm, SEM intensity) increases with PE dose range from approximately 150 nm (a) to 2.6 μm (d). The central line is a result of activation by PEs, while the fringe is caused by BSE proximity effects. For the square fields, deposit density increases from a loose grain assembly at 0.27 C/cm2 via a close-packed assembly at 0.55 C/cm2 to a fused grain deposit of near ideal geometry at 1.1 C/cm2. At even higher doses, proximity effects also cause a fringe growth (3.3 C/cm2). Note that scattered iron clusters are found all over the surface without electron exposure, a fact which is attributed to active defects created during sample preparation.
At higher SEM magnification we observe that the structures are comprised of crystalline iron nanocubes. The density of the cubes within the line and square deposits varies with the applied electron dose, whereas the size of the individual cubes at a given gas exposure seems to be similar. With increasing gas exposure the size of the clusters increases because of autocatalytic growth. For increased electron doses, the cubes start to merge into continuous patches, as can be seen for the 1.1 C/cm2 square deposit (Figure 2g) or the line deposits (Figure 2a,b). Higher electron doses mark the start of pronounced proximity effects, i.e., unintended deposits near the irradiated patterns due to electron scattering.11,16,24 Pronounced proximity effects are present at the 3.3 C/cm2 square irradiation doses (Figure 2h) and the higher line doses (Figure 2c,d). For EBISA, all of the observed proximity effects can be attributed solely to BSE and associated secondary electrons (SEII).16 Proximity effects from forward scattered electrons (FSE) are not observed in EBISA because of the absence of structure growth during the electron beam exposure step.16
The observation of homogeneously scattered cubes in the nonirradiated surface regions at low electron irradiation doses (Figure 2a,b,e) points to the presence of nucleation points on the TiO2(110) surface that were not induced by the electron beam (see also Supporting Information, Figure S2). The defects are oxygen vacancies, which typically are present at an initial concentration of 5% ML (1 monolayer is the number of surface unit cells). The vacancies react with water in the residual vacuum to form the second major form of defects, bridging hydroxyls (one water molecule reacts with one vacancy to produce two hydroxyls).25
Turning to the EBISA mechanism, we can first look at the effect of the 15 keV electron beam on the reduction state of the surface. Figure 3a shows Auger electron spectra for nonirradiated (red line, “pristine”) and strongly irradiated (blue line, “reduced”) areas of a freshly prepared TiO2(110) surface. The most prominent features are the TiLMM and TiLMV peaks at 383 and 413–419 eV, respectively, and the OKLL peaks at 491 and 511 eV. It is immediately apparent that the oxygen signal for the strongly irradiated surface (blue) is considerably smaller than that for the pristine surface (red); the Ti signals show the opposite trend, albeit not as pronounced. This behavior evidences the electron beam-induced desorption of oxygen from the surface and is in line with that expected from electron-stimulated desorption (ESD) results from TiO2 at lower electron beam energies.6,14 In addition, the change of the peak shape of the TiLMV signal allows for insight into the chemical state of the Ti atoms of the surface. As discussed by Nishigaki26 and Göpel,27 the LMV Auger peak consists of two components: 413 eV for Ti4+ and 419 eV for Ti<4+. In a simplified picture, for Ti4+, in the complete absence of a Ti 3d valence electron, the valence electron in the LMV Auger process stems from an interatomic transition of an O 2p electron with a higher binding energy; on the contrary, for Ti<4+, at least a partial electron charge remains in the Ti 3d level (at lower binding energy than the O 2p level) and thus participates in an intra-atomic Auger transition at higher kinetic energy. Therefore, the observed intensity shift from the low- to the high-kinetic energy contribution of the TiLMV peak is a direct indication of a reduction of the Ti4+ by the electron beam. The evolution of the LMV peak shape upon increasing electron irradiation is illustrated in Figure 3b from top (pristine, red) to bottom (reduced, blue).
Figure 3.
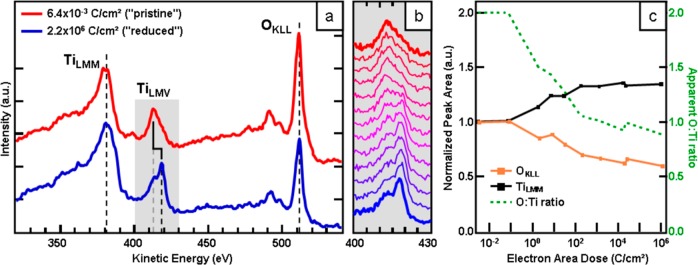
(a) AE spectra of pristine (red) and electron irradiated, reduced (blue)TiO2 samples in nonderivative mode. The loss of oxygen KLL intensity is a clear indication of oxygen loss, i.e., ESD, while the intensity shift of the titanium LMV peak from lower- to higher-kinetic energy is an indication of a shift from fully oxidized Ti4+ toward more reduced states like Ti3+ or even lower. The gradual shift of the peak shape with increasing electron dose is shown from top to bottom in (b). (c) Quantitative evaluation of the normalized TiLMM (black) and OKLL (orange) peak areas and apparent O:Ti ratio (green) versus applied electron dose. The apparent O:Ti ratio (green) is set to 2:1 (TiO2) for very low electron doses, i.e., a pristine substrate. Electron stimulated desorption causes a loss of oxygen atoms, i.e., signal intensity, which simultaneously leads to an increase in the relative intensity of the TiLMM signal.
In Figure 3c, the normalized (Ipristine = 1) peak areas of the TiLMM (black) and OKLL (orange) signals and the O:Ti peak ratio (green) are plotted versus the primary electron dose (note the logarithmic scale). The apparent O:Ti peak ratio is normalized so that the value for the pristine surface is set to 2, i.e., TiO2.0. At doses lower than 0.1 C/cm2, the peak ratio does not change, i.e., the applied dose is not sufficient to induce a reduction of the surface detectable in AES. After crossing the 0.1 C/cm2 threshold, the oxygen intensity and the O:Ti ratio drop rapidly until a fairly stable lower limit at ∼0.9 is approached at doses larger than 103 C/cm2. The corresponding relative oxygen intensity is 0.6 of the initial value of the pristine surface. The obtained O:Ti ratio of 0.9 indicates an average surface composition of TiO0.9. Note that the chemical composition of the surface is likely to be nonuniform after the reduction process, so the detected Auger signal is a convolution of different Ti oxidation states and chemical surrounding. In addition, decreased damping due to the loss of oxygen atoms from the topmost layers has to be taken into consideration when assessing the TiLMM intensity. Nevertheless, the O:Ti ratio serves as an indicator for the degree of electron beam-induced reduction of the surface.
The Auger spectra indicate that above 0.1 C/cm2 the stoichiometry of the surface changes gradually from TiO2 to TiO0.9 at 103 C/cm2. As for the accompanying morphology change, Figure 4 shows the effect of the electron beam as viewed by STM. Prior to electron beam exposure, the STM image shows [001] direction bright rows separated by 0.65 nm that correspond to Ti atoms.1,28 A line exposure corresponding to an electron area dose of approximately 60–100 C/cm2 (electron energy, 15 keV; beam current, 400 pA; step size, 12 nm; dwell time, 150 ms; line dose, 50 μC/cm) results in an O:Ti ratio of 1.1–1.2. The exposed region can be clearly identified in the image in Figure 4 as an area with a disordered appearance and a strongly increased number of protrusions (bright spots) arranged within a vertical line with a width of approximately 20 ± 5 nm (indicated by dotted yellow lines); this width is ∼7 times larger than the nominal beam diameter of 3 nm (Gauss profile, 20/80 criterion), indicating the well-known broadening due to SE and BSE proximity effects. The apparent surface roughness (rms) of the exposed area (0.12 nm) in STM is double that of the nonirradiated surface. The left-hand side of the image in Figure 4 resembles the as-prepared surface, with the characteristic [001] direction Ti rows visible (see also Supporting Information, Figure S3). However, there are additional defects in the form of isolated protrusions and in-row depressions (white arrows) that can be attributed to proximity effects, as the density is higher than on the as-prepared surface. Apart from the increase in mean roughness, the electron beam-induced disorder does not cause a significant increase in average apparent height. This indicates the absence of unintentionally formed deposits from residual gases.
Figure 4.
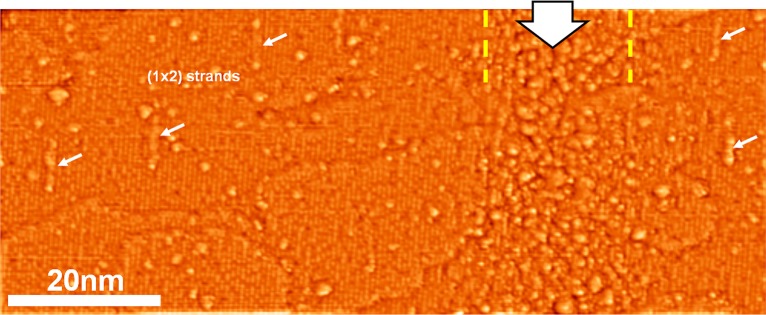
High resolution ST micrograph (I = 280 pA, U = 1.2 V, moderately high-pass filtered) of an electron beamline irradiation (50 μC/cm), marked by the large arrow and yellow lines. The surface on the left shows only minor damage; the typical row pattern of the TiO2(110) surface is preserved. Defects include (1 × 2) reconstructed sections (small arrows), dark defects in the row structure, and isolated protrusions. On the right, a disordered section running top to bottom was identified as the result of a line irradiation with a primary electron dose of 50 μC/cm. The (1 × 1) structure is barely retained in the highly damaged area; no characteristic defects can be identified in the irradiated area. The loss of long- and short-range order corresponds to an electron-induced surface amorphization.
The center of the SEM image in Figure 5a clearly shows a significant electron beam-induced darkening. In previous studies we showed that this darkening of irradiated areas is an intrinsic feature of electron beamed oxide surfaces and is not indicative of contamination.8 These results indicate that the modifications to the TiO2(110) morphology and subsequent reaction with Fe(CO)5 are a result of electron beam-induced oxygen loss.
Figure 5.
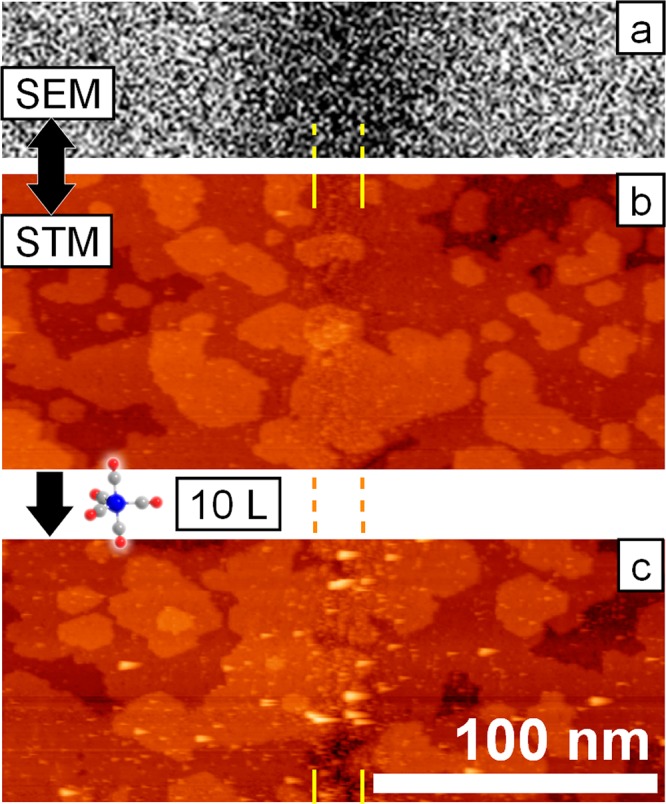
SEM scan (a) and STM topography (b) of the TiO2(110) surface after line irradiation with 50 μC/cm and after initial Fe growth from Fe(CO)5 (c). The line position is indicated by yellow lines. The strongly contrast-enhanced scanning electron micrograph (a) shows a dark feature at the position of the line irradiation, conventionally attributed to carbon deposition from residual gases. STM reveals a high degree of disorder at the line position, while the surrounding surface remains fairly unaffected by the irradiation. Upon exposure to about 10 langmuir of Fe(CO)5, clusters form predominantly at the irradiated surface area (c). Cluster formation next to the line exposure is attributed to defects induced by backscattered electrons, i.e., common proximity effects.
Panels b and c in Figure 5 show the STM images of the irradiated 50 μC/cm line pattern before and after Fe(CO)5 dosing (total exposure: ∼10 langmuir), respectively. After the gas exposure, the formation of iron deposits in the form of clusters is observed, primarily in the regions irradiated with electrons (indicated by yellow lines). Larger clusters appear as slightly asymmetric protrusions in the image, a consequence of the applied scanning speed. These clusters have a typical diameter of 3.2 ± 0.3 nm, including tip convolution, and an apparent height of 1.2 ± 0.1 nm (see Supporting Information, Figure S2). This corresponds to clusters containing 650–1000 Fe atoms.
In addition to the clusters observed within the yellow lines in Figure 5, some deposits are also found in nonirradiated areas to both sides of the irradiated line. These clusters originate from growth due to the intrinsic surface defects in TiO2(110) (see above), as well as from growth due to BSE proximity effect-induced defects. The BSE exit range of TiO2, here defined as the distance from the point of impact that includes 99% of all emitted BSEs (r99), was extracted from MC simulations and amounts to about 1050 nm. All of the scanned area in Figure 5c is well within this exit range. The BSEs (E > 50 eV by definition) are able to induce ESD of oxygen atoms within the Knotek–Feibelman framework (Emin,ESD = ∼34 eV),14 thus creating isolated defects.
Summary
Iron nanowires and other nanostructures have been grown on TiO2(110)-(1 × 1) by electron beam-induced activation and subsequent dissociative adsorption of Fe(CO)5. The mechanism of the EBISA process appears to involve reduction and restructuring of the substrate due to electron stimulated desorption of oxygen. This work has demonstrated the potential of EBISA to write nanoscale interconnects on a functional dielectric substrate and opens up the possibility of electronic circuit fabrication at the nanoscale.
Acknowledgments
This work was funded by DFG through Grant MA 4246/1-2 and the Excellence Cluster “Engineering of Advanced Materials” granted to the University of Erlangen Nürnberg, COST Action CM601 Electron Controlled Chemical Lithography, COST Action 1104 Reducible Metal Oxides, an ERC Advanced Grant ENERGYSURF, and EPSRC (U.K.). F.V. acknowledges funding from the Studienstiftung d. dt. Volkes. G.T. acknowledges additional support from the Humboldt Stiftung and the Royal Society.
Supporting Information Available
Local Auger electron spectrum of an iron structure prepared by EBISA on TiO2 (Figure S1), higher resolution STM data of a line irradiation before and after Fe cluster growth (Figure S2), and STM images of the freshly prepared rutile TiO2(110) surface (Figure S3). This material is available free of charge via the Internet at http://pubs.acs.org.
Author Present Address
§ M.-M.W.: Uppsala University, Department of Physics and Astronomy, Molecular and Condensed Matter Physics, Box 516, 75120 Uppsala, Sweden
The authors declare no competing financial interest.
Supplementary Material
References
- Diebold U. The Surface Science of Titanium Dioxide. Surf. Sci. Rep. 2003, 48, 53–229. [Google Scholar]
- Pang C. L.; Lindsay R.; Thornton G. Chemical Reactions on Rutile TiO2(110). Chem. Soc. Rev. 2008, 37, 2328–2353. [DOI] [PubMed] [Google Scholar]; Structure of Clean and Adsorbate-Covered Single Crystal Rutile TiO2 Surfaces. Chem. Rev. 2013, 113, 3887 - 3948. [DOI] [PubMed]
- Humphrey D. S.; Cabailh G.; Pang C. L.; Muryn C. A.; Cavill S. A.; Marchetto H.; Potenza A.; Dhesi S. S.; Thornton G. Self-Assembled Metallic Nanowires on a Dielectric Support: Pd on Rutile TiO2(110). Nano Lett. 2009, 9, 155–159. [DOI] [PubMed] [Google Scholar]
- Pang C. L.; Bikondoa O.; Humphrey D. S.; Papageorgiou A. C.; Cabailh G.; Ithnin R.; Chen Q.; Muryn C. A.; Onishi H.; Thornton G. Tailored TiO2(110) Surfaces and Their Reactivity. Nanotechnology 2006, 17, 5397–5405. [Google Scholar]
- Yim C. M.; Pang C. L.; Thornton G. Oxygen Vacancy Origin of the Surface Band-Gap State of TiO2(110). Phys. Rev. Lett. 2010, 104, 036806. [DOI] [PubMed] [Google Scholar]
- Dulub O.; Batzill M.; Solovev S.; Loginova E.; Alchagirov A.; Madey T. E.; Diebold U. Electron-Induced Oxygen Desorption from the TiO2(011)-2×1 Surface Leads to Self-Organized Vacancies. Science 2007, 317, 1052–1056. [DOI] [PubMed] [Google Scholar]
- Strukov D. B.; Snider G. S.; Stewart D. R.; Williams R. S. The Missing Memristor Found. Nature 2008, 453, 80–83. [DOI] [PubMed] [Google Scholar]
- Walz M.-M.; Schirmer M.; Vollnhals F.; Lukasczyk T.; Steinrück H.-P.; Marbach H. Electrons as “Invisible Ink”: Fabrication of Nanostructures by Local Electron Beam Induced Activation of SiOx. Angew. Chem., Int. Ed. 2010, 49, 4669–4673. [DOI] [PubMed] [Google Scholar]
- Lukasczyk T.; Schirmer M.; Steinrück H.-P.; Marbach H. Electron-Beam-Induced Deposition in Ultrahigh Vacuum: Lithographic Fabrication of Clean Iron Nanostructures. Small 2008, 4, 841–846. [DOI] [PubMed] [Google Scholar]
- Randolph S. J.; Fowlkes J. D.; Rack P. D. Focused, Nanoscale Electron-Beam-Induced Deposition and Etching. Crit. Rev. Solid State Mater. Sci. 2006, 31, 55–89. [Google Scholar]
- van Dorp W. F.; Hagen C. W. A Critical Literature Review of Focused Electron Beam Induced Deposition. J. Appl. Phys. 2008, 104, 081301. [Google Scholar]
- Utke I.; Gölzhäuser A. Small, Minimally Invasive, Direct: Electrons Induce Local Reactions of Adsorbed Functional Molecules on the Nanoscale. Angew. Chem., Int. Ed. 2010, 49, 9328–9330. [DOI] [PubMed] [Google Scholar]
- Huth M.; Porrati F.; Schwalb C.; Winhold M.; Sachser R.; Dukic M.; Adams J.; Fantner G. Focused Electron Beam Induced Deposition: A Perspective. Beilstein J. Nanotechnol. 2012, 3, 597–619. [DOI] [PMC free article] [PubMed] [Google Scholar]
- Knotek M. L.; Feibelman P. J. Ion Desorption by Core-Hole Auger Decay. Phys. Rev. Lett. 1978, 40, 964–967. [Google Scholar]
- Walz M.-M.; Vollnhals F.; Schirmer M.; Steinrück H.-P.; Marbach H. Generation of Clean Iron Nanocrystals on an Ultra-Thin SiOx Film on Si(001). Phys. Chem. Chem. Phys. 2011, 13, 17333–17338. [DOI] [PubMed] [Google Scholar]
- Walz M.-M.; Vollnhals F.; Rietzler F.; Schirmer M.; Steinrück H.-P.; Marbach H. Investigation of Proximity Effects in Electron Microscopy and Lithography. Appl. Phys. Lett. 2012, 100, 053118. [Google Scholar]
- Muthukumar K.; Jeschke H. O.; Valentí R.; Begun E.; Schwenk J.; Porrati F.; Huth M. Spontaneous Dissociation of Co2(CO)8 and Autocatalytic Growth of Co on SiO2: A Combined Experimental and Theoretical Investigation. Beilstein J. Nanotechnol. 2012, 3, 546–555. [DOI] [PMC free article] [PubMed] [Google Scholar]
- Córdoba R.; Sesé J.; Ibarra M. R.; De Teresa J. M. Autocatalytic Growth of Co on Pure Co Surfaces Using Co2(CO)8 Precursor. Appl. Surf. Sci. 2012, 263, 242–246. [Google Scholar]
- Drouin D.; Couture A. R.; Joly D.; Tastet X.; Aimez V.; Gauvin R. CASINO V2.42—A Fast and Easy-to-use Modeling Tool for Scanning Electron Microscopy and Microanalysis Users. Scanning 2007, 29, 92–101. [DOI] [PubMed] [Google Scholar]
- Horcas I.; Fernández R.; Gómez-Rodríguez J. M.; Colchero J.; Gómez-Herrero J.; Baro A. M. WSXM: A Software for Scanning Probe Microscopy and a Tool for Nanotechnology. Rev. Sci. Instrum. 2007, 78, 013705. [DOI] [PubMed] [Google Scholar]
- Friedli V.; Utke I. Optimized Molecule Supply from Nozzle-Based Gas Injection Systems for Focused Electron- and Ion-Beam Induced Deposition and Etching: Simulation and Experiment. J. Phys. D: Appl. Phys. 2009, 42, 125305. [Google Scholar]
- Schirmer M.; Walz M.-M.; Papp C.; Kronast F.; Gray A. X.; Balke B.; Cramm S.; Fadley C. S.; Steinrück H.-P.; Marbach H. Fabrication of Layered Nanostructures by Successive Electron Beam Induced Deposition with Two Precursors: Protective Capping of Metallic Iron Structures. Nanotechnology 2011, 22, 475304. [DOI] [PubMed] [Google Scholar]
- Porrati F.; Sachser R.; Walz M.-M.; Vollnhals F.; Steinrück H.-P.; Marbach H.; Huth M. Magnetotransport Properties of Iron Microwires Fabricated by Focused Electron Beam Induced Autocatalytic Growth. J. Phys. D: Appl. Phys. 2011, 44, 425001. [Google Scholar]
- Plank H.; Smith D. A.; Haber T.; Rack P. D.; Hofer F. Fundamental Proximity Effects in Focused Electron Beam Induced Deposition. ACS Nano 2012, 6, 286–294. [DOI] [PubMed] [Google Scholar]
- Bikondoa O.; Pang C. L.; Ithnin R.; Muryn C. A.; Onishi H.; Thornton G. Direct Visualization of Defect-Mediated Dissociation of Water on TiO2(110). Nat. Mater. 2006, 5, 189–192. [Google Scholar]
- Nishigaki S. Auger Electron Spectroscopy of TiO2: Inter- and Intra-Atomic Transitions Connected with the Valence Band. Surf. Sci. 1983, 125, 762–770. [Google Scholar]
- Göpel W.; Anderson J. A.; Frankel D.; Jaehnig M.; Phillips K.; Schäfer J. A.; Rocker G. Surface Defects of TiO2(110): A Combined XPS, XAES and ELS Study. Surf. Sci. 1984, 139, 333–346. [Google Scholar]
- Sánchez-Sánchez C.; González C.; Jelinek P.; Méndez J.; de Andres P. L.; Martín-Gago J. A.; López M. F. Understanding Atomic-Resolved STM Images on TiO2(110)-(1 × 1) Surface by DFT Calculations. Nanotechnology 2010, 21, 405702. [DOI] [PubMed] [Google Scholar]
Associated Data
This section collects any data citations, data availability statements, or supplementary materials included in this article.


