

Abstract
Scanning Ion Conductance Microscopy (SICM) has been developed originally for high-resolution imaging of topographic features. Recently, we have described a hybrid voltage scanning mode of SICM, termed Potentiometric-SICM (P-SICM) for recording transmembrane ionic conductance at specific nanostructures of synthetic and biological interfaces. With this technique, paracellular conductance through tight junctions – a subcellular structure that has been difficult to interrogate previously – has been realized. P-SICM utilizes a dual-barrel pipet to differentiate paracellular from transcellular transport processes with nanoscale spatial resolution. The unique combination of voltage scanning and topographic imaging enables P-SICM to capture paracellular conductance within a nominal radius of several hundred nanometers. This review summarizes recent advances in paracellular conductance recording with an emphasis on the P-SICM based approach, which is applied to detect claudin-2 mediated permeability changes at the tight junction.
Keywords: tight junction, claudin, ion channel, SICM, patch clamp, epithelium
Introduction
Movement of ions, molecules and solute across the epithelium is an intricate and well controlled process. Two primary avenues of transport exist, energy-dependent transcellular pathways or passive paracellular pathways.1-3 The cellular organelle known as the tight junction is responsible for formation of a paracellular barrier between the apical and basal compartments.4 Because the paracellular pathway is located at the cell-cell boundary, common techniques (e.g., patch-clamp) that rely on formation of a gigaohm seal between the pipet and cell membrane are not feasible. Alternate approaches to the study of paracellular transport are thus required. Most common approaches interrogate an area-averaged response of thousands, or even millions of channel conductances, with current density reaching μA/cm2. Potentiometric-Scanning Ion Conductance Microscopy (P-SICM) (Fig. 1), promises to provide a method to record paracellular conductance at subcellular resolution, which will advance understanding of micro- and nanoscale heterogeneity in transport at paracellular pathways.5
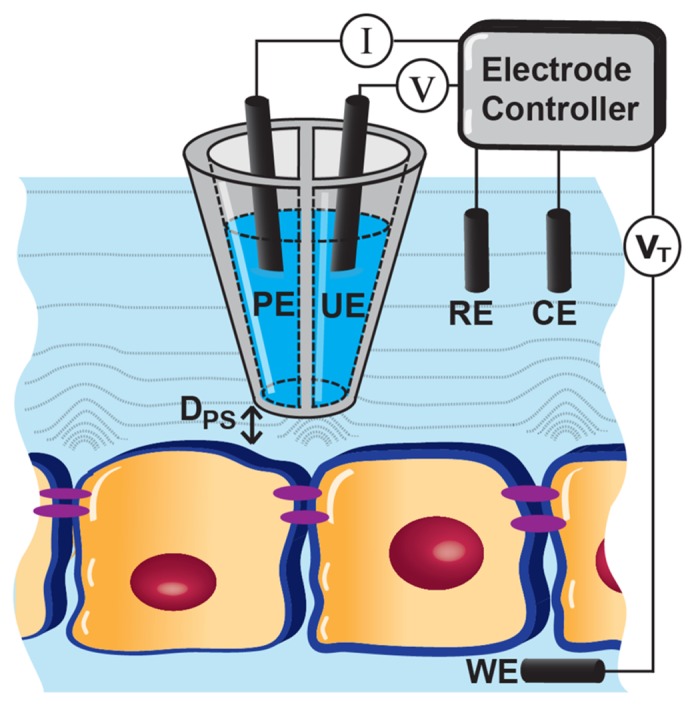
Figure 1. Schematic of Potentiometric-Scanning Ion Conductance Microscopy (P-SICM). A dual-barrel pipet is utilized to obtain topographic information and to measure local changes in transepithelial conductance related to trans- or para-cellular pathways. PE: pipet electrode; UE: potential electrode; RE: reference electrode; CE: counter electrode; WE: working electrode; DPS: Probe-substrate distance.
Biophysical Techniques for Macroscopic Epithelial Studies
Traditional transepithelial electrical resistance (TER) measurements in conjunction with molecular biology techniques are used widely to inform the present understanding of transport at tissue interfaces. These techniques, which include the well-established Ussing chamber setup, provide an excellent opportunity to study transepithelial ion transport and ion permeability.6-12 However, these measurements represent the aggregate response of thousands of transport events across the epithelium, which can obfuscate studies of unique transport processes. A number of approaches have been developed to separate components of conductance across cellular barriers.13 For instance, to allow epithelial resistance measurement independent of capacitance, one-path impedance spectroscopy was applied to differentiate capacitive components, which exist only at the epithelial cell membrane and are dependent on frequency of externally applied electric stimuli, such as transepithelial potentials.14-16 To further differentiate between trans- and paracellular resistances, a two-path impedance method has also been described, which combines impedance measurement of Ca2+ dependent tight junction opening and flux measurements with paracellular specific permeable markers.17-19 However, these impedance recordings still reflect the average response from trans- or paracellular pathways over an area that is at cm2 scale.
Conductance Scanning
Conductance scanning (also voltage scanning), employs a scanning electrode to measure local variations in current density close to a cell surface and has been applied to determine paracellular conductance. In 1972, Frömter first introduced the principle for conductance scanning, where heterogeneity in the electric field above different conductive pathways of epithelium was observed.20,21 Continuing efforts by Fromm22-30 and Cereijido,31-33 dramatically improved measurement of localized trans- and paracellular conductance over epithelia. In these recordings, one pair of electrodes was used to apply a transepithelial potential across a cell monolayer, while a second pair of electrodes was used to measure the resultant changes in electric field at discrete locations above the sample. The electric field above the cell layer was measured by the scanning electrode (microcapillary) at two depths (close to and far away from the surface),22,23,32 or by a pair of pipets mounted in fixed positions separated by 30–50 µm.13 Local conductance was then be calculated from Equation 1,23,32
| Equation 1 |
where E is the electrical field, (the potential difference measured at two discrete points relative to the vertical movement of pipet, or pipet separation distance), ρ is the bath solution resistivity and Ve is the transepithelial potential. These techniques are very useful and provide unique vistas of epithelial conductance changes, but a major technical challenge remains – more precise spatial positioning of pipets is required to improve the accuracy of recorded changes in the electrical field E. In these recordings, an optical microscope was utilized to position pipets over cell junctions or cell bodies with the help of a micromanipulator. Vertical position was determined when the pipet first touched the cell surface as a virtual zero and then manually withdrew the pipet from the surface. For these types of measurements, precision in pipet positioning was influenced highly by operator’s judgment and samples could be damaged during pipet manipulation (samples with visible damage were subsequently discarded).23
Scanning Ion Conductance Microscopy
Scanning ion conductance microscopy (SICM) is a novel technique based on scanning probe microscopy (SPM), which raster-scans non-conductive samples to record ion currents and generate topographic images. First introduced by Hansma and colleagues in 1989,34 SICM utilizes a hollow pipet with nanoscale tip dimensions as a probe to image samples. Pipets are pulled from capillaries with methods commonly used in patch-clamp studies. Through the manipulation of pulling parameters such as temperature, pull velocity, and delay, pipets with a variety of tip diameters and geometries can be fabricated. After fabrication, the pipet is filled with electrolyte and a silver/silver chloride electrode is back inserted. A potential difference is applied between the pipet electrode and a reference electrode placed in the bath electrolyte to generate an ionic current, which flows between the reference and pipet electrodes through the pipet tip opening. When the pipet is moved close to a surface, ion current changes according to the pipet-surface distance. Thus the pipet position relative to a surface can be controlled precisely with a piezo-electric positioner. This phenomenon forms the basis of current feedback regulation in SICM and allows SICM to dynamically scan surfaces in a non-invasive fashion. Ion current images can then be generated from the current measured, while the recording of vertical probe displacement generates topographic images.35
SICM is an attractive tool for biological imaging because of the high spatial resolution afforded. SICM resolution can be as low as ~10 nm vertically and ~50 nm laterally,36 but this value is highly dependent upon pipet tip geometry as well as probe-surface distance. A limiting factor in SICM resolution is pipet tip diameter, as finite element simulations have shown these two parameters are directly proportional.37 Additionally, probe-sample distance is an important consideration to achieve optimal SICM resolution. Simulations reveal the observed ion current drop over a sampling distance is a function of tip geometry, cone angle, and inner-to-outer diameter radii.38 The best recorded lateral resolution is 3–6 nm, which was achieved on S-layer proteins from Bacillus sphaericus with a 13 nm inner diameter pipet.39 An example of high resolution SICM topography image is shown in Figure 2. Here, a Madin-Darby canine kidney (MDCK) epithelial monolayer is shown. Cell bodies, cell junctions, and microvilli are clearly observed and differentiated.
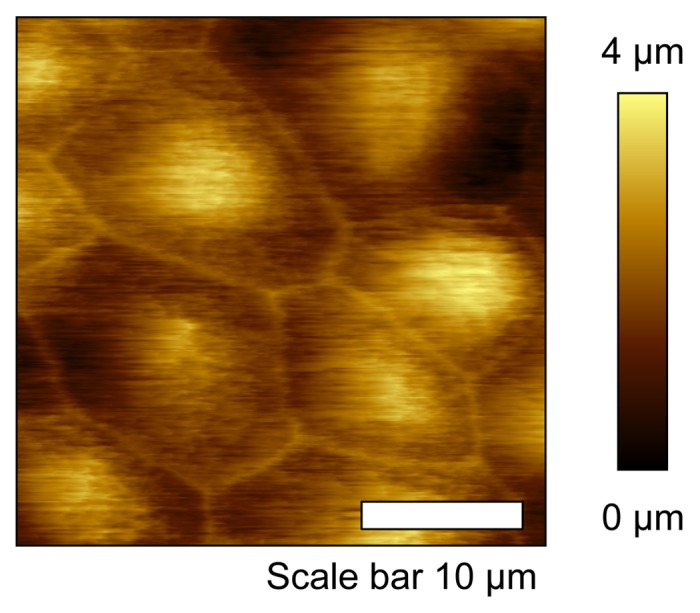
Figure 2. High resolution topographic image of Madin-Darby canine kidney epithelial cell monolayer. Cell body and cell junction are clearly identified.
In comparison to other SPM techniques, SICM has several distinct advantages for biological applications. As previously described, SICM is a non-invasive method, which generates topographic images of live cells with high fidelity and under physiological conditions. Compared with atomic force microscopy (AFM), chemical fixation of biological samples is not required in SICM, and thus deformation of cellular structures and loss of biological activity can be avoided. Unlike scanning electrochemical microscopy (SECM), SICM can image biological samples without the use of a redox mediator, which is advantageous for live cell measurement under normal physiological conditions. SICM also has a more robust feedback system than most other SPM techniques, which provides greater control over the pipet position, an important factor for conductance measurements (vide infra).35,40-43
SICM has undergone several significant modifications since 1989. A number of hybrid-SICM platforms have been described for enhanced measurements. Our group has developed 3 and 4-electrode systems specifically for measurements of biological samples..44,45 The 3-electrode system places an electrode beneath a porous substrate (e.g., membrane or tissue). This modification allows for more precise control of transmembrane potentials. The 4-electrode system adds a platinum counter electrode above the membrane. The additional electrode is beneficial for studies of biological samples with multiple conductances present on the apical surface. These modifications have paved the way for the development of P-SICM for conductance recording of tight junctions.
Potentiometric-Scanning Ion Conductance Microscopy (P-SICM)
To incorporate voltage scanning into SICM, a dual-barrel probe design was utilized (Fig. 1), where the first SICM barrel was for imaging and positioning of the pipet; the second barrel was for recording the potential variations over cell bodies or cell junctions (Fig. 1).5 In a perfusion cell culture system (e.g., Transwell) where epithelial cells grow to form a monolayer, the dual-barrel pipet is placed into the upper chamber. The current electrode (PE) in one barrel detects current passing between PE and a reference electrode (RE) for pipet positioning, serving as the conventional SICM probe to record the probe-surface distance and to obtain the topographic information of the cell membrane. The potential probe (UE) in the second barrel serves to measure localized potential differences at cell surfaces relative to the RE. Potential differences at UE are generated by a transepithelial potential (VT) between RE and a working electrode (WE, bottom chamber) over heterogeneous conductive pathways within the recorded sample.
To evaluate local conductance change with P-SICM, potential deflections at the pipet tip were measured at two fixed probe-surface distances (Dps), which was precisely controlled by a piezo-electric positioner. One position is close to the surface (0.2 μm), which is on the order of the dimension of the pipet tip (50 nm inner diameter for each barrel) and is controlled through the robust feedback signal to maintain a constant Dps (detailed SICM feedback mechanism can be found in reviews: refs. 35, 43). Here, Dps was kept constant during imaging or fixed position measurements, and can be determined experimentally through approach curves. A second position used in P-SICM is 12.5 μm above the sample, which in this case is half of the range of z-piezo movement. A longer vertical movement of the pipet probe can be achieved with the combination of piezo and Z stepper motor, but local potential variations are limited within approximately 10 μm above the cell surface. Therefore, these two positions are ideal for accurate evaluation of cell monolayer conductance and work well with the hardware capabilities of the P-SICM platform implemented here. Importantly, for measurements at these two positions, pipet feedback was turned off to avoid any convection due to pipet movement or possible crosstalk between electrodes.
As in the case of scanning conductance measurements described above, in the vicinity of cell layer, the local transepithelial conductance can be determined based on Equation 1 and be further described with the following equation:
| Equation 2 |
in which, E, the electrical field is obtained by measuring potential deflection (ΔV) induced by transepithelial potential (VT) at two probe-surface distances (Dps); Ve is the range of potential swept (Ve = 100 mV, −50 mV to +50 mV); ρ is the cell medium resistivity; and ΔZ is the vertical displacement of the pipet. To avoid the polarization in cell plasma membrane, an alternating transepithelial potential (VT) was applied, the frequency of which was determined from impedance measurement to minimize the capacitive contributions. The magnitude of the transepithelial potential was less than 50 mV to avoid cell damage and disruption of the cell membrane.23,46,47
SICM was originally designed to study soft biological samples, so pipet can be filled with a wide range of electrolytes, such as phosphate buffered saline (PBS) for cell physiological studies, or normal cell culture medium helping preserve the viability of cells.40,48 A constant distance between pipet and sample surface allows non-invasive topographic imaging of the cell apical surface. On these high-resolution topographic images, the positions of cell body and cell junction can be clearly identified. In the case where each image contains 512 pixels × 512 pixels for a scan area of 40 µm × 40 µm, the dimension of each pixel (lateral movement of pipet) is about 78 nm. At smaller scan sizes, pixel dimensions can be reduced to as small as tens of nm. When a cell junction is located from the topographic image, the pixel coordinate for that position can be obtained, which allows the pipet to be positioned at a desired location with high spatial precision. The measured conductance over each identified spot therefore correlates with the underlying membrane permeability. SICM provides a more efficient and accurate way to position the pipet, as compared with conventional diffraction-limited optical microscopy.
P-SICM Studies of MDCKII Cells
Aided by high resolution control of vertical and lateral pipet position, P-SICM allows differentiation of conductive pathways in the apical cell membrane. We have applied this novel technique to recordings of the wild type Madin-Darby Canine Kidney strain II (MDCKII-WT) cells. First, a topographic image was obtained under conventional SICM mode in absence of transepithelial potentials. The locations of cell body (CB, transcellular pathway) and cell junctions (CJ, paracellular pathway) were then pinpointed from the image to extract their spatial coordinates. The recording pipet was positioned over CB or CJ based on these coordinates to record the potential deflection (ΔV) induced by the applied transepithelial potential (VT, −50 mV to +50 mV) at two discrete probe-surface distances (0.2 µm and 12.5 µm) respectively. Multiple potential measurements were performed on three MDCKII-WT monolayers with a transepithelial electrical resistance (TER) of 113.68 ± 24.98 Ω⋅cm2 (n = 6). The recorded apparent conductance over CBs (transcellular) and CJs (paracellular) displays Gaussian distributions with averages of 2.53 ± 1.49 mS/cm2 (n = 49) and 6.20 ± 2.54 mS/cm2 (n = 62), respectively. The transcellular conductance (Gt) significantly differs from the paracellular conductance (Gp) (p < 0.001). These conductance values are very close to results from Gitter et al.,23 who measured transcellular conductance of 2.5 ± 0.5 mS/cm2 (n = 10) and paracellular conductance of 9.7 ± 1.2 mS/cm2 (n = 10) from MDCK C11 cells (a resemblance of MDCKII cells) with a TER of 83 ± 6 Ω⋅cm2 (n = 10). The Gt and Gp measured by P-SICM agree well with previously reported values without further mathematical deductions, a caveat required in other current/voltage scanning studies. These results demonstrate the ability of P-SICM to measure the heterogeneous potential distribution induced by trans- and paracellular pathways in epithelial cells, and prove the utility of P-SICM in differentiation of conductive pathways in cell membranes.
To demonstrate the ability of P-SICM in capturing paracellular conductance changes, a MDCKII cell line transfected with claudin-2 siRNA molecule (hereafter referred to as MDCKII-C2 cell) was carefully examined. In the MDCKII-C2 cells, the expression of claudin-2 (a known cation selective paracellular channel protein of tight junctions) was depressed by RNA interference.10,30 In absence of claudin-2, the TER of MDCKII-C2 increased significantly to 247.95 ± 30.35 Ω⋅cm2, as compared with MDCKII-WT (113.68 ± 24.98 Ω⋅cm2). The Gp in MDCKII-C2 cells significantly decreased to 2.63 ± 1.26 mS/cm2 (n = 78), compared with 6.20 ± 2.54 mS/cm2 (n = 62) in WT cells. The 58% decrease in paracelluar conductance was attributed to the loss of claudin-2 channels in the tight junction. Figure 3 plots apparent conductance measurements of cell junction (Gp) with P-SICM for MDCKII-WT and -C2. Notably a broader distribution and larger mean value was found in MDCKII-WT, which indicates a more heterogeneous paracellular pathway conferred by claudin-2 channels. These results not only confirmed claudin-2 as the channel protein underlying paracellular conductance, but also demonstrate the ability of P-SICM in capturing the paracellular conductance changes within the tight junction. The recorded Gt for MDCKII-C2 also decreased compared with MDCKII-WT. This small, but non-negligible decrease may be due to interference from surrounding paracellular pathways.
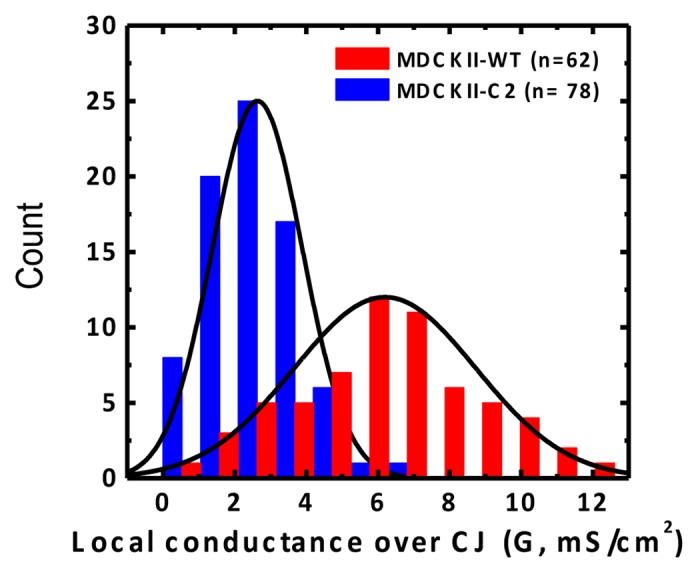
Figure 3. Histogram of the conductance recorded over cell junctions (CJs) for MDCKII-WT (red) and MDCKII-C2 (blue). Note that the conductance for MDCKII-WT displays a broader distribution and a larger mean value than MDCKII-C2. (Adapted from reference 6, with permission)
Finally, we aimed to use P-SICM to determine the ion selectivity of paracellular pathways. As reported by Yu et al.,30 claudin-2 channel are aqueous, narrow and cation selective channels. To study the ion selectivity of claudin-2 channel with P-SICM, MDCKII-WT and -C2 cells were recorded in three types of solutions: (1) a control - Ringer’s solution in both chambers; (2) a cation replacement solution - Na+ in basolateral solution substituted by isomolar N-methyl-D-glucamine (NMDG+); and (3) an anion replacement solution - Cl− in basolateral solution substituted by gluconate (Glu−). Both NMDG+ and Glu− are known to be impermeable to cell membrane and tight junctions.49-51 From the recordings of P-SICM, the only significant change after ion replacement (p < 0.001) is a 33% decrease in the paracelullar conductance of MDCKII-WT cells (with claudin-2 channels) under cation replacing conditions. In contrast, C2 cells (without claudin-2 channels) show no difference in conductance after ion replacement. The details of recorded values under ion replacing conditions were presented in Table S3.5 These results not only confirm the cation selectivity of claudin-2 channel but also extend the application of P-SICM to a broader spectrum of electrophysiological studies for tight junctions.
Limitations and Future Directions
Despite the ostensible advantages in biological recordings, there are several limitations associated with P-SICM. Although the use of a dual-barrel pipet allows pipet positioning and potential measurement to be controlled simultaneously, this design inevitably introduces a registry error in the spatial localization of recorded conductance. Although predicted to be small due to a ~50 nm separation between the two barrel tip centers, this factor must be taken into account in future recordings when spatial resolution is further improved to under 100 nm. As with most scanning probe techniques, the ultimate resolution attainable by P-SICM is largely a function of the probe employed, the feedback mechanism utilized and reductions in thermal drift. For P-SICM the geometry of the pipet tip and the probe-surface distance (Dps) represent two primary resolution-limiting factors. For experiments described above, signals recorded were localized to nominal radii on the order of 265 nm. Further, the multitude of competing conductance pathways and the use of a nonzero probe-surface distance (Dps) may result in systematic errors that arise from transcellular artifacts. Reduction of Dps and the use of smaller scanning probes are two practical approaches to improve spatial resolution. Smaller pipets are also more effective for potential measurements because a smaller Dps can be maintained, and variations in local potential are steeper at these closer working distances.
As for present study, P-SICM only makes point measurements that are then summarized to describe an average behavior of distinct pathways on cell membranes, which is time consuming and laborious. In the future, P-SICM can be modified to record potential images of the entire cell membrane under various transepithelial potentials. This improvement will allow differentiation of individual paracellular channels along the length of each tight junction structure. Tight junction dynamics is another focal point of P-SICM based research in the future. It pertains to two layers of tight junction regulation. (1) Tight junction stability. Signaling pathways such as MLCK (myosin light-chain kinase) regulate ZO-1 protein turnover within the tight junction and the transepithelial resistance in time-dependent manners.52 The recording frequency used in current study – 1Hz, although not sufficient to capture fast opening and closing events within the tight junction, has already revealed heterogeneous conductance distribution at each recording location (Fig. 3). Increasing the recording frequency, coupled with drugs such as TNF (tumor necrosis factor) to manipulate tight junction stability,53 will reveal the time constant in paracellular channel kinetics, a key measure for understanding the dynamic behavior of tight junction. (2) Tight junction interaction. Both the cis and trans interactions between claudin proteins are important for tight junction permeability.54 Previous recording approaches lack the resolution to zoom into the discrete pairs of claudin interaction. Aided by fluorophore tagged protein tracking, P-SICM can reveal permeability differences induced by local claudin interactions within a few hundred nanometers under co-expression or co-culture conditions. Because P-SICM can position the recording pipette precisely over the tight junction, it enables direct stimulation or inhibition of discrete paracellular channels by highly localized application of ions, agonists or antagonists to the tight junction via the same pipette. This approach essentially avoids unwanted secondary effects caused by systemic application of these reagents. Finally, if a certain level of automation can be applied to current P-SICM configuration, large-scale screening for paracellular channel inhibitors will be made possible. Such drugs will not only provide new treatments to many barrier diseases but also facilitate structural analyses of the paracellular channel.
Acknowledgment
This work is supported by the grants from the National Institutes of Health (NIDDK 1R21DK082990), the Research Corporation for Scientific Advancement, and the American Heart Association to L.A.B. and from the National Institutes of Health (grants R01DK084059 and P30 DK079333) and American Heart Association (grant 0930050N) to J.H.
Disclosure of Potential Conflicts of Interest
No potential conflicts of interest were disclosed.
Footnotes
Previously published online: www.landesbioscience.com/journals/tissuebarriers/article/25585
Reference
- 1.Van Itallie CM, Anderson JM. Claudins and epithelial paracellular transport. Annu Rev Physiol. 2006;68:403–29. doi: 10.1146/annurev.physiol.68.040104.131404. [DOI] [PubMed] [Google Scholar]
- 2.Tsukita S, Furuse M, Itoh M. Multifunctional strands in tight junctions. Nat Rev Mol Cell Biol. 2001;2:285–93. doi: 10.1038/35067088. [DOI] [PubMed] [Google Scholar]
- 3.Reuss L. Tight junction permeability to ions and water. In: Cereijido M, Anderson JM, eds. Tight Junctions. Boca Raton: CRC Press, 2001:61-88. [Google Scholar]
- 4.Farquhar MG, Palade GE. Junctional complexes in various epithelia. J Cell Biol. 1963;17:375–412. doi: 10.1083/jcb.17.2.375. [DOI] [PMC free article] [PubMed] [Google Scholar]
- 5.Chen C-C, Zhou Y, Morris CA, Hou J, Baker LA. Scanning ion conductance microscopy measurement of paracellular channel conductance in tight junctions. Anal Chem. 2013;85:3621–8. doi: 10.1021/ac303441n. [DOI] [PMC free article] [PubMed] [Google Scholar]
- 6.Ussing HH. The distinction by means of tracers between active transport and diffusion. Acta Physiol Scand. 1949;19:43–56. doi: 10.1111/j.1748-1716.1949.tb00633.x. [DOI] [Google Scholar]
- 7.Ussing HH, Zerahn K. Active transport of sodium as the source of electric current in the short-circuited isolated frog skin. Acta Physiol Scand. 1951;23:110–27. doi: 10.1111/j.1748-1716.1951.tb00800.x. [DOI] [PubMed] [Google Scholar]
- 8.Van Itallie C, Rahner C, Anderson JM. Regulated expression of claudin-4 decreases paracellular conductance through a selective decrease in sodium permeability. J Clin Invest. 2001;107:1319–27. doi: 10.1172/JCI12464. [DOI] [PMC free article] [PubMed] [Google Scholar]
- 9.Yu ASL, Enck AH, Lencer WI, Schneeberger EE. Claudin-8 expression in Madin-Darby canine kidney cells augments the paracellular barrier to cation permeation. J Biol Chem. 2003;278:17350–9. doi: 10.1074/jbc.M213286200. [DOI] [PubMed] [Google Scholar]
- 10.Hou J, Gomes AS, Paul DL, Goodenough DA. Study of claudin function by RNA interference. J Biol Chem. 2006;281:36117–23. doi: 10.1074/jbc.M608853200. [DOI] [PubMed] [Google Scholar]
- 11.Hou J, Renigunta A, Konrad M, Gomes AS, Schneeberger EE, Paul DL, et al. Claudin-16 and claudin-19 interact and form a cation-selective tight junction complex. J Clin Invest. 2008;118:619–28. doi: 10.1172/JCI33970. [DOI] [PMC free article] [PubMed] [Google Scholar]
- 12.Wen H, Watry DD, Marcondes MCG, Fox HS. Selective decrease in paracellular conductance of tight junctions: role of the first extracellular domain of claudin-5. Mol Cell Biol. 2004;24:8408–17. doi: 10.1128/MCB.24.19.8408-8417.2004. [DOI] [PMC free article] [PubMed] [Google Scholar]
- 13.Günzel D, Krug SM, Rosenthal R, Fromm M. Chapter 3 - biophysical methods to study tight junction permeability. In: Yu ASL, ed. Current Topics in Membranes. Waltham, MA: Academic Press, 2010:39-78. [Google Scholar]
- 14.Fromm M, Schulzke J-D, Hegel U. Epithelial and subepithelial contributions to transmural electrical resistance of intact rat jejunum, in vitro. Pflugers Arch. 1985;405:400–2. doi: 10.1007/BF00595695. [DOI] [PubMed] [Google Scholar]
- 15.Schulzke JD, Fromm M, Bentzel CJ, Zeitz M, Menge H, Riecken EO. Ion transport in the experimental short bowel syndrome of the rat. Gastroenterology. 1992;102:497–504. doi: 10.1016/0016-5085(92)90096-h. [DOI] [PubMed] [Google Scholar]
- 16.Gitter AH, Fromm M, Schulzke J-D. Impedance analysis for the determination of epithelial and subepithelial resistance in intestinal tissues. J Biochem Biophys Methods. 1998;37:35–46. doi: 10.1016/S0165-022X(98)00016-5. [DOI] [PubMed] [Google Scholar]
- 17.Amasheh S, Milatz S, Krug SM, Bergs M, Amasheh M, Schulzke J-D, et al. Na+ absorption defends from paracellular back-leakage by claudin-8 upregulation. Biochem Biophys Res Commun. 2009;378:45–50. doi: 10.1016/j.bbrc.2008.10.164. [DOI] [PubMed] [Google Scholar]
- 18.Krug SM, Fromm M, Günzel D. Two-path impedance spectroscopy for measuring paracellular and transcellular epithelial resistance. Biophys J. 2009;97:2202–11. doi: 10.1016/j.bpj.2009.08.003. [DOI] [PMC free article] [PubMed] [Google Scholar]
- 19.Krug SM, Amasheh M, Dittmann I, Christoffel I, Fromm M, Amasheh S. Sodium caprate as an enhancer of macromolecule permeation across tricellular tight junctions of intestinal cells. Biomaterials. 2013;34:275–82. doi: 10.1016/j.biomaterials.2012.09.051. [DOI] [PubMed] [Google Scholar]
- 20.Frömter E. The route of passive ion movement through the epithelium of Necturus gallbladder. J Membr Biol. 1972;8:259–301. doi: 10.1007/BF01868106. [DOI] [PubMed] [Google Scholar]
- 21.Frömter E, Diamond J. Route of passive ion permeation in epithelia. Nat New Biol. 1972;235:9–13. doi: 10.1038/newbio235009a0. [DOI] [PubMed] [Google Scholar]
- 22.Köckerling A, Sorgenfrei D, Fromm M. Electrogenic Na+ absorption of rat distal colon is confined to surface epithelium: a voltage-scanning study. Am J Physiol. 1993;264:C1285–93. doi: 10.1152/ajpcell.1993.264.5.C1285. [DOI] [PubMed] [Google Scholar]
- 23.Gitter AH, Bertog M, Schulzke JD, Fromm M. Measurement of paracellular epithelial conductivity by conductance scanning. Pflügers Arch - Eur. J Physiol. 1997;434:830–40. doi: 10.1007/s004240050472. [DOI] [PubMed] [Google Scholar]
- 24.Bendfeldt K, Gitter AH, Fromm M. Trans- and paracellular conductivity of HT-29/B6 cells measured by high-resolution conductance scanning. Ann N Y Acad Sci. 1998;859:295–9. doi: 10.1111/j.1749-6632.1998.tb11149.x. [DOI] [PubMed] [Google Scholar]
- 25.Gitter AH, Bendfeldt K, Schulzke JD, Fromm M. Paracellular, surface/crypt, and epithelial/subepithelial resistances of mammalian colonic epithelia. Pflügers Arch - Eur. J Physiol. 2000;439:477–82. doi: 10.1007/s004249900202. [DOI] [PubMed] [Google Scholar]
- 26.Florian P, Schöneberg T, Schulzke JD, Fromm M, Gitter AH. Single-cell epithelial defects close rapidly by an actinomyosin purse string mechanism with functional tight junctions. J Physiol. 2002;545:485–99. doi: 10.1113/jphysiol.2002.031161. [DOI] [PMC free article] [PubMed] [Google Scholar]
- 27.Schmitz H, Rokos K, Florian P, Gitter AH, Fromm M, Scholz P, et al. Supernatants of HIV-infected immune cells affect the barrier function of human HT-29/B6 intestinal epithelial cells. AIDS. 2002;16:983–91. doi: 10.1097/00002030-200205030-00004. [DOI] [PubMed] [Google Scholar]
- 28.Gitter AH, Wullstein F, Fromm M, Schulzke JD. Epithelial barrier defects in ulcerative colitis: characterization and quantification by electrophysiological imaging. Gastroenterology. 2001;121:1320–8. doi: 10.1053/gast.2001.29694. [DOI] [PubMed] [Google Scholar]
- 29.Heller F, Fromm A, Gitter AH, Mankertz J, Schulzke JD. Epithelial apoptosis is a prominent feature of the epithelial barrier disturbance in intestinal inflammation: effect of pro-inflammatory interleukin-13 on epithelial cell function. Mucosal Immunol. 2008;1(Suppl 1):S58–61. doi: 10.1038/mi.2008.46. [DOI] [PubMed] [Google Scholar]
- 30.Yu ASL, Cheng MH, Angelow S, Günzel D, Kanzawa SA, Schneeberger EE, et al. Molecular basis for cation selectivity in claudin-2-based paracellular pores: identification of an electrostatic interaction site. J Gen Physiol. 2009;133:111–27. doi: 10.1085/jgp.200810154. [DOI] [PMC free article] [PubMed] [Google Scholar]
- 31.Cereijido M, Stefani E, Palomo AM. Occluding junctions in a cultured transporting epithelium: structural and functional heterogeneity. J Membr Biol. 1980;53:19–32. doi: 10.1007/BF01871169. [DOI] [PubMed] [Google Scholar]
- 32.Cereijido M, Meza I, Martínez-Palomo A. Occluding junctions in cultured epithelial monolayers. Am J Physiol. 1981;240:C96–102. doi: 10.1152/ajpcell.1981.240.3.C96. [DOI] [PubMed] [Google Scholar]
- 33.Cereijido M, Stefani E, Chávez de Ramírez B. Occluding junctions of the Necturus gallbladder. J Membr Biol. 1982;70:15–25. doi: 10.1007/BF01871585. [DOI] [PubMed] [Google Scholar]
- 34.Hansma PK, Drake B, Marti O, Gould SAC, Prater CB. The scanning ion-conductance microscope. Science. 1989;243:641–3. doi: 10.1126/science.2464851. [DOI] [PubMed] [Google Scholar]
- 35.Chen C-C, Zhou Y, Baker LA. Scanning ion conductance microscopy. Annu Rev Anal Chem 2012; 5. [DOI] [PubMed] [Google Scholar]
- 36.Ying LM, Bruckbauer A, Zhou D, Gorelik J, Shevchuk A, Lab M, et al. The scanned nanopipette: a new tool for high resolution bioimaging and controlled deposition of biomolecules. Phys Chem Chem Phys. 2005;7:2859–66. doi: 10.1039/b506743j. [DOI] [PubMed] [Google Scholar]
- 37.Rheinlaender J, Schaffer TE. Image formation, resolution, and height measurement in scanning ion conductance microscopy. J Appl Phys. 2009;105:094905. doi: 10.1063/1.3122007. [DOI] [Google Scholar]
- 38.Edwards MA, Williams CG, Whitworth AL, Unwin PR. Scanning ion conductance microscopy: a model for experimentally realistic conditions and image interpretation. Anal Chem. 2009;81:4482–92. doi: 10.1021/ac900376w. [DOI] [PubMed] [Google Scholar]
- 39.Shevchuk AI, Frolenkov GI, Sánchez D, James PS, Freedman N, Lab MJ, et al. Imaging proteins in membranes of living cells by high-resolution scanning ion conductance microscopy. Angew Chem Int Ed Engl. 2006;45:2212–6. doi: 10.1002/anie.200503915. [DOI] [PubMed] [Google Scholar]
- 40.Korchev YE, Bashford CL, Milovanovic M, Vodyanoy I, Lab MJ. Scanning ion conductance microscopy of living cells. Biophys J. 1997;73:653–8. doi: 10.1016/S0006-3495(97)78100-1. [DOI] [PMC free article] [PubMed] [Google Scholar]
- 41.Shevchuk AI, Gorelik J, Harding SE, Lab MJ, Klenerman D, Korchev YE. Simultaneous measurement of Ca2+ and cellular dynamics: combined scanning ion conductance and optical microscopy to study contracting cardiac myocytes. Biophys J. 2001;81:1759–64. doi: 10.1016/S0006-3495(01)75826-2. [DOI] [PMC free article] [PubMed] [Google Scholar]
- 42.Novak P, Li C, Shevchuk AI, Stepanyan R, Caldwell M, Hughes S, et al. Nanoscale live-cell imaging using hopping probe ion conductance microscopy. Nat Methods. 2009;6:279–81. doi: 10.1038/nmeth.1306. [DOI] [PMC free article] [PubMed] [Google Scholar]
- 43.Happel P, Thatenhorst D, Dietzel ID. Scanning ion conductance microscopy for studying biological samples. Sensors (Basel) 2012;12:14983–5008. doi: 10.3390/s121114983. [DOI] [PMC free article] [PubMed] [Google Scholar]
- 44.Chen C-C, Zhou Y, Baker LA. Single-nanopore investigations with ion conductance microscopy. ACS Nano. 2011;5:8404–11. doi: 10.1021/nn203205s. [DOI] [PMC free article] [PubMed] [Google Scholar]
- 45.Zhou Y, Chen C-C, Baker LA. Heterogeneity of multiple-pore membranes investigated with ion conductance microscopy. Anal Chem. 2012;84:3003–9. doi: 10.1021/ac300257q. [DOI] [PMC free article] [PubMed] [Google Scholar]
- 46.Bindslev N, Tormey JM, Wright EM. The effects of electrical and osmotic gradients on lateral intercellular spaces and membrane conductance in a low resistance epithelium. J Membr Biol. 1974;19:357–80. doi: 10.1007/BF01869986. [DOI] [PubMed] [Google Scholar]
- 47.Reuss L, Finn A. Electrical properties of the cellular transepithelial pathway innecturus gallbladder. J Membr Biol. 1975;25:115–39. doi: 10.1007/BF01868571. [DOI] [PubMed] [Google Scholar]
- 48.Korchev YE, Raval M, Lab MJ, Gorelik J, Edwards CRW, Rayment T, et al. Hybrid scanning ion conductance and scanning near-field optical microscopy for the study of living cells. Biophys J. 2000;78:2675–9. doi: 10.1016/S0006-3495(00)76811-1. [DOI] [PMC free article] [PubMed] [Google Scholar]
- 49.Watson CJ, Rowland M, Warhurst G. Functional modeling of tight junctions in intestinal cell monolayers using polyethylene glycol oligomers. Am J Physiol Cell Physiol. 2001;281:C388–97. doi: 10.1152/ajpcell.2001.281.2.C388. [DOI] [PubMed] [Google Scholar]
- 50.Van Itallie CM, Holmes J, Bridges A, Gookin JL, Coccaro MR, Proctor W, et al. The density of small tight junction pores varies among cell types and is increased by expression of claudin-2. J Cell Sci. 2008;121:298–305. doi: 10.1242/jcs.021485. [DOI] [PubMed] [Google Scholar]
- 51.Bello-Reuss E. Electrical properties of the basolateral membrane of the straight portion of the rabbit proximal renal tubule. J Physiol. 1982;326:49–63. doi: 10.1113/jphysiol.1982.sp014176. [DOI] [PMC free article] [PubMed] [Google Scholar]
- 52.Yu D, Marchiando AM, Weber CR, Raleigh DR, Wang Y, Shen L, et al. MLCK-dependent exchange and actin binding region-dependent anchoring of ZO-1 regulate tight junction barrier function. Proc Natl Acad Sci U S A. 2010;107:8237–41. doi: 10.1073/pnas.0908869107. [DOI] [PMC free article] [PubMed] [Google Scholar]
- 53.Clayburgh DR, Musch MW, Leitges M, Fu YX, Turner JR. Coordinated epithelial NHE3 inhibition and barrier dysfunction are required for TNF-mediated diarrhea in vivo. J Clin Invest. 2006;116:2682–94. doi: 10.1172/JCI29218. [DOI] [PMC free article] [PubMed] [Google Scholar]
- 54.Piontek J, Fritzsche S, Cording J, Richter S, Hartwig J, Walter M, et al. Elucidating the principles of the molecular organization of heteropolymeric tight junction strands. Cell Mol Life Sci. 2011;68:3903–18. doi: 10.1007/s00018-011-0680-z. [DOI] [PMC free article] [PubMed] [Google Scholar]