Abstract
Background
Type 2 diabetes (T2D) and heart failure (HF) are associated with high levels of skeletal muscle (SkM) oxidative stress (OS). Health benefits attributed to flavonoids have been ascribed to antioxidation. However, for flavonoids with similar antioxidant potential, end-biological effects vary widely suggesting other mechanistic venues for reducing OS. Decreases in OS may follow the modulation of key regulatory pathways including antioxidant levels (e.g. glutathione) and enzymes such as mitochondrial superoxide dismutase (SOD2) and catalase.
Methods
We examined OS-related alterations in SkM in T2D/HF patients (as compared vs. healthy controls) and evaluated the effects of three-month treatment with (−)-epicatechin (Epi) rich cocoa (ERC). To evidence Epi as the mediator of the improved OS profile we examined the effects of pure Epi (vs. water) on SkM OS regulatory systems in a mouse model of insulin resistance and contrasted results vs. normal mice.
Results
There were severe alterations in OS regulatory systems in T2D/HF SkM as compared with healthy controls. Treatment with ERC induced recovery in glutathione levels and decreases in the nitrotyrosilation and carbonylation of proteins. With treatment, key transcriptional factors translocate into the nucleus leading to increases in SOD2 and catalase protein expression and activity levels. In insulin resistant mice, there were alterations in muscle OS and pure Epi replicated the beneficial effects of ERC found in humans.
Conclusions
Major perturbations in SkM OS can be reversed with ERC in T2D/HF patients. Epi likely mediates such effects and may provide an effective means to treat conditions associated with tissue OS.
Keywords: epicatechin, cocoa, flavanols
Introduction
The consumption of modest amounts of cocoa products is associated with ~40% reduction in cardiometabolic risk (1). Health benefits attributed to flavonoids have been mainly ascribed to direct antioxidation. Flavonoids, which are typically hydroxyl rich, are C15 compounds that comprise a very large family of plant derived secondary metabolites all of which have the structure C6-C3-C6. Examples include (−)-epicatechin and (+)-catechin. Their antioxidant potential is comparable given their very similar chemical composition and structure (2, 3). However, end-biological effects of flavonoids can vary widely, strongly suggesting other mechanistic venues (4). Recent studies have reported on major biological effects of flavonoids at concentrations that are more closely aligned with receptor activation (nanomolar) vs. levels at which direct antioxidation (micromolar) or indirect (e.g. by impacting signaling systems) effects are likely to be significant (4).
The beneficial effect of cocoa on blood pressure (5) and on blood vessel function has been ascribed to epicatechin (6). This assumption is supported by the results from bioavailability studies, which have shown that the bioavailability of catechin (7) and procyandin dimer B2 (8) is comparably low. Further procyanidins are not bioavailable and do not contribute to circulating epicatechin pool (8). It is possible that the healthy effects of cocoa products rich in Epi that have been mainly attributed to direct antioxidation may follow the modulation of the expression and/or activity of oxidative stress (OS) regulatory systems. Tissue OS levels are modulated by multiple regulatory elements comprised of antioxidants (e.g., glutathione) and enzymes (e.g., superoxide dismutase, catalase) (9-11). High levels of tissue OS can be recognized by the damage that it imposes on proteins, lipids and/or DNA. Patients suffering type 2 diabetes mellitus (T2D) or heart failure (HF) have high levels of OS, which adversely impacts function in organs such as heart, kidney, blood vessels and skeletal muscle (SkM). The coexistence of T2D and HF may further increase tissue OS (12, 13).
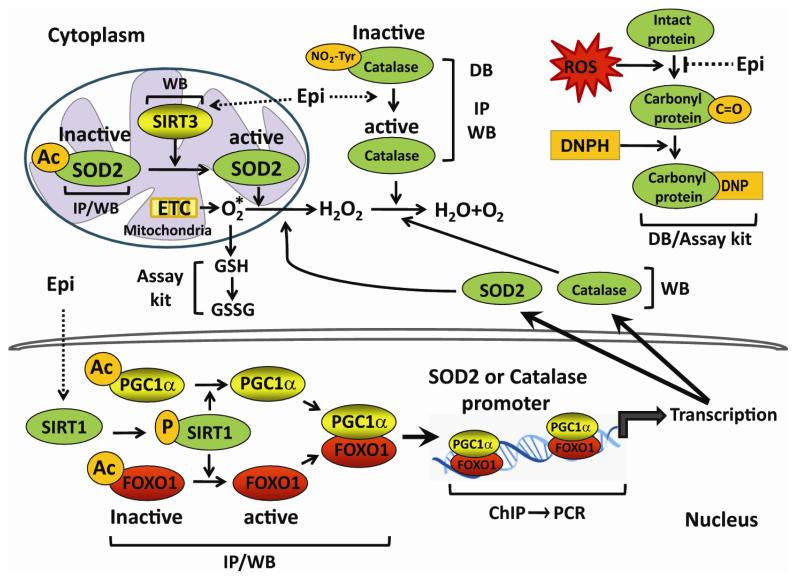
In this study, we examined the effects of Epi rich cocoa (ERC) on T2D/HF patients or pure Epi in a mouse model of obesity/insulin resistance on SkM OS regulatory systems (figure 1). The approach used, explored the effects on known regulators of tissue OS (e.g. sirtuins) and evidenced their participation in different cellular compartments including the nucleus. We document major effects of ERC or Epi treatment on key regulatory system components that translate into notable decreases in OS. The actions exerted on OS regulatory elements likely contribute to the health benefits of cocoa and prominently account for the antioxidant effects of Epi.
Figure 1. Summary of molecular events that participate in the regulation of tissue oxidative stress traced in human and/or mouse SkM samples.
This figure annotates the system and experimental approach pursued in documenting tissue oxidative stress related events in skeletal muscle. PCR = polymerase chain reaction, GSH = reduced glutathione, DB = dot blot, IP = immunoprecipitation, WB = Western blot, DNP = dinitrophenyl, DNPH = dinitrophenyl hydrazine, AC = acetyl, P = phospho, ChIP = chromatin immunoprecipitation.
Methods
Figure 1 summarizes the experimental approach used for the analysis of human and animal samples.
Clinical trial
Five patients with stable New York Heart Association stage II and III HF and T2D, were recruited from the San Diego Veterans Administration Medical Center. Clinical characteristics of the patients are summarized in table 1. All patients reported no adverse effects by treatment. Significant albeit, modest improvements were noted in HDL and a trend in BNP levels (P=0.06), while no major changes were noted in cholesterol, LDL and triglycerides. There were no statistically significant changes in body weight, blood pressure or C-reactive protein (data not shown). All patients had standard therapy for HF and T2D and were on stable medical management at least 6 months previous to the study. No significant medication changes were made during the course of the study. This pilot open label protocol involved patients consuming Hershey’s Extra Dark 60% Cacao chocolate and cocoa beverages containing 18 grams of natural cocoa powder for 3 months with a total of 100 mg (−)-Epi content/day (half in the morning and half in the afternoon) with 390 kcal and 18 grams of fat. Patients were instructed to refrain from consuming other chocolate products, supplements (e.g. vitamins) and otherwise follow a balanced, regular diet. Compliance was monitored every two weeks by telephone and by the use of written surveys. Patients underwent muscle biopsies from quadriceps femoris before and after ERC consumption. For comparison purposes, SkM biopsy samples from three healthy controls (age and sex matched) were obtained from the Medical Center using the same procedures as for patients. After collection, biopsy samples were frozen at −80°C until used. The protocol was approved by the Institutional Review Board at the University of California, San Diego and all subjects gave informed consent.
Table 1.
Characteristics of patients with HF and T2D before and after ERC treatment. Ejection fraction =EF; brain natriuretic peptide = BNP.
| Patient 1 | Patient 2 | Patient 3 | Patient 4 | Patient 5 | ||||||
|---|---|---|---|---|---|---|---|---|---|---|
| Age (y) | 70 | 71 | 54 | 62 | 47 | |||||
| HF stage | II | III | II | III | III | |||||
| EF% | 47 | 41 | 55 | 22 | 26 | |||||
| Before | After | Before | After | Before | After | Before | After | Before | After | |
| Cholesterol (mmol/l) |
4.55 | 4.86 | 3.52 | 5.3 | 5.22 | 4.14 | 4.11 | 3.54 | 4.27 | 4.09 |
| HDL (mmol/l) |
1.03 | 1.32 | 1.0 | 1.16 | 0.93 | 1.11 | 0.72 | 0.83 | 1.24 | 1.27 |
| LDL (mmol/l) |
2.25 | 2.63 | 1.71 | 2.63 | 3.39 | 2.46 | 1.66 | 0.78 | 2.46 | 2.15 |
| Triglycerides (mmol/l) |
2.74 | 1.99 | 1.76 | 3.3 | 1.99 | 1.23 | 4.11 | 4.22 | 1.22 | 1.48 |
| HbA1c | 6 | 6.2 | 6 | 6.3 | 8.9 | 7.2 | 7 | 7.6 | 6.8 | 8.3 |
| BNP (pg/ml) | 78.2 | 74.5 | 316.2 | 264.1 | 57.4 | 25.4 | 537.8 | 122.9 | 104.8 | 50 |
Animal model
As an animal model of obesity and insulin resistance, two month old C57BL/6 mice were fed ad libitum with a high fat diet (HFD) for 16 weeks (rodent chow containing 60% kcal from fat, Research Diets, Inc.). Same age (i.e. six month old) C57BL/6 wild type mice fed normal chow were used for comparison purposes. Mice were treated by gavage for 15 days with 1 mg Epi/kg of body weight as described before (14). Control mice were treated with vehicle (water). At the end of this treatment period, SkM samples of mouse quadriceps were collected after treatment and stored at −80°C until used. Each of the four groups studied included 6 animals. All animal procedures were approved by the UCSD Institutional Animal Care and Use Committee.
Measurement of reduced glutathione
SkM (25 mg) was homogenized in 300 ml of cold buffer (100 mM Tris-HCl, pH 7.8), centrifuged at 10,000 g for 15 min at 4°C. The supernatant (duplicates) was used to measure reduced glutathione using a flurometric detection assay kit (Cayman Chemicals, intra-assay coefficient of variation of 1.6%).
Protein carbonylation
SkM (50 mg) was homogenized in 500 ml of cold buffer (50 mM MES, pH 6.7, containing 1 mM EDTA). Homogenates Were centrifuged at 10,000 g for 15 min at 4°C. Supernatant was recovered and incubated at room temperature for 15 min with streptomycin sulfate at a final concentration of 1%. Samples were centrifuged at 6,000 g for 10 min at 4°C. Total protein carbonylation was measured in supernatants (duplicates) using a colorimetric protein carbonyl assay kit (Cayman Chemicals, intra-assay coefficient of variation of 4.7%) and by dot blot (as below). Dot blot assays relied on protein carbonyl functional group derivatization with 2,4-dinitrophenyldrazone (DNP) from the protein carbonyl assay kit to render stable DNP-proteins, which were detected using a specific anti-DNP antibody (Millipore).
SOD2 activity
SkM (25 mg) was homogenized using Teflon homogenizer with 300 μl sucrose buffer (0.25 M sucrose, 10 mM Tris, 1 mM EDTA, pH 7.4). The homogenate was sonicated on an ice bath for 5 min and centrifuged at 10,000 g for 60 min at 4°C. The supernatant (duplicates) was used to measure SOD2 activity using a colorimetric kit (Dojindo Molecular Technologies, intra-assay coefficient of variation of <5%) in which KCN (1 mM) was added to the sample so as to inactivate non-SOD2 activities.
Catalase activity
SkM (25 mg) was homogenized with a polytron in 250 mL of cold buffer (50mM potassium phosphate, ph 7.4 containing 1 mM EDTA), centrifuged at 10,000 g 15 min at 4°C and supernatant (duplicates) used to measure catalase activity using a colorimetric kit (Cayman Chemicals, intra-assay coefficient of variation of 3.8%).
Western blotting (WB)
Approximately, 25 mg of SkM was homogenized with a polytron in 250 mL of lysis buffer (1% triton X-100, 20 mM Tris, 140 mM NaCl, 2 mM EDTA, and 0.1% sodium dodecyl sulfate) with protease and phosphatase inhibitors, 5 mM Na3VO4, and 3 mM NaF. Homogenates were sonicated for 30 min at 4°C and centrifuged (12,000g) for 10 min at 4°C. The total protein content was measured in the supernatant using the Bradford method. A total of 40 mg of protein was loaded onto a 4-15% precast polyacrylamide gels, electrotransferred to a vinyl membrane using a semidry system. Membranes were incubated for 1 h in blocking solution (5% nonfat dry milk in tris-buffered saline [TBS] plus 0.1% Tween 20 [TBS-T]), followed by a 3 h incubation at room temperature with primary antibodies. Antibodies used included 3-nitrotyrosine, SOD2, PGC1α, TATA binding protein, (Abcam), SIRT3, GAPDH, phospho-SIRT1, S6RP (to normalize for protein loading), acetylated-lysine, catalase, FOXO1, (Cell Signaling) and SIRT1 (MitoSciences). Membranes were washed (3× for 5 min) in TBS-T and incubated 1 h at room temperature in the presence of horseradish peroxidase-conjugated secondary antibodies (Cell Signaling, Inc.) diluted 1:10,000 in blocking solution. Membranes were again washed 3× in TBS-T, and the immunoblots were developed using an Enhanced Chemiluminescence Plus detection kit (Amersham-GE). The band intensities were digitally quantified using ImageJ software (http://www.nih.gov).
Dot blot and nitrotyrosine detection
Five μL containing 10 μg of total protein extract obtained from WB homogenates were placed on a vinyl membrane and dried. The membrane was incubated 1 h at room temperature in blocking solution. For nitrotyrosine detection the membrane was incubated with 1:2000 mouse monoclonal antibody against NO2Tyr in blocking solution and developed using an enhanced chemiluminescence detection kit.
Immunoprecipitation (IP)
SkM (25 mg) was lysed with 200 mL of nondenaturing extraction buffer (0.5%, Triton X-100, 50 mmol/L Tris-HCl, pH: 7.4, 0.15 mol/L NaCl, 0.5 mmol/L EDTA) and supplemented with protease and phosphatase inhibitor cocktails plus 2 mmol/L Na3VO4, and 1mmol/L NaF. Homogenates were passed through an insulin syringe 3× and incubated on ice with shaking for 25 min and centrifuged (15 min, 4°C) at 12,000g. A total of 0.5 mg protein was precleared by adding 1 mg of normal rabbit IgG control and 20 mL protein A/G-agarose and mixed for 30 min (4°C) with subsequent centrifugation at 12,000g for 10 min at 4°C. The supernatant was recovered and incubated at 4°C under mild agitation for 3 h with 10 mL of IP antibody. Twenty microliters of protein A/G-Sepharose was added, and the mixture was incubated overnight at 4°C with shaking. The IP mixture was centrifuged at 12,000 g for 15 min at 4°C, and the supernatant was recovered and stored at 4°C for later analysis. The pellet was washed 3× with extraction buffer under shaking 15 min and centrifuged at 12,000g for 15 min at 4°C. The IP proteins in the pellet and those remaining in the supernatant were applied to a precast 4-15% sodium dodecyl sulfate–polyacrylamide gel electrophoresis for WB.
Nuclear protein extracts
Nuclear protein extracts were prepared using the nuclear protein isolation assay kit from Fivephoton Biochemicals. Approximately 10 mg of SkM was used. Nuclear protein concentration was measured by Brad ord and 40 μg of protein loaded into 4-15% precast gels and electrotransferred to nylon membranes for WB. TATA binding protein was used as a nuclear marker for these experiments (vs. GAPDH for cytoplasmic).
Chromatin immunoprecipitation (ChIP) and PCR assays
ChiP assays were performed using the Chromatin IP Kit (Agarose Beads) from Cell Signaling Co. Chromatin was subjected to IP with anti-PGC1α or anti-FOXO1 antibodies. Cross-linking was reversed and DNA was purified using MiniElute Spin Columns (QIAGEN) and used as template for PCR assays using the following primers: catalase FOXO1-Dependent Binding Element (−2160 to −1938), sense 5′-GGCTTCTGTTTGCCTTGCTCAG-3′, antisense 5′-ATACTGATACTGCGATTGTTAAGCG-3′. Primers that amplify the SOD2 promoter region containing a FOXO1-Dependent Binding Element at position -1249 to - 1033 (sense 5′-GAGTATCTATAACCTGGTCCCAGCC-3′ antisense 5′-GCTGAACCGTTTCCGTTGCTTCTTGC-3′). Amplification condition were 93°C for 15 s, 64°C for 30 s, and 72°C for 30 s for 25–30 cycles. The PCR products 222bp and 216 bp for catalase and SOD2 respectively were analyzed in 2% agarose gel electrophoresis and stained with ethidium bromide. As a negative control, a 147 bp DNA fragment of the sarcospan gene was included using the following primers sense 5′-CTAGTCAGGGACACTCCATT-3′, antisense 5′-GGCACTCAGCAGAAAGTATAA-3′).
Data and statistical analysis
For all blot images, multiple exposures were obtained to ensure that the data obtained from computer assisted image analysis was within the linear range. Paired t-tests were used for comparison of before vs. after ERC effects. For comparisons of before and after data vs. healthy controls ANOVA (and a post-hoc Tukey’s analysis) was used. Data are expressed as mean ± SD. Statistical significance was defined when P<0.05.
Results
Glutathione levels, carbonylation and nitrotyrosilation of proteins
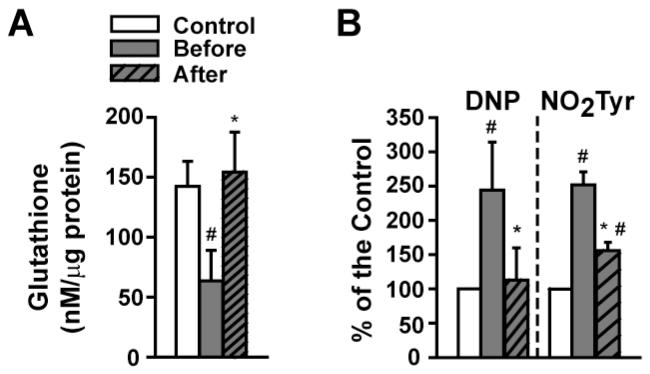
At baseline, glutathione levels were significantly reduced by ~60% in patients as compared to healthy controls and were restored with ERC (Figure 2A). As determined by dot blots, “total” carbonylation and nitrotyrosilation levels (Figure 2B) were significantly increased at baseline and were normalized (carbonylation) or significantly reduced (nitrotyrosilation) by ERC.
Figure 2. Modulation of SkM oxidative stress markers by ERC in T2D/HF patients before and after treatment.
(A) Changes in glutathione levels vs. control. (B) Summary of changes observed in carbonylation (DNP) and nitrotyrosine residue formation (NO2Tyr) vs. control. (Control n=3, patients n=4, *p<0.05 vs. before, # vs. control).
SIRT3 and SOD2
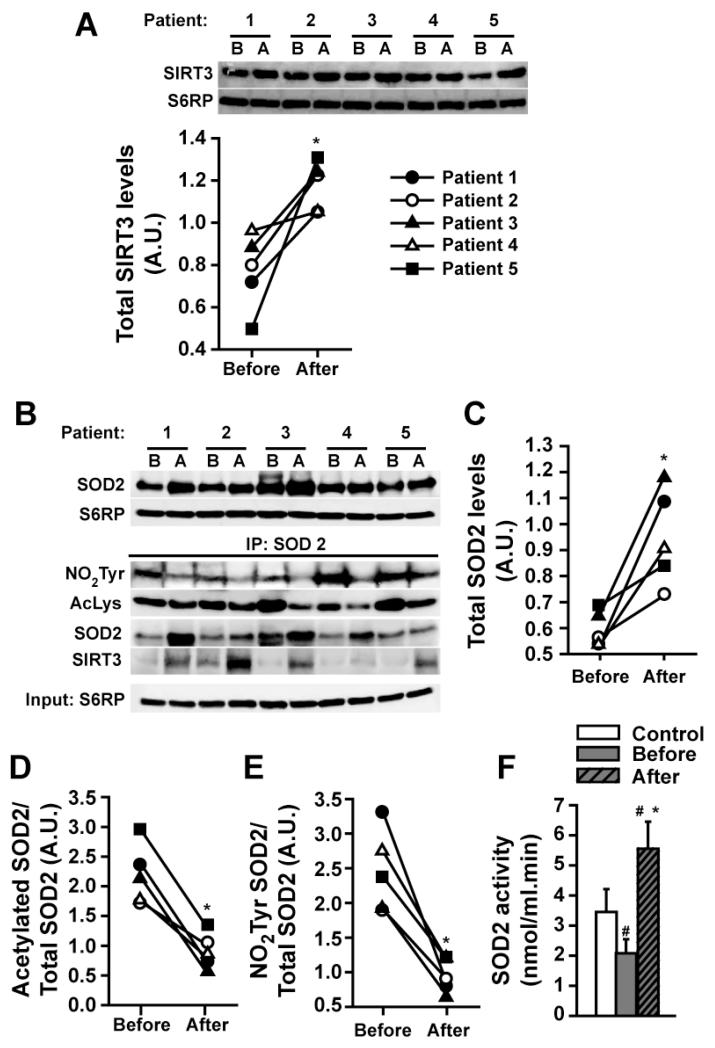
We evaluated the effect that ERC had on SIRT3 protein levels as determined by WB. Results demonstrate a significant increase with treatment (Figure 3A). The use of ERC also significantly stimulated protein levels of SOD2 (Figure 3B upper panel and 3C). IP using a SOD2 antibody and immunoblotting against NO2Tyr, acetylated lysines and SIRT3 (Figure 3B, lower panel) revealed an increased association between SIRT3 and SOD2 as well as significant reductions in SOD2 nitrotyrosilation and acetylation levels with ERC (Figures 3B-E) (all densitometric values were normalized by S6RP). The levels of SOD2 activity were significantly reduced at baseline. ERC significantly increased SOD2 activity to levels higher than baseline and healthy controls (Figure 3F).
Figure 3. Modulation of SkM SOD2 and SIRT3 by ERC in T2D/HF patients before (B) and after (A) treatment.
(A) Changes detected in SIRT3 protein levels as observed by Westerns (normalized with S6RP levels). (B, upper panel) Changes in total SOD2 levels as observed by Westerns and, (C) their quantification. (B, bottom panel) Changes in SIRT3 protein levels following SOD2 based IP and their complexing to SOD2. (D) Decreases observed in SOD2 acetylation and, (E) nitrotyrosine residue formation. (F) Changes observed in SOD2 activity levels vs. control. (Control n=3, patients n=5, *p<0.05 vs. before, # vs. control).
Catalase
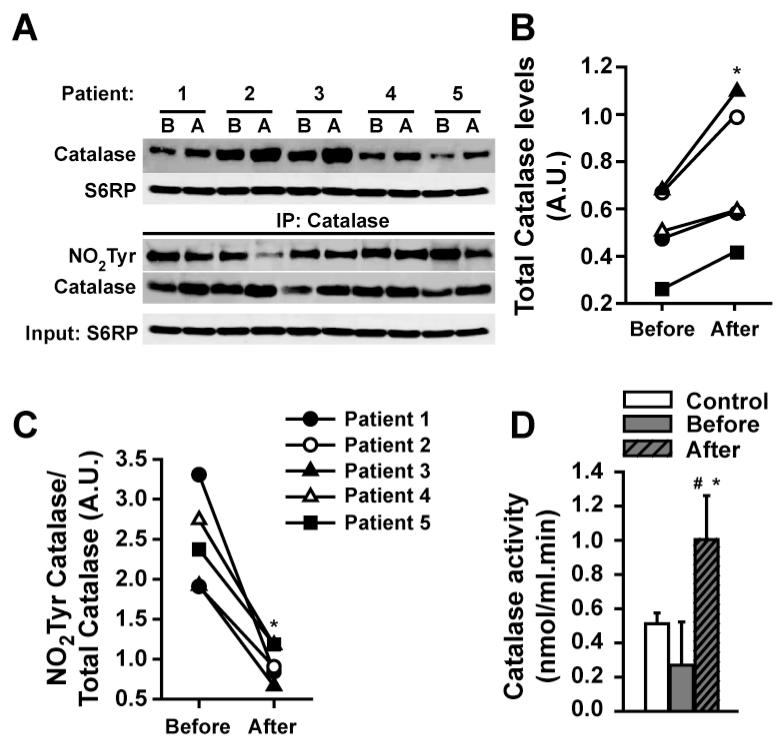
With ERC, catalase protein abundance was significantly increased vs. baseline (Figures 4A upper panel, 4B). Following catalase IP (Figure 4A, lower panel) immunoblotting demonstrated decreased nitrotyrosilation relative to total catalase levels (Figure 4C) (all densitometric values were normalized by S6RP). These changes were associated with significant increases in catalase activity to levels above baseline and healthy controls (Figure 4D).
Figure 4. Modulation of SkM catalase by ERC in T2D/HF patients before (B) and after (A) treatment.
(A, upper panel) Changes observed in total catalase protein levels and, (B) their quantification. (A, bottom panel) Following catalase based IP, changes in nitrotyrosine (NO2Tyr) residue formation. (C) Changes in the ratio of nitrotyrosilation/total catalase levels. (D) Changes observed in catalase activity levels vs. control. (Control n=3, patients n=5, *p<0.05 vs. before, # vs. control).
Changes in SIRT1, FOXO1 and PGC1α
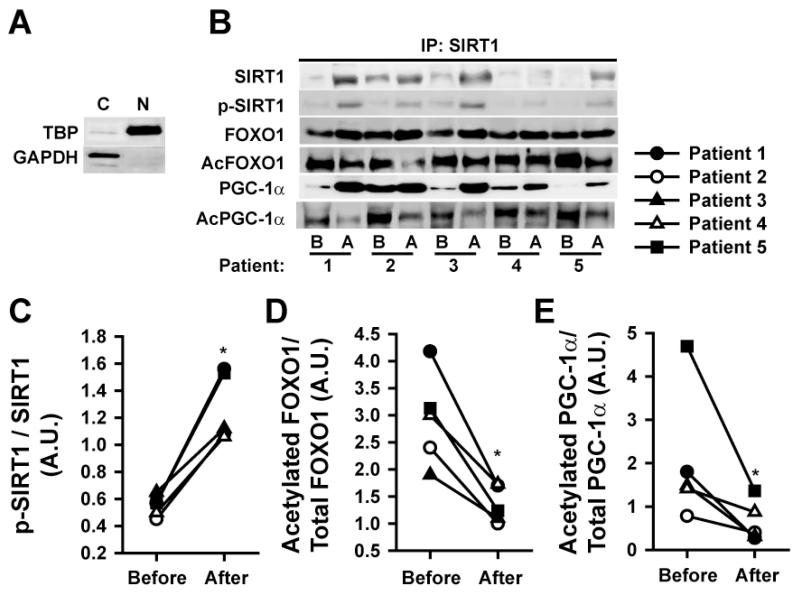
Following IP with a SIRT1 antibody we evaluated the association of SIRT1, FOXO1 and PGC1α in SkM nuclei The relative purity of SkM subcellular shown in Figure 5A. Nuclear raction “purity” was ascertained by high levels of TATA binding protein relative to GAPDH. ERC induced increases in nuclear protein levels of the total and active form of SIRT1 (p-SIRT1) (Figures 5B/C) and FOXO1 while reducing its acetylation (Figure 5B/D). A similar pattern of changes was observed for total and acetylated PGC1α (Figure 5B/E).
Figure 5. Modulation of nuclear events associated with SOD2 and catalase by ERC before (B) and after (A) treatment.
(A) Western blot images illustrating the purification of nuclear vs. cytoplasmic material as judged from the blotting with a TATA binding protein (TBP) or GAPDH antibodies. (B) Secondary to IP with an SIRT1 antibody, changes in SIRT1, phospho-SIRT1, FOXO1, acetylated (Ac) FOXO1, PGC1α, Ac-PGC1α. (C) Changes observed in the ratio of phospho-SIRT1 to total SIRT1 protein levels. (D) Changes observed in the ratio of acetylated/total FOXO1 levels. (E) Changes observed in the ratio of acetylated/total PGC1α levels. (n=5, *p<0.05 vs. before).
SOD2 and catalase promoter associated complexes
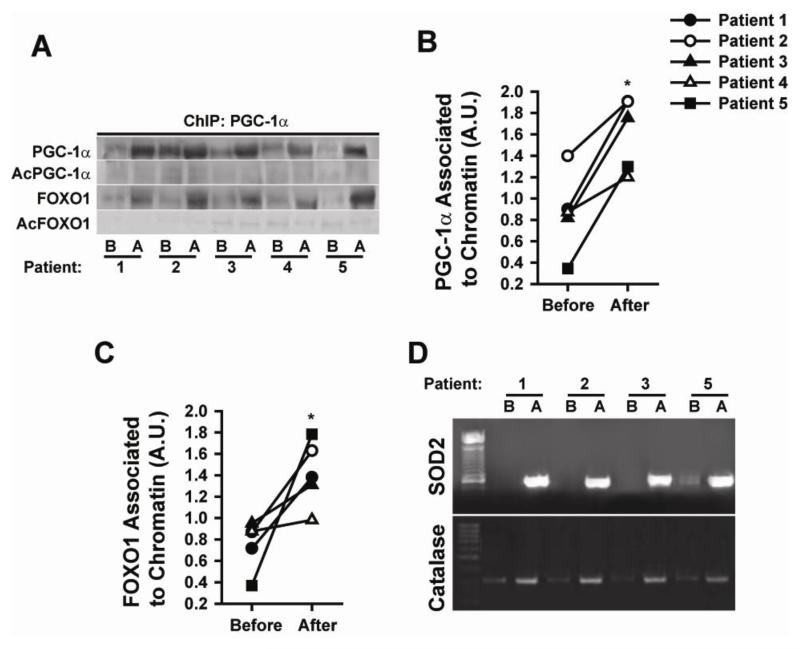
A ChIP assay was used to evidence chromatin associated proteins in SkM. ERC enhanced the association of PGC1α and FOXO1 with chromatin (Figures 6 A-C). Results show the enhanced association of deacetylated active forms of FOXO1 to PGC1α (Figure 6A). PCR amplification of purified DNA fragments from the ChIP assay was also performed. ERC notably enhanced the binding of FOXO1 and PGC1α to the SOD2 and catalase promoters (Figure 6D) (due to sample shortage this analysis was performed only in 4/5 patient samples) suggesting an increase in their transcriptional activity. PCR demonstrated no amplification of the sarcospan sequence (used as a negative control, data not shown).
Figure 6. Modulation of nuclear events associated with SOD2 and catalase promoters by ERC before (B) and after (A) treatment.
(A) Changes observed in PGC1α, acetylated (Ac) PGC1α FOXO1 and Ac-FOXO1 levels following chromatin IP with a PGC1α antibody. (B) Changes observed in chromatin associated PGC1α levels. (C) Changes observed in chromatin associated FOXO1 (n=5, *p<0.05 vs. before). (D) PCR generated evidence as to the binding of the above stated transcription factors to the SOD2 and catalase promoters as documented by gel electrophoresis (n=4).
Animal models
Changes in glutation levels, carbonylation and nitrotyrosilation of proteins
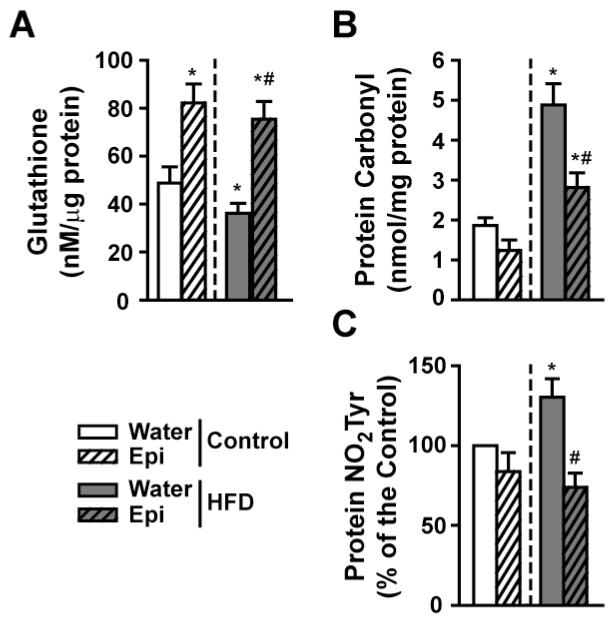
To determine if Epi represents the active component of ERC, we compared the response of HFD mice to treatment and contrast results vs. controls. HFD mice yielded reduced SkM glutathione levels below those of controls. Significant increases were noted in control and HFD groups treated with Epi (Figure 7A). Figure 7B summarizes changes in SkM protein carbonylation levels, which increased in HFD animals and were significantly reduced in control and HFD groups with Epi. Changes in protein nitrotyrosilation levels as determined by dot blots are plotted in figure 7C. Results indicate that HFD increased nitrotyrosilation levels and Epi significantly reduced them.
Figure 7. Modulation of SkM oxidative stress regulatory systems by Epi in 6 month old normal and HFD mice with Epi treatment.
(A) Changes observed in glutathione levels. (B) Changes observed in total protein carbonylation levels. (C) Differences observed in protein nitrotyrosine (NO2Tyr) residue formation. (n=6/group, *p<0.05 vs. water control, # vs. water-HFD).
Epicatechin-induced changes in SOD acetylation and activity levels
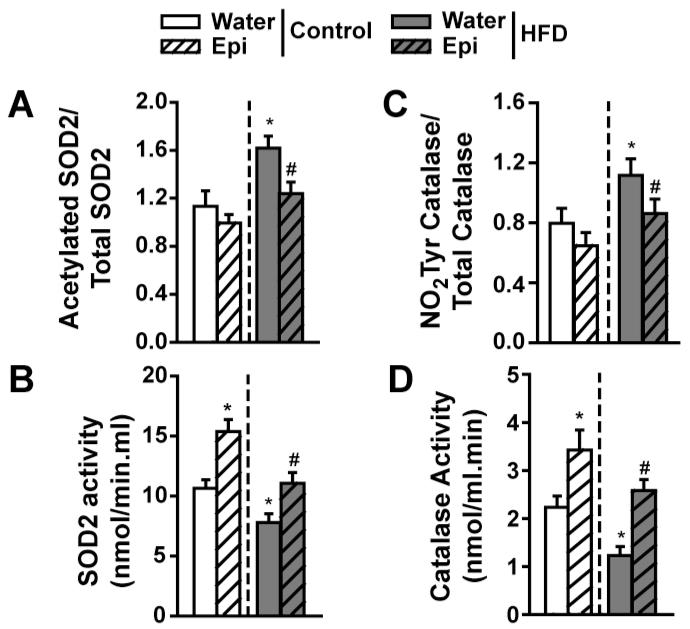
Results indicate that HFD leads to an increase in the ratio of acetylated/total SOD2 and Epi is able to restore to normal levels (Figure 8A). As a consequence of these changes, SOD2 activity was significantly suppressed in HFD animals. Epi induced increases in control animals, while normalizing activity in HFD mice (Figure 8B).
Figure 8. Modulation of SkM SOD2 and catalase in 6 month old normal and HFD mice with Epi treatment.
(A) Differences observed in acetylated/total SOD2 protein levels. (B) Changes observed in SOD2 activity. (C) Differences observed in catalase nitrotyrosine residue (NO2Tyr) formation. (D) Differences observed in catalase activity levels. (n=6/group, *p<0.05 vs. water control, # vs. water-HFD).
Epicatechin-induced changes in catalase nitrotyrosilation and activity levels
Results demonstrated increases in the ratio of nitrotyrosilation/total catalase in HFD animals and normalization with Epi (Figure 8C). Catalase activity levels followed the same pattern as noted for SOD2 (Figure 8D).
Discussion
Alterations in mitochondrial function can lead to increases in the production or “leakage” of reactive oxygen species (ROS) particularly superoxide anion. Sustained increases in ROS can overwhelm SOD and catalase levels or block their activity, leading to OS and, in consequence to tissue damage. We previously reported evidence for severe detrimental changes in SkM mitochondria structure in T2D/HF patients (15). We also demonstrated that 3 months treatment with ERC led to notable improvements in SkM mitochondrial cristae abundance and indicators of biogenesis. We hypothesized that the recovery of mitochondrial structure observed with treatment in T2D/HF patients would lead to decreases in SkM oxidative stress.
A depletion of glutathione has been documented in T2D and HF SkM (16). Increases in SkM glutathione can be triggered in T2D patients with thiazolidinedione treatment and this is coupled with improved muscle function (17). In HF patients, the use of AT1 receptor blockers (by blocking NADPH-oxidases) can increase glutathione and this may, partly explain their beneficial effects (18). Figure 2 results demonstrate that at baseline, SkM glutathione levels were reduced by ~60% in T2D/HF patients and were restored to control levels with ERC. To our knowledge, this is the first study documenting, in human SkM, this type of response to flavonoids. However, in a rodent model of liver injury or in cultured HepG2 and Caco-2 cells, cocoa extracts can preserve glutathione levels (19-21). We have also demonstrated the preservation of glutathione levels by Epi in ischemic myocardium (22).
Excess levels of carbonylation and nitrotyrosilation have been documented in SkM of T2D and HF patients (23). Drugs used to treat T2D patients such as metformin, have been associated with reductions in in this type of deleterious amino-acid residue modification (24). Figure 2 results show that protein carbonylation and nitrotyrosilation levels were significantly increased at baseline (vs. controls) and were normalized (carbonylation) or significantly reduced (nitrotyrosilation) by ERC. Whereas no studies have reported on the effects of cocoa on similar endpoints in human tissues, flavonoid supplementation reduces protein carbonyls in the blood of subjects undergoing intense exercise (25).
An early ROS molecule (from the multiple types generated) whose excess can lead to OS is superoxide (O2 *−). Important pathways that modulate its excess include SOD, which generate hydrogen peroxide, as well as catalase, which convert hydrogen peroxide into water and molecular oxygen (9, 10). Reductions in the activity of these enzymes are known to be detrimental to organ function (26). Conversely, transgenic approaches have demonstrated that their upregulation can be protective (27). SIRT3 is an enzyme that positively regulates mitochondrial SOD2 activity via its deacetylation. So far, only endurance exercise training in old, sedentary subjects has reported to stimulate SkM SIRT3 protein levels (28). Figure 3 results demonstrate that ERC stimulates increases in SIRT3 and SOD2 protein levels and their physical association. Secondary to this enhanced association; significant reductions in SOD2 acetylation and nitrotyrosilation were observed, leading to enhanced enzymatic activity. Of interest is that increases in SOD activity also decrease the chance of O2 *− to react with high levels of nitric oxide as observed with T2D and HF to yield excess peroxinitrite and therefore, excess nitrotyrosilation. ERC also induced significant increases in catalase protein levels and a decrease in nitrotyrosilation leading to increases in catalase activity (figure 4). In spite of many studies reporting on the apparent antioxidant effects of cocoa products in humans, most only report on blood markers with no specific reference to actions on SOD or catalase (29). However, in rats, it has been reported that cocoa intake stimulates thymus SOD and catalase activity (30).
There are several important regulators of SOD2 and catalase transcription that include amongst others, the deacetylase SIRT1, FOXO1 and PGC1α When in an “inactive” state the regulators dephosphorylated SIRT1, acetylated FOXO1 and PGC1α are localized mainly in cytoplasm. Upon stimulation, these regulators translocate into the nucleus, SIRT1 becomes phosphorylated and deacetylates FOXO1 and PGC1α, which then form an “active” complex (31). This complex can then bind to the promoter region of DNA and activate the transcription of genes such as SOD2 and catalase. The documentation of such events (figure 5, 6) would identify the mechanisms underlying ERC effects. With ERC treatment, the relative levels of nuclear total SIRT1 and its active form phospho-SIRT1 increased. The total levels of FOXO1 protein increased while its inactive acetylated form decreased, and a similar pattern of changes was observed for PGC1α. Thus, ERC is capable of stimulating the nuclear translocation and activation of known transcriptional modulators of SOD2 and catalase.
To further document the functionality of this complex, the verification of its association with DNA promoter regions was necessary. ChIP assay results (figure 6) demonstrate that there is an enhanced association of PGC1α and FOXO1 to chromatin after treatment with ERC. As per PCR results, ERC increased the binding of the transcription factors to the SOD2 and catalase promoters, an event that likely explains increases in protein levels. There is precedent for studies that have examined the capacity of flavonoids to alter the transcription of genes involved in OS regulatory systems (32, 33). However, these studies have mostly relied on the use of indirect reporter systems.
To our knowledge this is the first time that a systematic documentation of mechanistic events is pursued in human SkM so as to explain the modulation of OS regulatory systems by an intervention such as ERC. Only one similar study has been performed in HF patients where the effects of exercise were examined (34). Six months of exercise training increases SkM catalase activity (while not altering mRNA or protein levels) and reduces lipid peroxidation and nitrotyrosine residue formation while no changes in SODs were observed (34).
As cocoa products contain many components, which can influence the above measured endpoints, an animal model of obesity and insulin resistance was used to examine the unique effects of Epi on representative OS related endpoints. HFD reduced SkM glutathione levels below those of controls (figure 7). Significant increases were detected in control and HFD groups treated with Epi. Protein carbonylation levels increased in HFD animals and were reduced with Epi treatment. Changes in protein nitrotyrosilation indicate that a HFD increased their levels and Epi significantly reduced them. HFD also leads to an increase in the ratio of acetylated/total SOD2 and normalization with Epi with parallel changes in SOD2 activity (figure 8). Comparable observations were noted for catalase. Altogether, results derived from animal studies strongly suggest that Epi can be ascribed as a likely major mediator of effects in ERC treated patients. Our results are in general agreement with those published by Si et al, where the use of Epi led to beneficial effects in diabetic (db/db) mouse SkM contractile function, liver fat deposition, glutathione levels and SOD activity (35).
the use of compounds with antioxidant properties typically given at “high” doses such as vitamins, has largely failed to mitigate disease progression. Furthermore, the putative beneficial effects of antioxidants on SkM function and thus, improved exercise performance, have not been completely established and the results are contradictory (36) Therefore ore “direct” antioxidation (i.e. ROS scavenging) as a means to improve organ function remains at best, unproven. Flavonoids (which act as ROS scavengers) reduce tissue OS and are known to yield healthy effects. However, at low doses direct antioxidation does not appear to explain these effects. The body of mechanistic results in human SkM obtained in this study, and validated by investigations in animals, indicates that effective reductions in SkM OS follow the modulation of key regulatory systems by Epi.
Limitations
of this pilot study include the lack of measurements of Epi levels in muscle, small number of subjects studied and the absence of proper controls (including HF or T2D only patients). Nonetheless, given the consistency and magnitude of “recovery” effects exerted by ERC in all patients, results suggest a unique potential to improve muscle metabolism. However, we cannot rule out the possibility that other cocoa bioactive agents may have played a role in the responses observed.
In conclusion, the use of ERC or Epi appears to modify tissue OS in a manner consistent (given the doses used) with the modulation of relevant regulatory systems. Thus, ERC or Epi deserve consideration as potential effective modulators of tissue OS to be evaluated in future controlled clinical trials for diseases where metabolic dysregulation represents an underlying mechanism.
Acknowledgment of grant support
This study was supported by NIH AT4277, HL43617, P60-MD000220, DK92154 and grants from the Medical Research Service, Department of Veterans Affairs, VA San Diego Healthcare System and an unrestricted gift from Cardero Therapeutics Inc.
Dr. Taub was supported by an American College of Cardiology/Merck Fellowship. The Hershey Company and Cardero Therapeutics provided unrestricted gift funds for the clinical component of this study.
Abbreviations
- T2D
Type 2 diabetes
- HF
Heart failure
- SkM
Skeletal muscle
- OS
Oxidative stress
- SOD2
Superoxide dismutase-2
- Epi
(−)-epicatechin
- ERC
(−)-epicatechin rich cocoa
- HFD
High fat diet
- DNP
2,4-dinitrophenyldrazone
- WB
Western blotting
- PGC1α
Peroxisome proliferator-activated receptor gamma, coactivator 1-α
- SIRT
Sirtuin
- GAPDH
Glyceraldehyde 3-phosphate dehydrogenase
- S6RP
S6 ribosomal protein
- FOXO1
Forkhead box protein O1
- IP
Immunoprecipitation
- ROS
Reactive oxygen species
Footnotes
Publisher's Disclaimer: This is a PDF file of an unedited manuscript that has been accepted for publication. As a service to our customers we are providing this early version of the manuscript. The manuscript will undergo copyediting, typesetting, and review of the resulting proof before it is published in its final citable form. Please note that during the production process errors may be discovered which could affect the content, and all legal disclaimers that apply to the journal pertain.
Conflicts of interest: none
Disclosure Summary: The authors have nothing to disclose.
References
- 1.Buitrago-Lopez A, Sanderson J, Johnson L, Warnakula S, Wood A, Di Angelantonio E, et al. Chocolate consumption and cardiometabolic disorders: systematic review and meta-analysis. BMJ. 2011;343:d4488. doi: 10.1136/bmj.d4488. [DOI] [PMC free article] [PubMed] [Google Scholar]
- 2.Yang B, Kotani A, Arai K, Kusu F. Relationship of electrochemical oxidation of catechins on their antioxidant activity in microsomal lipid peroxidation. Chem Pharm Bull (Tokyo) 2001 Jun;49(6):747–51. doi: 10.1248/cpb.49.747. [DOI] [PubMed] [Google Scholar]
- 3.Ruzic I, Skerget M, Knez Z. Potential of Phenolic Antioxidants. Acta Chimica Slovenica. 2010;57(2):263–71. [PubMed] [Google Scholar]
- 4.Lotito SB, Frei B. Consumption of flavonoid-rich foods and increased plasma antioxidant capacity in humans: cause, consequence, or epiphenomenon? Free Radic Biol Med. 2006 Dec 15;41(12):1727–46. doi: 10.1016/j.freeradbiomed.2006.04.033. [DOI] [PubMed] [Google Scholar]
- 5.Ellinger S, Reusch A, Stehle P, Helfrich HP. Epicatechin ingested via cocoa products reduces blood pressure in humans: a nonlinear regression model with a Bayesian approach. Am J Clin Nutr. 2012 Jun;95(6):1365–77. doi: 10.3945/ajcn.111.029330. [DOI] [PubMed] [Google Scholar]
- 6.Schroeter H, Heiss C, Balzer J, Kleinbongard P, Keen CL, Hollenberg NK, et al. (−)-Epicatechin mediates beneficial effects of flavanol-rich cocoa on vascular function in humans. Proc Natl Acad Sci U S A. 2006 Jan 24;103(4):1024–9. doi: 10.1073/pnas.0510168103. [DOI] [PMC free article] [PubMed] [Google Scholar]
- 7.Ottaviani JI, Momma TY, Heiss C, Kwik-Uribe C, Schroeter H, Keen CL. The stereochemical configuration of flavanols influences the level and metabolism of flavanols in humans and their biological activity in vivo. Free Radic Biol Med. 2011 Jan 15;50(2):237–44. doi: 10.1016/j.freeradbiomed.2010.11.005. [DOI] [PubMed] [Google Scholar]
- 8.Ottaviani JI, Kwik-Uribe C, Keen CL, Schroeter H. Intake of dietary procyanidins does not contribute to the pool of circulating flavanols in humans. Am J Clin Nutr. 2012 Apr;95(4):851–8. doi: 10.3945/ajcn.111.028340. [DOI] [PubMed] [Google Scholar]
- 9.Droge W. Free radicals in the physiological control of cell function. Physiological Reviews. 2002 Jan;82(1):47–95. doi: 10.1152/physrev.00018.2001. [DOI] [PubMed] [Google Scholar]
- 10.Bashan N, Kovsan J, Kachko I, Ovadia H, Rudich A. Positive and Negative Regulation of Insulin Signaling by Reactive Oxygen and Nitrogen Species. Physiological Reviews. 2009 Jan;89(1):27–71. doi: 10.1152/physrev.00014.2008. [DOI] [PubMed] [Google Scholar]
- 11.Martin MA, Serrano AB, Ramos S, Pulido MI, Bravo L, Goya L. Cocoa flavonoids up-regulate antioxidant enzyme activity via the ERK1/2 pathway to protect against oxidative stress-induced apoptosis in HepG2 cells. J Nutr Biochem. 2009 Mar;21(3):196–205. doi: 10.1016/j.jnutbio.2008.10.009. [DOI] [PubMed] [Google Scholar]
- 12.Smith HM, Hamblin M, Hill MF. Greater propensity of diabetic myocardium for oxidative stress after myocardial infarction is associated with the development of heart failure. J Mol Cell Cardiol. 2005 Oct;39(4):657–65. doi: 10.1016/j.yjmcc.2005.07.004. [DOI] [PubMed] [Google Scholar]
- 13.Hayashi T, Mori T, Yamashita C, Miyamura M. Regulation of oxidative stress and cardioprotection in diabetes mellitus. Curr Cardiol Rev. 2008 Nov;4(4):251–8. doi: 10.2174/157340308786349426. [DOI] [PMC free article] [PubMed] [Google Scholar]
- 14.Nogueira L, Ramirez-Sanchez I, Perkins GA, Murphy A, Taub PR, Ceballos G, et al. (−)-Epicatechin enhances fatigue resistance and oxidative capacity in mouse muscle. J Physiol. 2011 Sep 15;589(Pt 18):4615–31. doi: 10.1113/jphysiol.2011.209924. [DOI] [PMC free article] [PubMed] [Google Scholar]
- 15.Taub PR, Ramirez-Sanchez I, Ciaraldi TP, Perkins G, Murphy AN, Naviaux R, et al. Alterations in skeletal muscle indicators of mitochondrial structure and biogenesis in patients with type 2 diabetes and heart failure: effects of epicatechin rich cocoa. Clin Transl Sci. 2012 Feb;5(1):43–7. doi: 10.1111/j.1752-8062.2011.00357.x. [DOI] [PMC free article] [PubMed] [Google Scholar]
- 16.Boudina S, Abel ED. Diabetic cardiomyopathy revisited. Circulation. 2007 Jun 26;115(25):3213–23. doi: 10.1161/CIRCULATIONAHA.106.679597. [DOI] [PubMed] [Google Scholar]
- 17.Lazich I, Sarafidis P, de Guzman E, Patel A, Oliva R, Bakris G. Effects of combining simvastatin with rosiglitazone on inflammation, oxidant stress and ambulatory blood pressure in patients with the metabolic syndrome: the SIROCO study. Diabetes Obes Metab. 2012 Feb;14(2):181–6. doi: 10.1111/j.1463-1326.2011.01510.x. [DOI] [PubMed] [Google Scholar]
- 18.Desideri G, Bravi MC, Tucci M, Croce G, Marinucci MC, Santucci A, et al. Angiotensin II inhibits endothelial cell motility through an AT1-dependent oxidant-sensitive decrement of nitric oxide availability. Arterioscler Thromb Vasc Biol. 2003 Jul 1;23(7):1218–23. doi: 10.1161/01.ATV.0000078521.51319.65. [DOI] [PubMed] [Google Scholar]
- 19.Granado-Serrano AB, Martin MA, Bravo L, Goya L, Ramos S. A diet rich in cocoa attenuates N-nitrosodiethylamine-induced liver injury in rats. Food Chem Toxicol. 2009 Oct;47(10):2499–506. doi: 10.1016/j.fct.2009.07.007. [DOI] [PubMed] [Google Scholar]
- 20.Martin MA, Ramos S, Mateos R, Granado Serrano AB, Izquierdo-Pulido M, Bravo L, et al. Protection of human HepG2 cells against oxidative stress by cocoa phenolic extract. J Agric Food Chem. 2008 Sep 10;56(17):7765–72. doi: 10.1021/jf801744r. [DOI] [PubMed] [Google Scholar]
- 21.Rodriguez-Ramiro I, Ramos S, Bravo L, Goya L, Martin MA. Procyanidin B2 and a cocoa polyphenolic extract inhibit acrylamide-induced apoptosis in human Caco-2 cells by preventing oxidative stress and activation of JNK pathway. J Nutr Biochem. 2011 Dec;22(12):1186–94. doi: 10.1016/j.jnutbio.2010.10.005. [DOI] [PubMed] [Google Scholar]
- 22.Yamazaki KG, Romero-Perez D, Barraza-Hidalgo M, Cruz M, Rivas M, Cortez-Gomez B, et al. Short- and long-term effects of (−)-epicatechin on myocardial ischemia-reperfusion injury. Am J Physiol Heart Circ Physiol. 2008 Aug;295(2):H761–7. doi: 10.1152/ajpheart.00413.2008. [DOI] [PMC free article] [PubMed] [Google Scholar]
- 23.Fedorova M, Kuleva N, Hoffmann R. Identification, Quantification, and Functional Aspects of Skeletal Muscle Protein-Carbonylation in Vivo during Acute Oxidative Stress. Journal of Proteome Research. 2010 May;9(5):2516–26. doi: 10.1021/pr901182r. [DOI] [PubMed] [Google Scholar]
- 24.Meaney E, Vela A, Samaniego V, Meaney A, Asbun J, Zempoalteca JC, et al. Metformin, arterial function, intima-media thickness and nitroxidation in metabolic syndrome: the mefisto study. Clin Exp Pharmacol Physiol. 2008 Aug;35(8):895–903. doi: 10.1111/j.1440-1681.2008.04920.x. [DOI] [PubMed] [Google Scholar]
- 25.Bowtell JL, Sumners DP, Dyer A, Fox P, Mileva KN. Montmorency cherry juice reduces muscle damage caused by intensive strength exercise. Med Sci Sports Exerc. 2011 Aug;43(8):1544–51. doi: 10.1249/MSS.0b013e31820e5adc. [DOI] [PubMed] [Google Scholar]
- 26.Haskins K, Kench J, Powers K, Bradley B, Pugazhenthi S, Reusch J, et al. Role for oxidative stress in the regeneration of islet beta cells? J Investig Med. 2004 Jan;52(1):45–9. doi: 10.1136/jim-52-01-25. [DOI] [PubMed] [Google Scholar]
- 27.Giacco F, Brownlee M. Oxidative stress and diabetic complications. Circ Res. 2010 Oct 29;107(9):1058–70. doi: 10.1161/CIRCRESAHA.110.223545. [DOI] [PMC free article] [PubMed] [Google Scholar]
- 28.Lanza IR, Short DK, Short KR, Raghavakaimal S, Basu R, Joyner MJ, et al. Endurance exercise as a countermeasure for aging. Diabetes. 2008 Nov;57(11):2933–42. doi: 10.2337/db08-0349. [DOI] [PMC free article] [PubMed] [Google Scholar]
- 29.Scheid L, Reusch A, Stehle P, Ellinger S. Antioxidant effects of cocoa and cocoa products ex vivo and in vivo: is there evidence from controlled intervention studies? Curr Opin Clin Nutr Metab Care. 2010 Nov;13(6):737–42. doi: 10.1097/MCO.0b013e32833ec45c. [DOI] [PubMed] [Google Scholar]
- 30.Ramiro-Puig E, Urpi-Sarda M, Perez-Cano FJ, Franch A, Castellote C, Andres-Lacueva C, et al. Cocoa-enriched diet enhances antioxidant enzyme activity and modulates lymphocyte composition in thymus from young rats. J Agric Food Chem. 2007 Aug 8;55(16):6431–8. doi: 10.1021/jf070487w. [DOI] [PubMed] [Google Scholar]
- 31.Cakir I, Perello M, Lansari O, Messier NJ, Vaslet CA, Nillni EA. Hypothalamic Sirt1 regulates food intake in a rodent model system. PLoS One. 2009;4(12):e8322. doi: 10.1371/journal.pone.0008322. [DOI] [PMC free article] [PubMed] [Google Scholar]
- 32.Toyokuni S, Tanaka T, Kawaguchi W, Fang NR, Ozeki M, Akatsuka S, et al. Effects of the phenolic contents of Mauritian endemic plant extracts on promoter activities of antioxidant enzymes. Free Radic Res. 2003 Nov;37(11):1215–24. doi: 10.1080/10715760310001598150. [DOI] [PubMed] [Google Scholar]
- 33.Fernandez-Pachon MS, Berna G, Otaolaurruchi E, Troncoso AM, Martin F, Garcia-Parrilla MC. Changes in antioxidant endogenous enzymes (activity and gene expression levels) after repeated red wine intake. J Agric Food Chem. 2009 Aug 12;57(15):6578–83. doi: 10.1021/jf901863w. [DOI] [PubMed] [Google Scholar]
- 34.Linke A, Adams V, Schulze PC, Erbs S, Gielen S, Fiehn E, et al. Antioxidative effects of exercise training in patients with chronic heart failure: increase in radical scavenger enzyme activity in skeletal muscle. Circulation. 2005 Apr 12;111(14):1763–70. doi: 10.1161/01.CIR.0000165503.08661.E5. [DOI] [PubMed] [Google Scholar]
- 35.Si H, Fu Z, Babu PV, Zhen W, Leroith T, Meaney MP, et al. Dietary epicatechin promotes survival of obese diabetic mice and Drosophila melanogaster. J Nutr. 2011 Jun;141(6):1095–100. doi: 10.3945/jn.110.134270. [DOI] [PMC free article] [PubMed] [Google Scholar]
- 36.Wray DW, Nishiyama SK, Donato AJ, Carlier P, Bailey DM, Uberoi A, et al. The paradox of oxidative stress and exercise with advancing age. Exerc Sport Sci Rev. 2011 Apr;39(2):68–76. doi: 10.1097/JES.0b013e31820d7657. [DOI] [PMC free article] [PubMed] [Google Scholar]


