

Abstract
Background & Aims
The gold standard in assessing liver fibrosis is biopsy despite limitations like invasiveness and sampling error and complications including morbidity and mortality. Therefore, there is a major unmet medical need to quantify fibrosis noninvasively to facilitate early diagnosis of chronic liver disease and provide a means to monitor disease progression. The goal of this study was to evaluate the ability of several magnetic resonance imaging (MRI) techniques to stage liver fibrosis.
Methods
A gadolinium (Gd)-based MRI probe targeted to type I collagen (termed EP-3533) was utilized to noninvasively stage liver fibrosis in a carbon tetrachloride (CCl4) mouse model and the results were compared to other MRI techniques including relaxation times, diffusion and magnetization transfer measurements.
Results
The most sensitive MR biomarker was the change in liver:muscle contrast to noise ratio (ΔCNR) after EP-3533 injection. We observed a strong positive linear correlation between ΔCNR and liver hydroxyproline (i.e. collagen) levels (r=0.89) as well as ΔCNR and conventional Ishak fibrosis scoring. In addition, the area under the receiver operating curve (AUR0C) for distinguishing early (Ishak ≤3) from late (Ishak ≥ 4) fibrosis was 0.942±0.052 (p<0.001). By comparison, other MRI techniques were not as sensitive to changes in fibrosis in this model.
Conclusions
We have developed a MRI technique using a collagen-specific probe for diagnosing and staging liver fibrosis, and validated it in the CCl4 mouse model. This approach should provide a better means to monitor disease progression in patients.
Keywords: fibrosis, MRI, molecular imaging, type 1 collagen, noninvasive, gadolinium, EP-3533, CCl4
INTRODUCTION
Liver fibrosis is the result of repeated hepatic injury which causes the chronic activation of tissue repair mechanisms to replace necrotic tissue with extracellular matrix scar [1]. Historically, liver fibrosis was a consequence of alcohol excess or hepatitis B or C infection, but recent increases in non-alcoholic steatohepatitis as a result of diabetes, fatty liver disease and the metabolic syndrome have increased the prevalence of liver fibrosis. If the underlying cause of disease is suppressed or removed early enough, liver fibrosis has the potential to regress to a lesser stage or even reverse to a normal architecture [2]. However, if left unchecked, fibrosis will progress to cirrhosis, an advanced stage of the disease estimated to affect 1–2% of the world’s population [3–4]. The major clinical consequences of cirrhosis are impaired liver function and development of hepatocellular carcinoma (HCC), both of which increase the risk of death. Therefore, there exists a major unmet medical need for techniques that can be used to identify disease progression in patients as well as to monitor response to therapy.
The gold standard in assessing liver fibrosis is biopsy despite several limitations [5]. For example, significant complications following liver biopsy, defined as requiring hospital admission or prolonged hospital stay, occur in 1–5% of patients and mortality has been reported between 0.01 and 0.1% [6–7]. In addition, biopsy suffers from sampling error, inter-observer variability and does not sample differences in disease across the entire organ. Of note, even for advanced stages of liver fibrosis such as cirrhosis, error rates in diagnosis of 33% have been reported [8]. Repeated biopsies to evaluate disease progression or response to treatment are unattractive due to patient compliance and increased risk of complications. For all of these reasons, noninvasive strategies that can repeatedly assess liver fibrosis throughout the whole organ are urgently needed.
Unfortunately, conventional imaging has not been able to detect liver fibrosis at a mild to moderate stage although elastography has shown promise in recent years [9]. Since liver fibrosis is characterized by excess deposition of extracellular matrix proteins including type I collagen, we hypothesized that a magnetic resonance imaging (MRI) agent providing a measure of collagen levels would have broad utility in not only staging liver fibrosis but also monitoring response to treatment. Type I collagen is an attractive target because its concentration increases as fibrosis progresses [10] and its extracellular location makes it readily accessible to the probe. MRI offers several technical advantages compared to other imaging techniques including its deep tissue penetration, high spatial resolution and complete coverage of the entire liver. In addition, MRI does not require ionizing radiation which is beneficial in monitoring a disease that is known to take years to progress or regress and thus would most likely require several rounds of imaging.
Previously, we identified a 16 amino acid peptide that had specificity for type 1 collagen and functionalized it for MRI through the addition of 3 GdDTPA chelators. We demonstrated that this compound, termed EP-3533, bound reversibly (Kd=1.8 μM) and non-saturably to type I collagen and could be used to detect myocardial scar [11]. Recently, we demonstrated that EP-3533 could identify the presence of advanced liver fibrosis in two rodent models (diethylnitrosamine-treated rats and carbon tetrachloride (CCl4)-treated mice) [12]. However, that pilot feasibility study was not powered to stage fibrosis as the animals were only imaged at a single time point. Here, we show that EP-3533 can reliably distinguish different stages of disease in the CCl4 mouse model. We also compared EP-3533 enhanced MRI to other MRI techniques previously reported to detect fibrosis, such as diffusion and relaxation time measurements. In addition, we performed biodistribution, pharmacokinetics, and in vitro pharmacology studies to evaluate the safety of EP-3533.
MATERIALS AND METHODS
Animal models
All experiments were performed in accordance with the NIH Guide for the Care and Use of Laboratory Animals and were approved by the institution’s animal care and use committee. Strain A/J male mice (Jackson Laboratories, Bar Harbor, ME) were administered 0.1 mL of a 40% solution of CCl4 (Sigma, St. Louis, MO) in olive oil by oral gavage three times a week for either 6, 12 or 18 weeks to induce fibrosis at different stages (n=6 for all time points). Controls received only pure olive oil. Animals were imaged one week after the last injection to avoid acute effects of CCl4.
Probe
EP-3533 comprises a ten amino acid cyclic peptide conjugated to three gadolinium (Gd) moieties, and was synthesized as previously reported [11]. The peptide confers affinity for type I collagen and the Gd moieties provide strong signal enhancement (relaxivity=16.2 mM−1s−1 (5.4 per Gd ion) at 4.7T) [13].
MR imaging and analysis
Animals were anesthetized with isoflurane (1–2%) and placed in a specially designed cradle with body temperature maintained at 37°C. The tail vein was cannulated for intravenous (iv) delivery of the contrast agent while the animal was positioned in the scanner. Imaging was performed at 4.7T using a small bore animal scanner (Bruker Biospec) with a custom-built volume coil. In our pilot feasibility study, we used a somewhat arbitrary dose of 20 μmol/kg EP-3533 for MR imaging of liver fibrosis [12]. A high dose of EP-3533 will result in greater MR signal enhancement but could also saturate the target (i.e. collagen) and lead to non-specific enhancement. Therefore, we reasoned that it would be possible to increase the sensitivity of our prior technique through dose optimization of the probe. We evaluated doses of 5, 10, 20, and 40 μmol/kg and chose a dose of 10 μmol/kg for subsequent studies.
The imaging paradigm involved a series of baseline images, followed by a bolus iv injection of EP-3533, and further imaging out to 45 minutes post injection. The baseline imaging included T1, T2, T1, apparent diffusion coefficient (ADC), and magnetization transfer ratio (MTR) quantification. Imaging protocols were similar to those used in other rodent MRI studies [12, 14–17]. In order to minimize the overall imaging time, we only performed 2–3 of these baseline scans per mouse and these baseline scans were randomized over the population. Details of the MRI acquisition parameters are given in the Supporting Information.
MTR is calculated as: MTR=[(S0−S)/S0], where S0 is the signal obtained without pre-saturation, and S is the signal obtained with pre-saturation. ADC is calculated from fitting the change in signal intensity as a function of b-value: S/S0=exp(−b*ADC). T1 is calculated from a 3 parameter fit (T1, S0, A) of the dependence of signal intensity (S) on inversion time (TI): S=S0[1− A*exp(−TI/T1)]. T2 is calculated from the change in signal intensity as a function of echo time (TE): S/S0=exp(−TE/T2). T1 is calculated from the change in signal intensity as a function of spin lock time (SL): S/S0=exp(−SL/T1).
Tissue analysis
Formalin-fixed samples were embedded in paraffin, cut into 5 μm-thick sections and stained with Sirius red according to standard procedures. Sirius red stained sections were analyzed by a pathologist, who was blinded to the study, to score the amount of liver disease according to the method of Ishak. Hydroxyproline in tissue was quantified by HPLC analysis as previously described [18]. Gd was quantified in tissue acid digests by inductively coupled plasma-mass spectrometry using dysprosium as an internal standard. Hydroxyproline and Gd are expressed as amounts per wet weight of tissue.
Statistics
All data are shown as mean±SEM. Differences among groups were tested with repeated measures ANOVA followed by Student-Newman-Keuls post hoc test. A Kruskal-Wallis test followed by post hoc Dunn-Holland-Wolfe test was performed to assess differences in Ishak scores. The Pearson correlation coefficient was computed to assess quality of linear correlations and a t-statistic was calculated based on the null hypothesis that the correlation coefficient was zero. Receiver operating curve (ROC) analysis was performed using Prism 6 (GraphPad software). p<0.05 was considered as significant.
RESULTS
Dose optimization of EP-3533 was done in mice treated with CCl4 for 18 weeks which causes advanced fibrosis as illustrated by Sirius red staining (Supp. Fig. 1). MRI was performed with four doses of EP-3533 (5, 10, 20 or 40 μmol/kg) in the fibrotic CCl4-treated mice and controls that had no fibrosis. In order to find the optimal dose for distinguishing fibrosis, we quantified the percentage of signal enhancement in the liver at 40 min post EP-3533 injection compared to the liver signal prior to probe injection. As expected, liver signal enhancement increased as the dose increased, but the ability to distinguish fibrotic animals from controls diminished with increasing dose (Supp. Fig. 1). By comparison, at the lowest dose there was good discrimination between fibrotic and control animals, but the signal enhancement was low resulting in a larger relative error. A dose of 10 μmol/kg could reproducibly discriminate fibrotic animals from controls and was therefore chosen for all the remaining studies.
Before EP-3533 can be successfully translated into a clinical setting, it is necessary to have an understanding of its pharmacokinetics. To address this issue, we performed 3D T1-weighted MR imaging of the thorax and abdomen of mice injected intravenously with EP-3533 in order to estimate signal washout rates from blood and other organs (Supp. Fig. 2). The blood half-life of EP-3533 was 19±2 minutes, consistent with its extracellular distribution and primary renal clearance as indicated from the strong MR enhancement in the kidneys and bladder (Supp. Fig. 2). There was no difference in blood half-life in fibrotic mice versus controls. We also performed a whole body biodistribution analysis of Gd in order to track the location of EP-3533 at 2 and 24 h post injection (Supp Fig. 2). By 24 h, the probe was largely eliminated from the body with the exception of a small retention in the bone and kidneys.
To evaluate potential off-target effects, we ran an in vitro “lead side-effect panel” from Cerep to measure the ability of EP-3533 to inhibit receptor binding or enzymatic activity in 33 different in vitro assays (Supp. Table 1). EP-3533 was tested at 10 μM and had no measurable effect in terms of inhibiting receptor binding or enzymatic activity. Taken together, these results suggest that EP-3533 is specific for its target and rapidly eliminated from the body.
In order to determine whether EP-3533 could distinguish early stages of liver fibrosis from more advanced disease, we treated mice with CCl4 or vehicle control for 6, 12 or 18 weeks to cause varying stages of liver fibrosis. Mice were MR imaged prior to and immediately following an iv injection of 10 μmol/kg EP-3533. The baseline MRI also included measurements of T1 [14], T1ρ [16], T2 [14], ADC [15, 19] and MTR [17] as these measurements have also been reported to correlate with fibrosis. All the imaging results were correlated with histological Ishak scoring of liver fibrosis.
As expected, disease progressed in a stepwise fashion in the CCl4 mouse model as determined by Sirius red staining (Fig. 1A). After 6 weeks of CCl4 administration, most animals had extensive portal fibrosis with occasional bridging fibrosis (Ishak 2–3), and the disease progressed to complete bridging fibrosis with appearance of some regenerative nodules (Ishak 4–5) by 12 to 18 weeks. Consistently, collagen deposition as determined by hydroxyproline analysis of liver tissue increased along the same pattern as the Ishak score (Fig. 1B). We also quantified the amount of collagen deposition by calculating the total amount of Sirius red staining in representative slides from each animal and this measurement correlated well with Ishak score (Fig. 1C) and liver hydroxyproline levels (Fig. 1D).
Fig. 1. Characterization of a CCl4-induced mouse model of liver fibrosis.
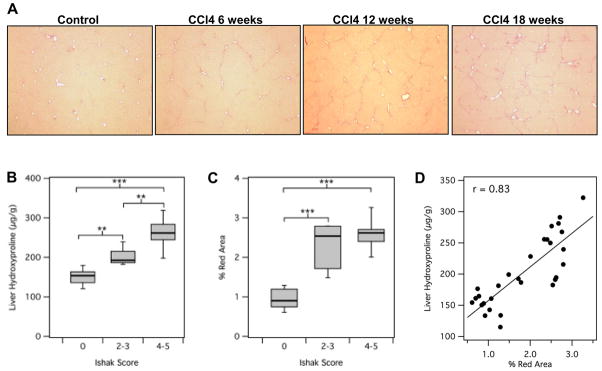
(A) Representative images of Sirius red staining after CCl4 administration for 6, 12 or 18 weeks. (B) Total collagen as assessed by hydroxyproline analysis was calculated as disease progressed as determined by Ishak scoring. (C) Sirius red staining was quantified using Image J software and compared to disease progression. (D) Correlation between total collagen (hydroxyproline) and Sirius red quantification. **p<0.001 and ***p<0.0001.
The most sensitive MR measure that we found to relate MR signal to fibrosis was the change in contrast to noise ratio (CNR) between liver and adjacent skeletal muscle after injection of EP-3533. For this analysis, we drew a large region of interest on the liver, excluding any large blood vessels, and measured the signal intensity (SI). We also measured SI in the dorsal muscle. Noise was estimated from the standard deviation (SD) of SI in the air adjacent to the animal. CNR was calculated as {(SIliver−SImuscle)/SDair}. We used an inversion recovery sequence with an inversion time that nulled the signal in the liver prior to probe injection. This provided the largest dynamic range in liver signal change, as seen in Fig. 2A where representative images show the anatomy of the mouse in axial view with stomach, liver and dorsal muscle labeled. The greyscale image shows the anatomical image at the level where the MR measurement was performed while the false color overlay is the difference image between the inversion recovery image taken 40 minutes post-injection and the image taken prior to injection of EP-3533. Post-probe, we see significant enhancement in the liver of both the control and fibrotic animals, but little enhancement in the muscle. As expected, we observed much greater enhancement in the liver of the fibrotic animal.
Fig. 2. Staging of liver fibrosis using collagen-enhanced MRI.

(A) Representative axial MR images of a control (Ishak 0) and fibrotic (Ishak 5) mouse showing the liver, stomach and dorsal muscle. False color overlay is the difference image between post- and pre-injection images of EP-3533. Both images rendered at the same scale. (B) ΔCNR(liver:muscle) was calculated as disease progressed as determined by Ishak scoring. (C) The amount of probe present in the ex vivo liver (% Injected Dose Gd/g Liver) was calculated as disease progressed as determined by Ishak scoring. (D) Correlation between ΔCNR(liver:muscle) and total collagen (hydroxyproline). (E) Correlation between ΔCNR(liver:muscle) and Sirius red quantification. #p<0.05, *p<0.01 and ***p<0.0001.
As shown in Fig. 2B, the change in liver:muscle contrast after EP-3533 injection (CNR liver:muscle) increases with disease progression (Ishak score) in the fibrotic CCl4-injured mice. Consistently, ex vivo liver Gd levels, another marker for probe uptake, also increased along with the Ishak score (Fig. 2C). There were also strong correlations between (CNR liver:muscle) and liver hydroxyproline levels (r=0.89, Fig. 2D) and (CNR liver:muscle) and Sirius red quantification (r=0.83, Fig. 2E). Both of these latter results highlight the strong specificity of EP-3533 for collagen. Finally, we calculated the area under the ROC (AUROC) for detecting fibrosis (Ishak 0 versus Ishak ≥2) to be 0.933±0.059 (95% CI=0.82–1.05, p=0.0011; Supp. Fig. 3). For distinguishing early from later stages of fibrosis (Ishak ≤3 versus Ishak ≥4), AUROC was calculated as 0.942±0.052 (95% CI=0.84–1.05, p=0.00087; Supp. Fig. 3).
We also examined other MRI measures that were unrelated to the collagen probe to determine if MRI alone could be sensitive to liver fibrosis. There have been literature reports that relaxation time (T1, T2 or T1ρ), diffusion (ADC) and magnetization transfer measurements could serve as sensitive markers of liver fibrosis [14–17, 19]. However in this animal model, we observed only weak correlations of these parameters with liver hydroxyproline levels (Fig. 3A), and in general, the changes observed were on the order of the uncertainty in the measurement. Only T1ρ measurements could significantly distinguish fibrotic animals from controls in terms of Ishak scoring (Fig. 3B), but T1ρ could not distinguish moderate (Ishak 2–3) from severe (Ishak 4–5) fibrosis. The other MR measurements (T1, T2, ADC, MTR) could not classify animals into groups based on Ishak scoring.
Fig. 3. Analysis of other MR measurements for diagnosing liver fibrosis.
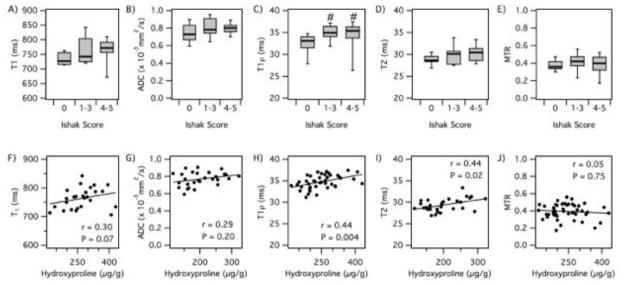
Correlation of MR measurements with Ishak score and total liver collagen (hydroxyproline, Hyp). (A) T1 relaxation time vs Ishak; (B) apparent diffusion coefficient (ADC) vs Ishak; (C) T1ρ relaxation time vs Ishak; (D) T2 relaxation time vs Ishak; (E) magnetization transfer ratio (MTR) vs Ishak; (F) T1 vs Hyp; (G) ADC vs Hyp; (H) T1ρ vs Hyp; (I) T2 vs Hyp; (J) MTR vs Hyp. #p<0.05.
The lack of a noninvasive means for assessing liver fibrosis is a major obstacle to the development of anti-fibrotic drugs [9]. Since there are currently no approved drugs for the treatment of liver fibrosis, we used the common approach of toxin withdrawal as a model of fibrosis regression. Mice were treated with CCl4 for 9 weeks to induce liver fibrosis and then one group of mice continued to receive CCl4 while another group had CCl4 withdrawn. As can be seen in Fig. 4A–B, withdrawal of CCl4 improved liver disease as assessed by Sirius red staining. And in fact, histological scoring of the Sirius red staining demonstrated that on average the Ishak score improved by 2 stages in the mice that had CCl4 withdrawn (Fig. 4C). MR imaging with EP-3533 could not detect a difference in fibrosis stage between these two groups of mice (Fig. 4D). Interestingly, a recent report demonstrated that even though histological improvement of disease was observed after CCl4 withdrawal, total collagen as assessed by hydroxyproline analysis did not decrease for at least 12 weeks [20]. Consistently, when we analyzed total collagen levels (hydroxyproline) in our animals, we did not detect a significant difference between the animals that continued to receive CCl4 and those that had it withdrawn (Fig. 4E). These results therefore further highlight the specificity of EP-3533 to collagen as opposed to liver disease.
Fig. 4. Collagen-targeted MRI of liver fibrosis after CCl4 withdrawal.

(A) Representative images of Sirius red staining of livers from mice treated with either CCl4 for 18 weeks (CCl4) or CCl4 for 9 weeks followed by 9 weeks of withdrawal (Withdrawal). Control animals received oral gavage of vehicle only. Sirius red staining was (B) quantified using Image J software or (C) assessed by Ishak scoring. (D) ΔCNR(liver:muscle) was calculated. (E) Total collagen was determined by hydroxyproline analysis. #p< 0.05, *p<0.01, **p<0.001 and ***p<0.0001.
DISCUSSION
Here we show for the first time that collagen-enhanced MRI can accurately monitor and stage liver fibrosis progression in CCl4-treated mice. Further, we observed a remarkable correlation between MR imaging and total collagen levels as well as a strong correlation between MR imaging and Ishak score. This result is probably explained by the fact that the probe is specifically targeting collagen. However, it is also worth noting that while Ishak scoring suffers from the limitation of biopsy and only represents histological analysis of a very small sample of the liver, the hydroxyproline analysis was performed on ~20% of the total liver and therefore might better reflect the extent of fibrosis that is actually present in the entire liver. This idea is supported by the variation in collagen levels observed within the same Ishak score and suggests that collagen-enhanced MRI of the entire liver might better represent disease stage than histological scoring of biopsied liver tissue.
To our knowledge, this is the first report to directly compare several MR measures in the same fibrotic animals. Relaxation times, ADC and MTR will depend on a number of factors such as protein content, iron concentration, edema, and extracellular volume. This makes changes in such parameters difficult to interpret. For instance, increased extracellular volume may be expected to increase water diffusion, but increased matrix production may have the opposite effect. In line with what has been observed previously, we observed trends in how these parameters changed with increasing fibrosis. However, the magnitude of the change with disease was on the order of the uncertainty in the measurement itself, and this resulted in relatively weak correlations. The results with these intrinsic MR markers serve to underscore the significance of our finding with the collagen-targeted probe. Direct molecular MR imaging of collagen with a targeted probe is much more sensitive to changes in fibrosis.
MR elastography (MRE) has shown great promise in staging fibrosis. MRE uses a vibration source to generate low frequency mechanical waves in tissue, and these waves can be detected by MRI and processed to give maps of mechanical properties such as liver stiffness. Because of the additional hardware required for MRE, we were unable to directly compare our molecular imaging approach with MRE in this study. However the AUROC analysis performed here to distinguish different stages of fibrosis showed a similar diagnostic accuracy to MRE [21]. We note that molecular imaging with the EP-3533 is compatible with MRE, and that the two techniques could be combined for potentially greater accuracy.
There are also several other approaches for the noninvasive assessment of fibrosis [22]. Panels of serum biomarkers, like FibroTest [23] and the enhanced liver fibrosis (ELF) panel of ECM markers [24], have been developed as predictors of liver fibrosis. In general, most of these tests can rule-in or rule-out fibrosis, but can not reliably differentiate stages of fibrosis [9]. Transient ultrasound elastography (FibroScan) has been widely studied [25]. A recent meta-analysis of 50 transient elastography studies of the liver concluded that the technique can be performed with excellent diagnostic accuracy and is independent of the underlying liver disease for the diagnosis of cirrhosis [26]. However, for the diagnosis of earlier stages of fibrosis, high variability of the ROC was found that is dependent on the underlying liver disease. Thus, all of these techniques require further evaluation and optimization, but we believe that collagen-enhanced MRI could be performed along side these other tests in order to more accurately diagnose liver fibrosis.
It remains to be seen whether collagen-enhanced MR imaging can be used to monitor fibrosis regression in response to treatment or intervention (for example removal of the insulting agent, like alcohol, HCV or fatty liver). We tried to use CCl4 withdrawal as a model of fibrosis regression but observed no changes in total collagen as assessed by hydroxyproline analysis even though the animals appeared histologically better by Sirius red staining. This confounding result may be explained by differences in the ability of these assays to detect collagen once CCl4 has been withdrawn. Our results suggest that collagen is modified in some way, perhaps just through digestion, which makes it detectable by hydroxyproline analysis and collagen-targeted MRI but not Sirius red staining. In fact, recent results from the Schuppan group have also demonstrated a discrepancy between hydroxyproline analysis and Sirius red staining in monitoring collagen levels after CCl4 withdrawal and they noted that total collagen (as assessed by hydroxyproline) did not decrease for at least 12 weeks after withdrawal [20]. It is currently unknown for how long intervention is required to decrease collagen levels in humans. If collagen levels do not subside for an extended period of time, then EP-3533 might not be as effective in monitoring disease regression under these situations. However, a variety of fibrolytic agents that would presumably reduce collagen levels are now under development and it is feasible that their efficacy could be monitored with EP-3533.
We performed our studies using a high field, dedicated small animal scanner. However, we anticipate no particular challenges in translating to a clinical setting in a typical 1.5T scanner. The Gd dose used here (0.03 mmol/kg total) is lower than that of conventional Gd contrast (0.1 mmol/kg). We also note that the relaxivity of EP-3533 is 3 times higher at 1.5T than at 4.7T, and thus it may be possible to reduce this dose even further at low field [11, 13]. The most sensitive MR change to fibrosis in this study was simply the change in liver to muscle CNR when comparing a delayed post-probe image to the baseline image. We used an inversion prepared turbo spin echo type sequence that is analogous to sequences standard in body imaging on clinical scanners. Thus in a clinical setting, it should be feasible to obtain whole liver images in a single breath-hold that would enable a spatially resolved, whole organ measure of fibrosis.
It should also be mentioned that the ongoing cycles of injury and repair that lead to accumulation of scar tissue is similar whether it occurs in response to chronic injury of the liver or other organs like the kidney or lungs. Cardiac [27], renal [28] and pulmonary fibrosis [29] are all characterized by excess deposition of type I collagen. Therefore, our MRI approach to monitor changes in collagen during liver fibrosis should also be applicable to these other fibrotic pathologies. However, the distribution of the probe to the kidneys will result in a high background that may make renal fibrosis quantification challenging. The evaluation of fibrosis in other organ systems is currently under investigation in our laboratory.
In conclusion, we have shown that EP-3533 is sensitive to changes in type I collagen levels observed as fibrosis progresses in CCl4-treated mice and that collagen-enhanced MRI can accurately stage fibrosis in these animals. Since EP-3533 is rapidly excreted and demonstrates minimal non-specific binding, it should be examined for its ability to detect liver fibrosis in humans. Combined with other noninvasive strategies like serum tests and elastography, collagen-enhanced MRI might offer a means to not only better identify which patients have rapidly progressing disease but also to monitor interventions in these patients.
Supplementary Material
Acknowledgments
Financial support: This work was supported by grants from the National Cancer Institute (CA140861 (B.C.F.)), the National Institute of Biomedical Imaging and Bioengineering (EB009062 (P.C.)), and an Innovation Award from Sanofi (A.J.S and P.C.).
List of abbreviations
- MRI
magnetic resonance imaging
- Gd
gadolinium
- CCl4
carbon tetrachloride
- HCC
hepatocellular carcinoma
- iv
intravenous
- ADC
apparent diffusion coefficient
- MTR
magnetization transfer ratio
- TI
inversion time
- TE
echo time
- SL
spin lock time
- ROC
receiver operating curve
- CNR
contrast to noise ratio
- SI
signal intensity
- SD
standard deviation
- AUROC
area under the ROC
- MRE
MR elastography
- ELF
enhanced liver fibrosis
Footnotes
Conflict of interests: P.C. has >5% equity in Collagen Medical, LLC, a company working to commercialize the MRI probe used in this study. All other authors have no conflicts.
Publisher's Disclaimer: This is a PDF file of an unedited manuscript that has been accepted for publication. As a service to our customers we are providing this early version of the manuscript. The manuscript will undergo copyediting, typesetting, and review of the resulting proof before it is published in its final citable form. Please note that during the production process errors may be discovered which could affect the content, and all legal disclaimers that apply to the journal pertain.
References
- 1.Hernandez-Gea V, Friedman SL. Pathogenesis of liver fibrosis. Annu Rev Pathol. 2011;6:425–456. doi: 10.1146/annurev-pathol-011110-130246. [DOI] [PubMed] [Google Scholar]
- 2.Iredale JP. Models of liver fibrosis: exploring the dynamic nature of inflammation and repair in a solid organ. J Clin Invest. 2007;117:539–548. doi: 10.1172/JCI30542. [DOI] [PMC free article] [PubMed] [Google Scholar]
- 3.Schuppan D, Afdhal NH. Liver cirrhosis. Lancet. 2008;371:838–851. doi: 10.1016/S0140-6736(08)60383-9. [DOI] [PMC free article] [PubMed] [Google Scholar]
- 4.Friedman SL. Evolving challenges in hepatic fibrosis. Nat Rev Gastroenterol Hepatol. 2010;7:425–436. doi: 10.1038/nrgastro.2010.97. [DOI] [PubMed] [Google Scholar]
- 5.Manning DS, Afdhal NH. Diagnosis and quantitation of fibrosis. Gastroenterology. 2008;134:1670–1681. doi: 10.1053/j.gastro.2008.03.001. [DOI] [PubMed] [Google Scholar]
- 6.Myers RP, Fong A, Shaheen AA. Utilization rates, complications and costs of percutaneous liver biopsy: a population-based study including 4275 biopsies. Liver Int. 2008;28:705–712. doi: 10.1111/j.1478-3231.2008.01691.x. [DOI] [PubMed] [Google Scholar]
- 7.Terjung B, Lemnitzer I, Dumoulin FL, Effenberger W, Brackmann HH, Sauerbruch T, et al. Bleeding complications after percutaneous liver biopsy. An analysis of risk factors Digestion. 2003;67:138–145. doi: 10.1159/000071293. [DOI] [PubMed] [Google Scholar]
- 8.Afdhal NH, Nunes D. Evaluation of liver fibrosis: a concise review. Am J Gastroenterol. 2004;99:1160–1174. doi: 10.1111/j.1572-0241.2004.30110.x. [DOI] [PubMed] [Google Scholar]
- 9.Popov Y, Schuppan D. Targeting liver fibrosis: strategies for development and validation of antifibrotic therapies. Hepatology. 2009;50:1294–1306. doi: 10.1002/hep.23123. [DOI] [PubMed] [Google Scholar]
- 10.Bedossa P, Dargere D, Paradis V. Sampling variability of liver fibrosis in chronic hepatitis C. Hepatology. 2003;38:1449–1457. doi: 10.1016/j.hep.2003.09.022. [DOI] [PubMed] [Google Scholar]
- 11.Caravan P, Das B, Dumas S, Epstein FH, Helm PA, Jacques V, et al. Collagen-targeted MRI contrast agent for molecular imaging of fibrosis. Angew Chem Int Ed Engl. 2007;46:8171–8173. doi: 10.1002/anie.200700700. [DOI] [PubMed] [Google Scholar]
- 12.Polasek M, Fuchs BC, Uppal R, Schuhle DT, Alford JK, Loving GS, et al. Molecular MR imaging of liver fibrosis: a feasibility study using rat and mouse models. J Hepatol. 2012;57:549–555. doi: 10.1016/j.jhep.2012.04.035. [DOI] [PMC free article] [PubMed] [Google Scholar]
- 13.Helm PA, Caravan P, French BA, Jacques V, Shen L, Xu Y, et al. Postinfarction myocardial scarring in mice: molecular MR imaging with use of a collagen-targeting contrast agent. Radiology. 2008;247:788–796. doi: 10.1148/radiol.2473070975. [DOI] [PMC free article] [PubMed] [Google Scholar]
- 14.Chow AM, Gao DS, Fan SJ, Qiao Z, Lee FY, Yang J, et al. Measurement of liver T(1) and T(2) relaxation times in an experimental mouse model of liver fibrosis. J Magn Reson Imaging. 2012;36:152–158. doi: 10.1002/jmri.23606. [DOI] [PubMed] [Google Scholar]
- 15.Chow AM, Gao DS, Fan SJ, Qiao Z, Lee FY, Yang J, et al. Liver fibrosis: an intravoxel incoherent motion (IVIM) study. J Magn Reson Imaging. 2012;36:159–167. doi: 10.1002/jmri.23607. [DOI] [PubMed] [Google Scholar]
- 16.Wang YX, Yuan J, Chu ES, Go MY, Huang H, Ahuja AT, et al. T1rho MR imaging is sensitive to evaluate liver fibrosis: an experimental study in a rat biliary duct ligation model. Radiology. 2011;259:712–719. doi: 10.1148/radiol.11101638. [DOI] [PubMed] [Google Scholar]
- 17.Guo J, Erickson R, Trouard T, Galons JP, Gillies R. Magnetization transfer contrast imaging in Niemann pick type C mouse liver. J Magn Reson Imaging. 2003;18:321–327. doi: 10.1002/jmri.10404. [DOI] [PubMed] [Google Scholar]
- 18.Hutson PR, Crawford ME, Sorkness RL. Liquid chromatographic determination of hydroxyproline in tissue samples. J Chromatogr B Analyt Technol Biomed Life Sci. 2003;791:427–430. doi: 10.1016/s1570-0232(03)00248-4. [DOI] [PubMed] [Google Scholar]
- 19.Fujimoto K, Tonan T, Azuma S, Kage M, Nakashima O, Johkoh T, et al. Evaluation of the mean and entropy of apparent diffusion coefficient values in chronic hepatitis C: correlation with pathologic fibrosis stage and inflammatory activity grade. Radiology. 2011;258:739–748. doi: 10.1148/radiol.10100853. [DOI] [PubMed] [Google Scholar]
- 20.Popov Y, Sverdlov DY, Sharma AK, Bhaskar KR, Li S, Freitag TL, et al. Tissue transglutaminase does not affect fibrotic matrix stability or regression of liver fibrosis in mice. Gastroenterology. 2011;140:1642–1652. doi: 10.1053/j.gastro.2011.01.040. [DOI] [PMC free article] [PubMed] [Google Scholar]
- 21.Yin M, Talwalkar JA, Glaser KJ, Manduca A, Grimm RC, Rossman PJ, et al. Assessment of hepatic fibrosis with magnetic resonance elastography. Clin Gastroenterol Hepatol. 2007;5:1207–1213. e1202. doi: 10.1016/j.cgh.2007.06.012. [DOI] [PMC free article] [PubMed] [Google Scholar]
- 22.Pinzani M, Vizzutti F, Arena U, Marra F. Technology Insight: noninvasive assessment of liver fibrosis by biochemical scores and elastography. Nat Clin Pract Gastroenterol Hepatol. 2008;5:95–106. doi: 10.1038/ncpgasthep1025. [DOI] [PubMed] [Google Scholar]
- 23.Imbert-Bismut F, Ratziu V, Pieroni L, Charlotte F, Benhamou Y, Poynard T. Biochemical markers of liver fibrosis in patients with hepatitis C virus infection: a prospective study. Lancet. 2001;357:1069–1075. doi: 10.1016/S0140-6736(00)04258-6. [DOI] [PubMed] [Google Scholar]
- 24.Rosenberg WM, Voelker M, Thiel R, Becka M, Burt A, Schuppan D, et al. Serum markers detect the presence of liver fibrosis: a cohort study. Gastroenterology. 2004;127:1704–1713. doi: 10.1053/j.gastro.2004.08.052. [DOI] [PubMed] [Google Scholar]
- 25.Sandrin L, Fourquet B, Hasquenoph JM, Yon S, Fournier C, Mal F, et al. Transient elastography: a new noninvasive method for assessment of hepatic fibrosis. Ultrasound Med Biol. 2003;29:1705–1713. doi: 10.1016/j.ultrasmedbio.2003.07.001. [DOI] [PubMed] [Google Scholar]
- 26.Friedrich-Rust M, Ong MF, Martens S, Sarrazin C, Bojunga J, Zeuzem S, et al. Performance of transient elastography for the staging of liver fibrosis: a meta-analysis. Gastroenterology. 2008;134:960–974. doi: 10.1053/j.gastro.2008.01.034. [DOI] [PubMed] [Google Scholar]
- 27.Weber KT, Sun Y, Bhattacharya SK, Ahokas RA, Gerling IC. Myofibroblast-mediated mechanisms of pathological remodelling of the heart. Nat Rev Cardiol. 2013;10:15–26. doi: 10.1038/nrcardio.2012.158. [DOI] [PubMed] [Google Scholar]
- 28.Liu Y. Cellular and molecular mechanisms of renal fibrosis. Nat Rev Nephrol. 2011;7:684–696. doi: 10.1038/nrneph.2011.149. [DOI] [PMC free article] [PubMed] [Google Scholar]
- 29.Wynn TA. Integrating mechanisms of pulmonary fibrosis. J Exp Med. 2011;208:1339–1350. doi: 10.1084/jem.20110551. [DOI] [PMC free article] [PubMed] [Google Scholar]
Associated Data
This section collects any data citations, data availability statements, or supplementary materials included in this article.